. 2025 May 6;10(12):e171364.
doi: 10.1172/jci.insight.171364. eCollection 2025 Jun 23.

Tumor suppressors in Sox2-mediated lung cancers promote distinct cell-intrinsic and immunologic remodeling

Affiliations

Tumor suppressors in Sox2-mediated lung cancers promote distinct cell-intrinsic and immunologic remodeling

Nisitha Sengottuvel et al. JCI Insight. .

Abstract

Non-small cell lung cancer (NSCLC) largely consists of lung squamous carcinoma (LUSC) and lung adenocarcinoma (LUAD). Alterations in the tumor protein p53 (TP53) and phosphatase and tensin homolog (PTEN) tumor suppressors are common in both subtypes, but their relationship with SOX2 is poorly understood. We deleted Trp53 or Pten in a C57BL/6 Sox2hi Nkx2-1-/- Lkb1-/- (SNL) genetic background and generated a highly metastatic LUSC cell line (LN2A; derived from a Sox2hi mouse model, followed by Trp53, Pten, and cyclin dependent kinase inhibitor 2A [Cdkn2a] deletion). Histologic and single-cell RNA-Seq analyses corroborated that SNL mice developed mixed tumors with both LUAD and LUSC histopathology while SNL-Trp53 and SNL-Pten mice developed LUAD and LN2A tumors that retained LUSC morphology. Compared with SNL mice, additional loss of Trp53 or Pten resulted in significantly reduced survival, increased tumor burden, and altered tumor mucin composition. We identified a subcluster of CD38+ tumor-associated inflammatory monocytes in the LN2A model that was significantly enriched for activation of the classical and alternative complement pathways. Complement factor B (CFB) is associated with poor survival in patients with LUSC, and we observed the LN2A model had significantly improved survival on a Cfb-/- background. Our findings demonstrate a cooperative role of Trp53 and Pten tumor suppressors in Sox2-mediated NSCLC tumor progression, mucin production, and remodeling of the immune tumor microenvironment.

Keywords: Genetics; Innate immunity; Mouse models; Oncology.


Figures

Figure 1
Figure 1. sgRNA-mediated CRISPR knockout of Trp53 and Pten in vivo leads to increased tumorigenesis and decreased survival in Sox2hi mice.
(A) CRISPR-mediated knockout mice were created through tracheal instillation of LentiCRISPRv2Cre plasmid containing Safe Harbor (SH), Trp53, or Pten sgRNAs (105 transfection units, TU). Virus was delivered into the lungs of mice. Mice (n = 8–17 per group) were monitored for up to 60 weeks and sacrificed upon tumor formation of greater than 5 mm. (B) SNL-Trp53 and SNL-Pten mice have significantly shorter survival times compared with SNL control mice (log-rank SNL-Trp53: P = 0.035, SNL-Pten P = 0.014, SNL n = 5, SNL-Trp53 n = 16, SNL-Pten n = 10). (C) Gross pathology images showing tumor burden (white outline) in SNL, SNL-Trp53, and SNL-Pten mice. (D) Representative imaging from coronal and axial views of CT scans showing disease burden over 8, 10, and 12 months for SNL and SNL-Trp53 mice and at 8, 10, and 11 months for SNL-Pten mice. Maximal disease burden highlighted with 3D tumor rendering images (right). (E) Total tumor counts from CT imaging (1-way ANOVA SNL-Trp53: P = 0.0016, SNL-Pten P = 0.0118). (F) Total tumor volumes by CT imaging. Volumes were calculated by measuring CT length × width2/2 (mm3). (1-way ANOVA SNL-Trp53: P = 0.2889, SNL-Pten P = 0.0276.) (G) Total tumor counts from gross pathology (1-way ANOVA SNL-Trp53: P = 0.2025, SNL-Pten P = 0.7716). (EG) Data shown as mean ± SEM.
Figure 2
Figure 2. The development of the highly metastatic LN2A LUSC murine model.
(A) In vivo selection was performed using JH716-18 LUSC cell line to create a metastatic LUSC cell line that could be injected into immune-competent C57BL/6 mice. The parental LUSC cell line, JH716-18, was injected into C57BL/6 mice. A lymph node tumor was collected at the time of necropsy and grown in vitro to create JH716-18-LN1A (LN1A). LN1A was then injected into C57BL/6 mice. A lymph node tumor was collected at the time of necropsy and grown in vitro to create JH716-18 LN2A (LN2A). (B) When injected into mice, LN2A reveals a highly metastatic phenotype with significantly decreased survival (log-rank JH716-18-LN1A: P = 0.438, LN2A P < 0.0001) compared with the parental JH716-18 and a prior subclone, LN1A. (N = 10–16 /group.) (C) LN2A remains highly metastatic even when lowering the number of cells injected (log-rank P < 0.0001) (N = 6–11/group). (D) Representative gross necropsy images from LN2A. (E) IHC-DAB of lung tumors from SNL, SNL-Trp53, SNL-Pten, and LN2A mice for TRP53 staining and p-AKT staining (scale bar = 200 μm).
Figure 3
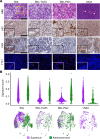
Figure 3. Genetic regulation of squamous or adenocarcinoma transdifferentiation of NSCLC tumors.
(A) Histology was performed on FFPE tumor tissue sections of the lung tumor (SNL, SNL-Trp53, SNL-Pten) or LN tumors (LN2A). Tissues were stained with H&E, squamous markers p63 and CK5, and adenocarcinoma marker TTF1, red (DAPI, blue). White arrowheads = keratin deposits. Yellow box = region of adenomatous and squamous histologies mixing. Scale bar = 200 μm. (B) Sina plots of adenocarcinoma and squamous signature scores for all tumor cells by model. Wilcoxon rank-sum tests show the difference between scores for all cells within each model. Uniform manifold approximation and projection (UMAP) of all tumor cells (n = 6,808 cells) colored by adenocarcinoma or squamous classification; cells were classified as adenocarcinoma when their score was higher for adenocarcinoma than squamous. UMAP is split by model (SNL = 3,418 cells, SNL-Trp53 = 768 cells, SNL-Pten = 1,828 cells, LN2A = 794 cells).
Figure 4
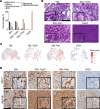
Figure 4. Pten loss alters LUAD mucin composition and affects lipid pathways in the TME.
(A) Percentage of mucinous, nonmucinous, or mixed histology of tumors from all models as scored by a veterinary pathologist using FFPE H&E-stained slides from lung tumors (SNL models) and LN tumors (LN2A); χ2 (4, N = 187) = 22.12; P < 0.001. Atypical adenomatous hyperplasias, adenomas, and adenocarcinomas were combined for the purposes of this work (SNL n = 6 mice, SNL-Trp53 n = 13 mice, SNL-Pten n = 8 mice, and LN2A n = 12 mice). SCC, squamous cell carcinoma. (B) Representative H&E images showing mucinous and nonmucinous histologies found in the LN2A and SNL models. (C) UMAPs of tumor cells showing gene signature score driving mucinous adenocarcinoma. (D) IHC-DAB of lung tumors from SNL, SNL-Trp53, SNL-Pten, and LN2A mice for MUC1 and MUC5B staining (scale bar = 200 μm).
Figure 5
Figure 5. Increased recruitment of inflammatory myeloid subsets in squamous tumors.
(A) Tumor and stromal cell composition as defined by scRNA-Seq clustering in all models. (B) QIAGEN’s Ingenuity Pathway Analysis (IPA) was performed on differentially expressed genes (DEGs) identified between squamous-aligned (SNL-Sq) and adenocarcinoma-aligned (SNL-Ad) tumor cells from SNL mice. Pathways shown are enriched in squamous-aligned tumor cells. Blue: immune cell recruitment pathway. (C) Percentage of Mono1 and Mac1 in models. Box plots show the interquartile range, median (line), and minimum and maximum (whiskers). (D) IHC staining for CCR2 in SNL and LN2A tumors (scale bar = 200 μm). (E) UMAP plots showing subclustering of Mono1 subpopulation (n = 1,235 cells) by cluster and by experimental group. (F) Heatmap showing DEGs by clusters, shown in E. (G) DEGs of Mono1 in LN2A versus all SNL models. Aqua blue: most highly differentially expressed. Red: complement related. (H) IPA of DEGs to get enriched canonical pathways of LN2A Mono1 versus Mono1 from all SNL models. Red: complement related. (I) Hazard ratios (HR median) for survival relevance of complement factors. (J) A total of 100,000 LN2A cells were injected orthotopically into the left lungs of either wild-type or Cfb–/– mice (n = 10/group) (log-rank P < 0.0001).

References

    1. American Cancer Society. Global Cancer Facts & Figures 5th Edition. https://www.cancer.org/content/dam/cancer-org/research/cancer-facts-and-... Updated 2024. Accessed May 23, 2025.
    1. Siegel RL, et al. Cancer statistics, 2022. CA Cancer J Clin. 2022;72(1):7–33. doi: 10.3322/caac.21708. - DOI - PubMed
    1. Chen Z, et al. Non-small-cell lung cancers: a heterogeneous set of diseases. Nat Rev Cancer. 2014;14(8):535–546. doi: 10.1038/nrc3775. - DOI - PMC - PubMed
    1. Hynds RE. et al. Progress towards non-small-cell lung cancer models that represent clinical evolutionary trajectories. Open Biol. 2021;11(1):200247. doi: 10.1098/rsob.200247. - DOI - PMC - PubMed
    1. Ferone G, et al. Cells of origin of lung cancers: lessons from mouse studies. Genes Dev. 2020;34(15–16):1017–1032. doi: 10.1101/gad.338228.120. - DOI - PMC - PubMed

MeSH terms