. 2025 May 14;5(5):100873.
doi: 10.1016/j.xgen.2025.100873. Epub 2025 May 5.

Trans-eQTL hotspots shape complex traits by modulating cellular states

Affiliations

Trans-eQTL hotspots shape complex traits by modulating cellular states

Kaushik Renganaath et al. Cell Genom. .

Abstract

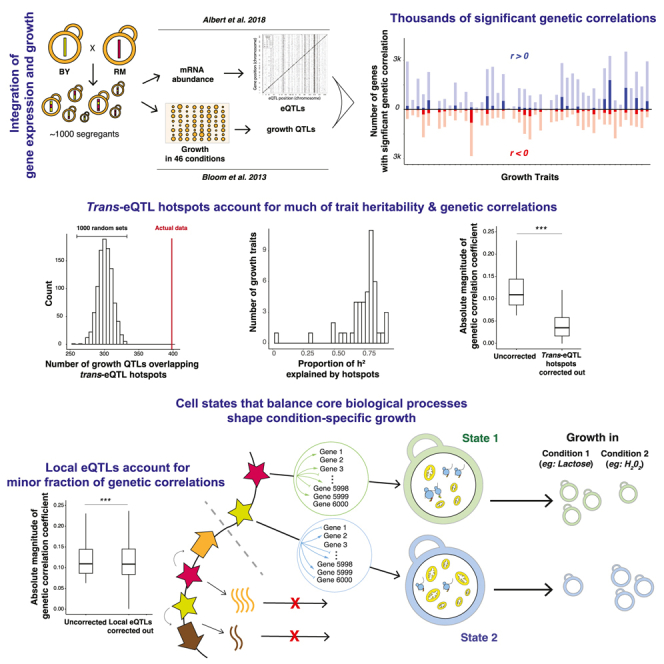
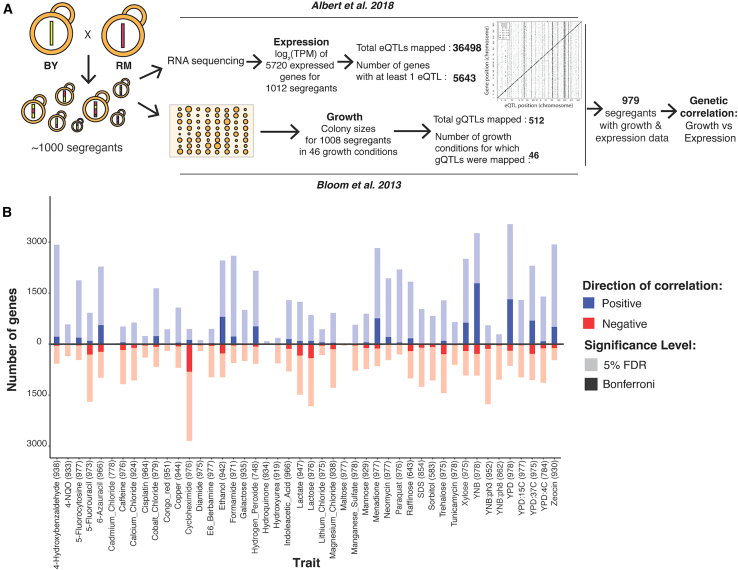
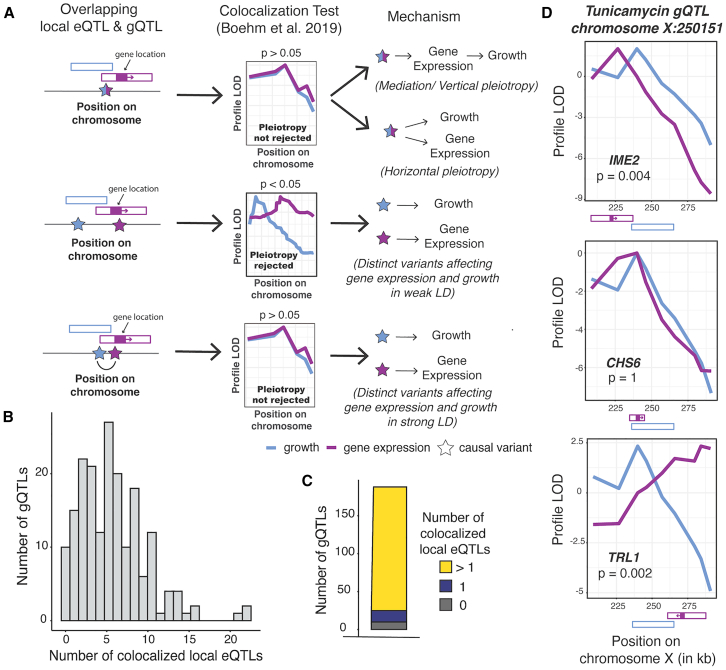
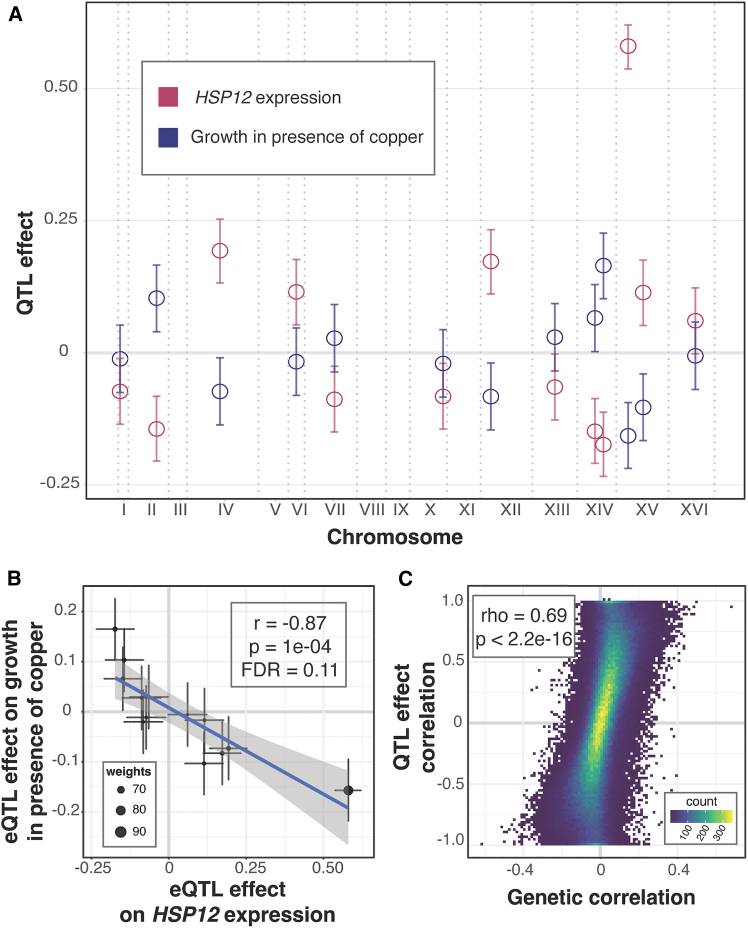
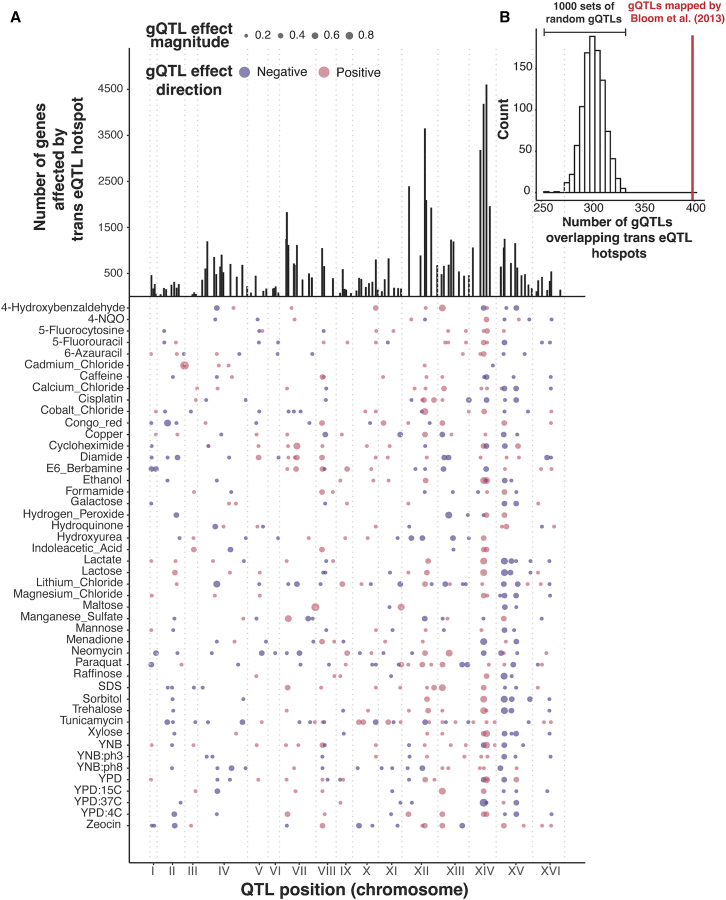
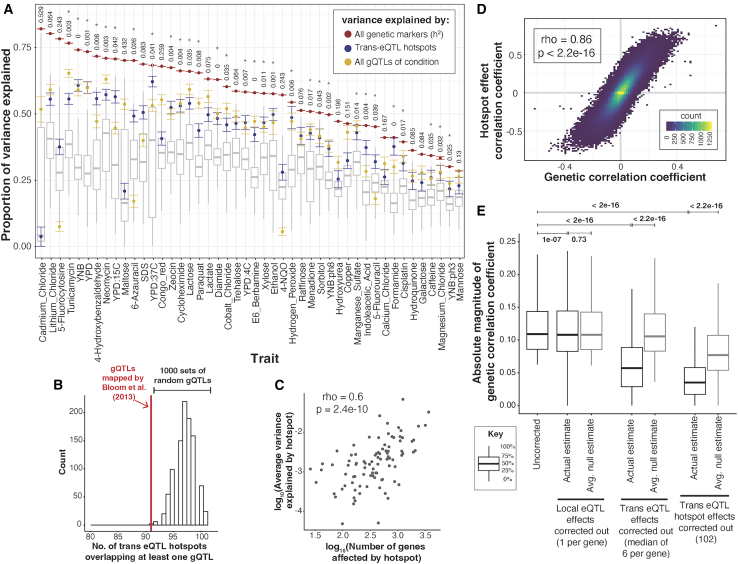
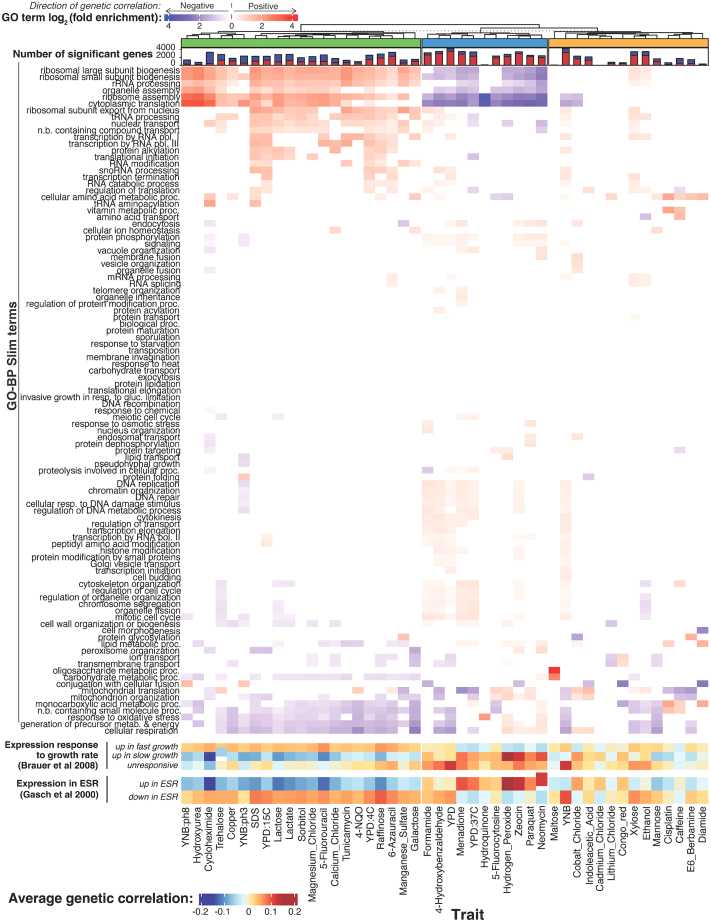
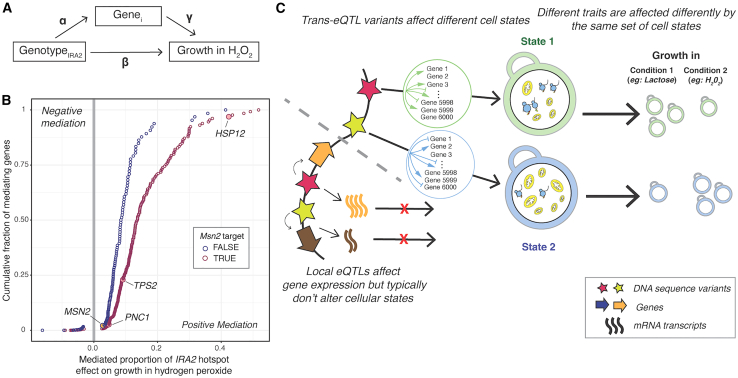
Regulatory genetic variation shapes gene expression, providing an important mechanism connecting DNA variation and complex traits. The causal relationships between gene expression and complex traits remain poorly understood. Here, we integrated transcriptomes and 46 genetically complex growth traits in a large cross between two strains of the yeast Saccharomyces cerevisiae. We discovered thousands of genetic correlations between gene expression and growth, suggesting potential functional connections. Local regulatory variation was a minor source of these genetic correlations. Instead, genetic correlations tended to arise from multiple independent trans-acting regulatory loci. Trans-acting hotspots that affect the expression of numerous genes accounted for particularly large fractions of genetic growth variation and of genetic correlations between gene expression and growth. Genes with genetic correlations were enriched for similar biological processes across traits but with heterogeneous direction of effect. Our results reveal how trans-acting regulatory hotspots shape complex traits by altering cellular states.

Keywords: QTLs; complex traits; expression QTLs; gene expression; genetic variation; heritability; mediation; pleiotropy; quantitative genetics; yeast.


Conflict of interest statement

Declaration of interests The authors declare no competing interests.

Figures

None
Graphical abstract
Figure 1
Figure 1
Genetic correlations (A) The datasets used to compute genetic correlations. (B) Number of genes with significant genetic correlation in each of the 46 growth conditions at 5% FDR (pale colors) and Bonferroni significance (saturated colors); both multiple-testing corrections performed within-trait. Positive correlations are in blue and above the zero line; negative correlations are in red and below. For each condition, the number of segregants with both growth and expression measurements in Bloom et al. and Albert et al. used to compute the genetic correlations are indicated in parentheses. See also Figures S1–S6, Tables S1, S2, and S3.
Figure 2
Figure 2
Local eQTL analyses (A) Illustration of causal models at local eQTLs that overlap a gQTL. QTL locations are shown as hollow boxes; gene position and transcriptional direction is indicated as solid purple box and arrow. Under mediation or vertical pleiotropy,, causal DNA variants alter gene expression in the baseline condition, which then affects growth when segregants encounter the given environmental condition. Under horizontal pleiotropy, causal DNA variants also affect gene expression and growth but do so independently, through distinct pathways. Overlapping QTLs can also arise from distinct, linked causal variants in physical proximity that affect only gene expression or only growth. QTLs with shared, pleiotropic variants are called colocalized, to distinguish them from QTLs that overlap due to simple proximity between distinct causal variants. To distinguish between these scenarios, we performed colocalization tests. A significant p value on this test indicates that a single QTL caused by shared causal variants is rejected in favor of two separate QTLs with different causal variants. (B) Histogram of the number of gQTLs with a given number of colocalized local eQTLs. (C) The number of gQTLs with zero, one, and more than one colocalized local eQTL. (D) Profile LOD curves for growth in tunicamycin (blue) and the expression of indicated genes (purple) at a gQTL on chromosome X. Profile LOD scores are computed under the two-QTLs model as a LOD trace for one trait while keeping the QTL for the second trait fixed at its maximum-likelihood position, followed by subtracting the maximum LOD score of the single-QTL model in this region. A maximum profile LOD value of zero (as for CHS6) indicates that the two-QTLs model fits no better than the single-QTL model. Positive maximum profile LOD values (as for TRL1 and IME2) indicate that the two-QTLs model fits better than the single-QTL model, with the two profile LOD curves peaking at the best positions for the two QTLs. QTL and gene positions as shown in (A). See also Figure S7 and Tables S3 and S4.
Figure 3
Figure 3
QTL effect correlations (A) As an example, the plot shows the locations of eQTLs affecting the gene HSP12 (x axis) and their effects (y axis; coefficient of correlation between trait and genotype) on HSP12 expression (red) and growth in the presence of copper (blue). Shown here are 95% effect size confidence intervals. HSP12 and copper were chosen as examples due to the large number of eQTLs and strong effect size correlation. (B) Scatterplot of the effects from (A). The line represents the weighted regression. Weights are calculated as the inverse product of the widths of the 95% effect size confidence intervals and are reflected in the size of the point. (C) Scatterplot between QTL effect correlation coefficients and genetic correlation coefficients across all genes and all growth conditions. See also Tables S2, S3, and S5.
Figure 4
Figure 4
Trans-eQTL hotspot and gQTL locations (A) Top: number of genes affected by the 102 trans-eQTL hotspots (vertical lines). Bottom: locations of the 591 gQTLs as points, with size scaled by effect size (coefficient of correlation between trait and genotype at the gQTL). Positive (RM allele increases growth compared to BY allele) and negative (RM allele decreases growth) gQTL effects are red and blue, respectively. (B) Histogram showing the distribution of the number of gQTLs that overlap a trans-eQTL hotspot in 1,000 sets of randomly placed gQTLs, compared to the actual gQTLs (red line).
Figure 5
Figure 5
Phenotypic variance and genetic correlations linked to trans-eQTL hotspots (A) Proportion of phenotypic variance explained by all 11,530 genetic markers (narrow-sense heritability; red dots), the 102 trans-eQTL hotspots (blue dots), and all gQTLs (yellow dots) in 46 growth conditions. Error bars about each estimate (depicted in the same color as the estimates) represent standard errors computed via 5,000 bootstraps. Boxplots show the distribution of variance explained by 1,000 sets of 102 random genetic markers. These distributions were used to calculate p values (shown at top) for the proportion of variance explained by the hotspots. ∗p < 0.05. (B) Histogram showing the number of trans-eQTL hotspots that overlap at least one gQTL in 1,000 sets of randomly placed gQTLs, compared to the actual data (red line). (C) Scatterplot comparing the average growth variance explained by each hotspot and the number of genes whose expression they influence. The top two hotspots influencing the expression of the most number of genes (chromosome [chr]XIV: 466588_T/G and chrXIV: 372376_G/A) are excluded from the analysis as it is not possible to estimate the average proportion of variance explained by just two markers under the linear mixed-model scheme we use to estimate the proportion of variance explained by hotspots. (D) Scatterplot between hotspot effect correlation coefficients and genetic correlation coefficients across all genes and growth conditions. (E) Boxplots showing distributions of magnitudes of genetic correlation coefficients before (“uncorrected”) and after removing the effects of local eQTLs (“1 per gene”), trans-eQTLs (range 1–21 per gene, median of 6), and the 102 trans-eQTL hotspots (the number of markers regressed out for each category are indicated along the x axis). This analysis included only genes with at least one local eQTL and one trans-eQTL and only uncorrected genetic correlations that were significant at 5% FDR. For each category, a random expectation was computed by calculating the decrease in the magnitude of genetic correlations after regressing out the effects of 1,000 sets of random markers of size equal to the actual set. Wilcoxon p values for the difference in medians are indicated above the boxplots. See also Figures S8–S14 and Tables S2, S3, S5, and S6.
Figure 6
Figure 6
Biological processes enriched in genetic correlations The top heatmap shows log2-fold enrichments for 100 GO-Biological Process slim terms in the set of genes with significant (5% FDR) genetic correlations. Enrichments for genes with positive and negative genetic correlations are shown in red and blue, respectively. Enrichments are displayed for terms significant at uncorrected p < 0.001. The stacked bar plot above the heatmap shows the number of genes with significant genetic correlation (5% FDR) for each condition, with positive genetic correlation in red and negative correlations in blue. The dendrogram clusters traits based on GO enrichment, with the three trait groups discussed in the text indicated. The heatmaps at the bottom show average genetic correlation coefficients for genes in the indicated gene groups from Brauer et al. and Gasch et al. See also Table S7.
Figure 7
Figure 7
Mediation of growth variation at a trans-eQTL hotspot (A) Conceptual model showing how the effect of the IRA2 hotspot on growth in hydrogen peroxide may be mediated by the expression of hotspot target genes (Genei). The coefficients used in the mediation analysis (STAR Methods) are indicated. (B) Mediated proportion of the IRA2 hotspot effect on growth in hydrogen peroxide for 380 genes with significant mediation (5% FDR). Circles are colored according to their annotation as an Msn2 target in the Yeastract database. Cumulative fraction of mediating genes is computed for Msn2 targets and non-targets separately. Genes described in the text are highlighted. Positive mediation indicates genes for which increased expression increases growth, while negative mediation indicates genes for which increased expression decreases growth. (C) Conceptual model of how trans-eQTL hotspots affect growth by altering cellular states, as reflected in the hotspot’s effect on multiple genes. The two example states roughly correspond to the green and blue trait clusters in Figure 6, with high translation and low respiration versus low translation and high respiration. Growth in different conditions is affected differently by these states. Most local eQTLs (shown below the dashed gray line) affect gene expression but do not go on to affect key cellular states underlying growth variation. See also Tables S8 and S9.

Update of

Similar articles

Cited by

References

    1. Maurano M.T., Humbert R., Rynes E., Thurman R.E., Haugen E., Wang H., Reynolds A.P., Sandstrom R., Qu H., Brody J., et al. Systematic Localization of Common Disease-Associated Variation in Regulatory DNA. Science. 2012;337:1190–1195. doi: 10.1126/science.1222794. - DOI - PMC - PubMed
    1. Albert F.W., Kruglyak L. The role of regulatory variation in complex traits and disease. Nat. Rev. Genet. 2015;16:197–212. doi: 10.1038/nrg3891. - DOI - PubMed
    1. Aguirre-Gamboa R., de Klein N., di Tommaso J., Claringbould A., van der Wijst M.G., de Vries D., Brugge H., Oelen R., Võsa U., Zorro M.M., et al. Deconvolution of bulk blood eQTL effects into immune cell subpopulations. BMC Bioinf. 2020;21:243. doi: 10.1186/s12859-020-03576-5. - DOI - PMC - PubMed
    1. Brown A.A., Viñuela A., Delaneau O., Spector T.D., Small K.S., Dermitzakis E.T. Predicting causal variants affecting expression by using whole-genome sequencing and RNA-seq from multiple human tissues. Nat. Genet. 2017;49:1747–1751. doi: 10.1038/ng.3979. - DOI - PubMed
    1. Cusanovich D.A., Billstrand C., Zhou X., Chavarria C., De Leon S., Michelini K., Pai A.A., Ober C., Gilad Y. The combination of a genome-wide association study of lymphocyte count and analysis of gene expression data reveals novel asthma candidate genes. Hum. Mol. Genet. 2012;21:2111–2123. doi: 10.1093/hmg/dds021. - DOI - PMC - PubMed

MeSH terms

Substances

LinkOut - more resources