. 2025 Jul;643(8073):1135-1142.
doi: 10.1038/s41586-025-09073-0. Epub 2025 May 6.

Naturally ornate RNA-only complexes revealed by cryo-EM

Affiliations

Naturally ornate RNA-only complexes revealed by cryo-EM

Rachael C Kretsch et al. Nature. 2025 Jul.

Abstract

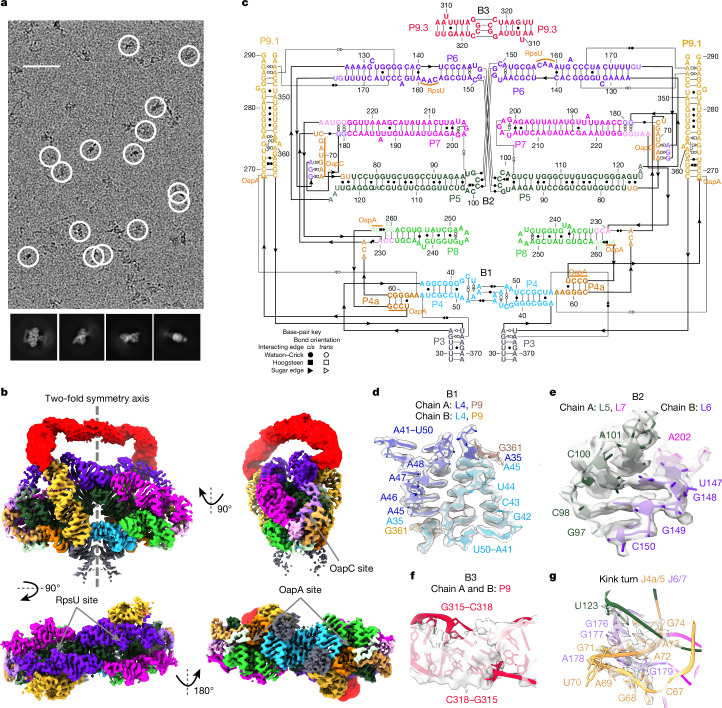
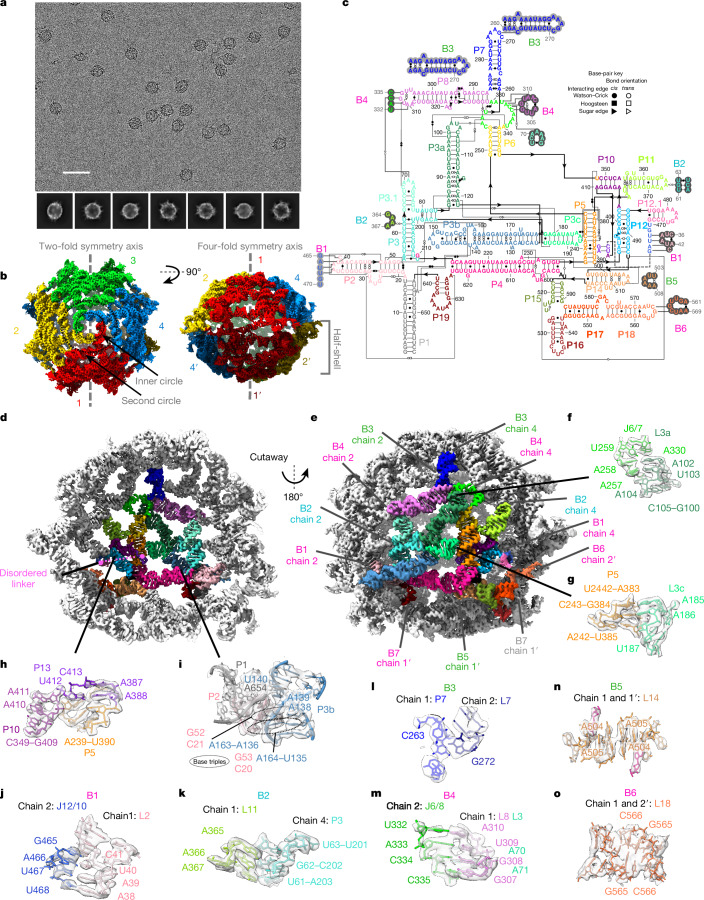
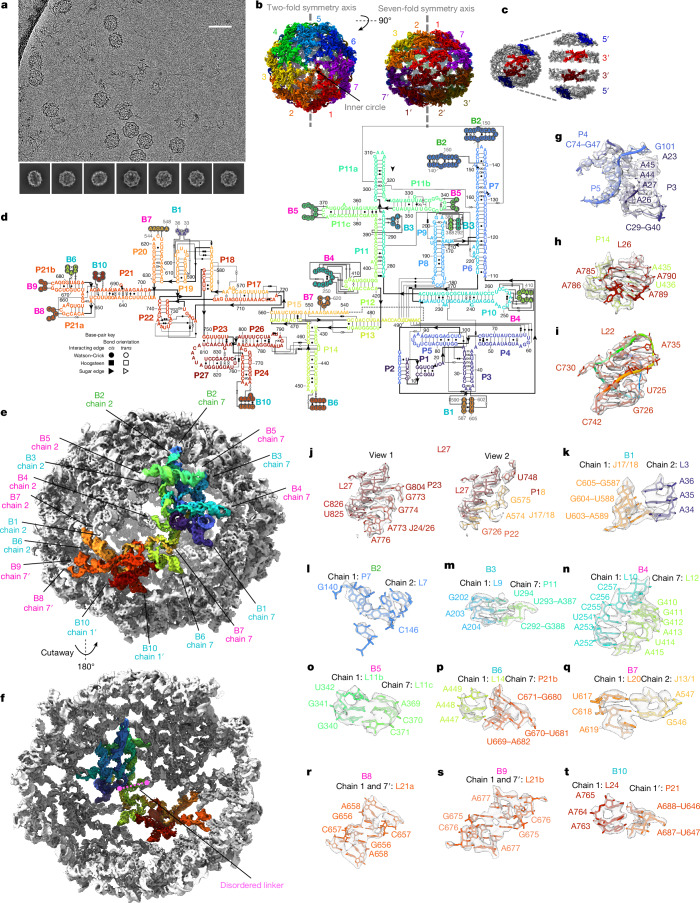
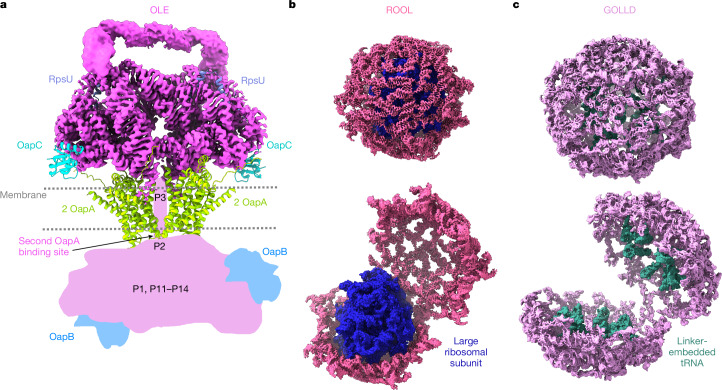
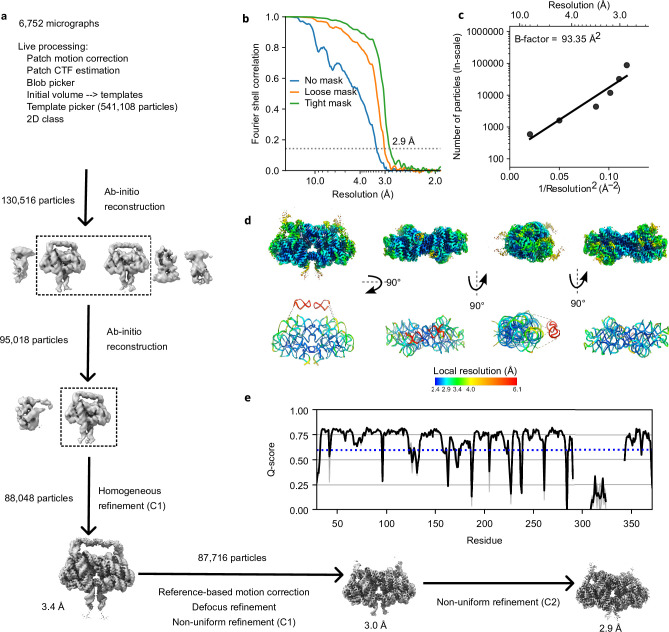
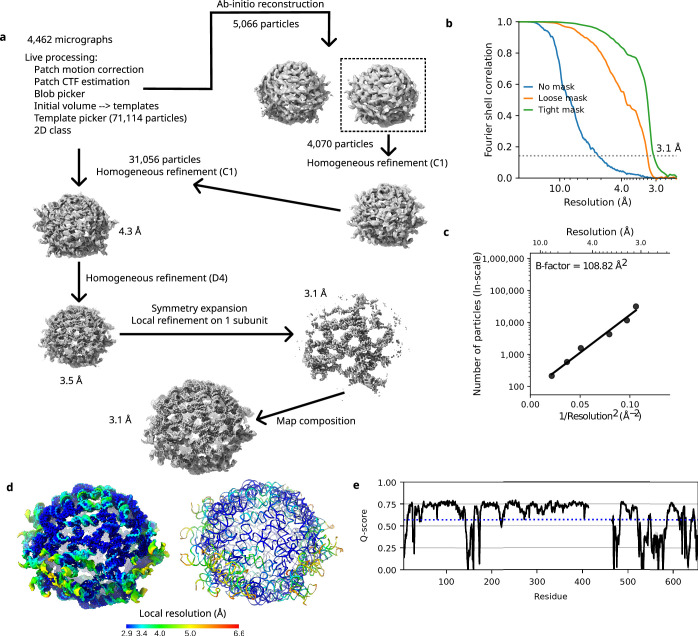
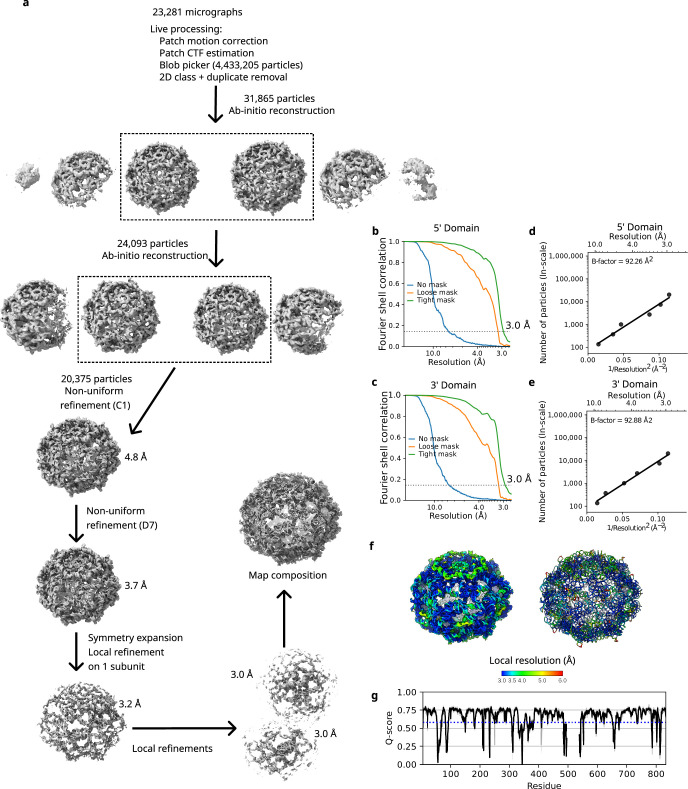
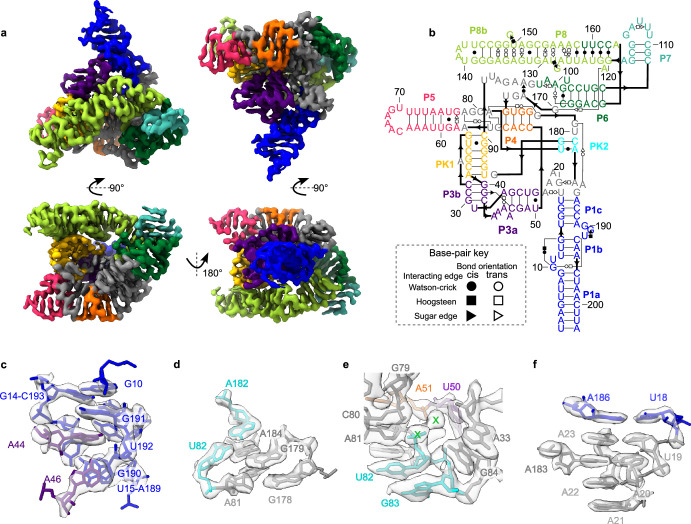
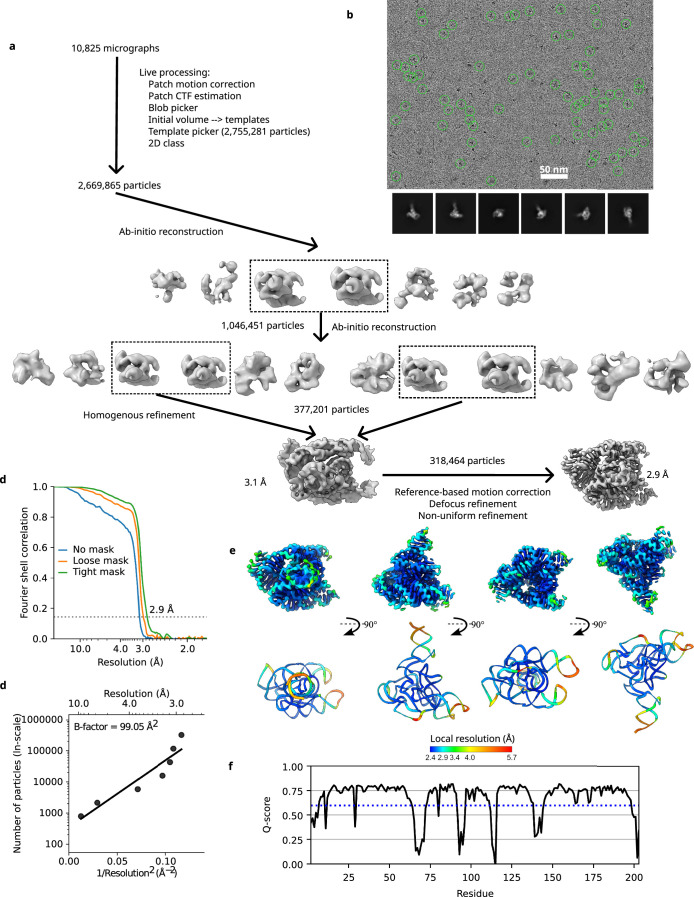
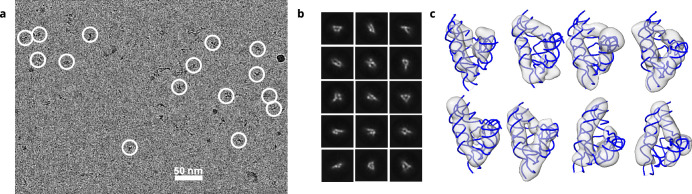
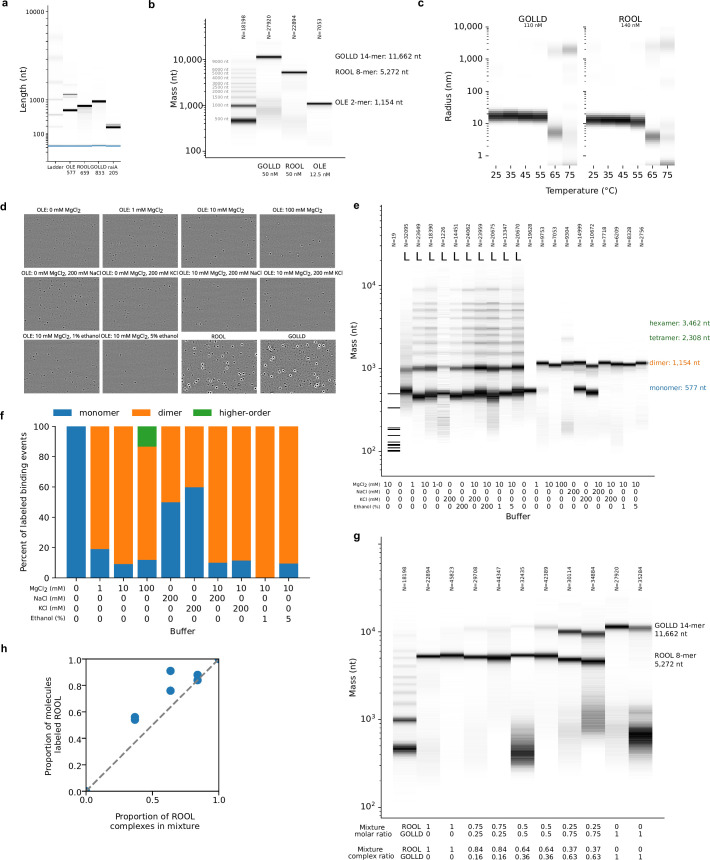
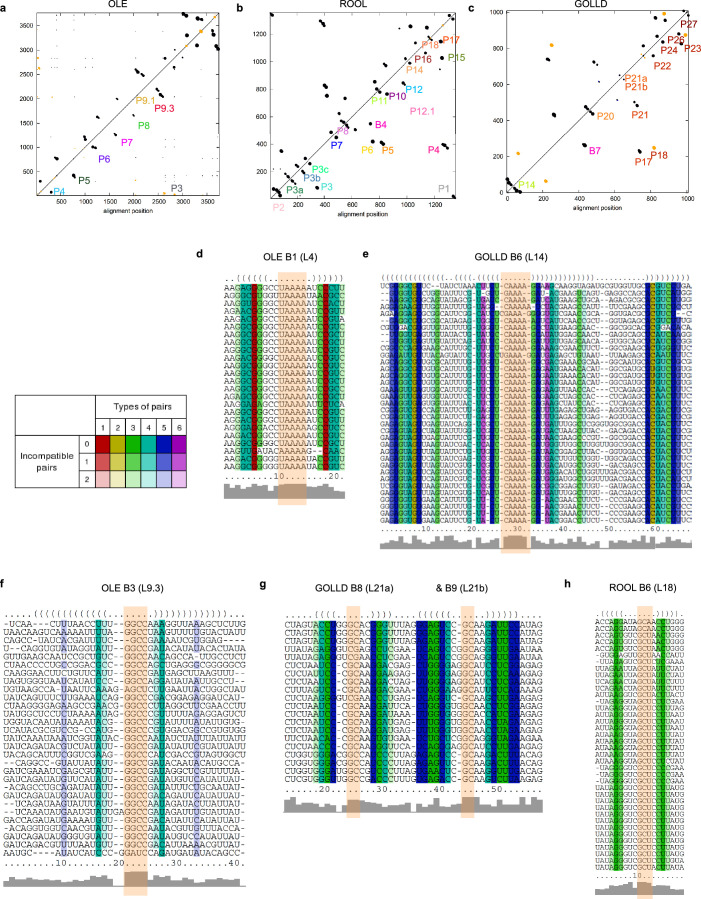
The structures of natural RNAs remain poorly characterized and may hold numerous surprises1-4. Here we report three-dimensional structures of three large ornate bacterial RNAs using cryo-electron microscopy (cryo-EM). GOLLD (Giant, Ornate, Lake- and Lactobacillales-Derived), ROOL (Rumen-Originating, Ornate, Large) and OLE (Ornate Large Extremophilic) RNAs form homo-oligomeric complexes whose stoichiometries are retained at lower concentrations than measured in cells. OLE RNA forms a dimeric complex with long co-axial pipes spanning two monomers. Both GOLLD and ROOL form distinct RNA-only multimeric nanocages with diameters larger than the ribosome, each empty except for a disordered loop. Extensive intramolecular and intermolecular A-minor interactions, kissing loops, an unusual A-A helix and other interactions stabilize the three complexes. Sequence covariation analysis of these large RNAs reveals evolutionary conservation of intermolecular interactions, supporting the biological importance of large, ornate RNA quaternary structures that can assemble without any involvement of proteins.


Conflict of interest statement

Competing interests: The authors declare no competing interests.

Figures

Fig. 1
Fig. 1. Structure of OLE homodimer.
a, Top, representative micrograph (6,752 micrographs total). Particles selected for reconstruction are circled in white. Bottom, 2D class averages. Scale bar, 50 nm. b, The cryo-EM reconstruction of the OLE dimer. The top left image depicts the separation of the two chains: one chain on the right and the other on the left. Each domain of both chains is coloured. To aid visualization, the flexible P9.3 domain (red) is displayed with the unsharpened map at 10σ contour. The proposed binding sites of previously described proteins (RpsU, OapC and OapA) are labelled. c, Secondary structure of OLE dimer. The domains are coloured as in b. df, The intermolecular bridge interactions B1 (d), B2 (e) and B3 (f), coloured by domain. In d, the domain colouring is darker for chain A to differentiate the chains. g, The kink-turn motif that may bind the OapC protein, identical for each monomer. The sharpened cryo-EM map is displayed at the following contours: 7σ (b), 15σ (d), 12σ (f) and 10σ (g).
Fig. 2
Fig. 2. Atomically ordered structure of ROOL homo-octamer.
a, Representative micrograph (top; 4,462 micrographs total) with 2D class averages (bottom). Scale bar, 50 nm. b, The 3.1 Å cryo-EM reconstruction of the ROOL complex with D4 symmetry. The map is coloured by 8 labelled chains. In the top view (left), the inner and second circle are labelled. c, Secondary structure of ROOL coloured by domain. Only one chain is shown, in full. Nucleotides involved in intermolecular interactions have been circled in light or dark grey. d,e, Chain 1 is coloured by domain with all other chains in grey. d, Cutaway view, showing chain 1 from the interior of the nanocage with the disordered linker labelled in pink (nucleotides 414–464). e, Intermolecular interactions or bridges of chain 1 are labelled, with kissing loops labelled in magenta, A-minor interactions in cyan and other interactions in lime. One interaction, B7 (grey), is not ordered in this cryo-EM map, but residues come in sufficiently close contact that interactions could form. The same interactions, but between different pairs of chains, share the same number. fi, Selected intramolecular interactions as labelled in d,e. jo, Intermolecular interactions as labelled in e. The sharpened cryo-EM map is displayed at the following contours: 6σ (b,d,e), 8σ (o), 16σ (g,in) and 20σ (f,h).
Fig. 3
Fig. 3. Atomically ordered structure of GOLLD homo-14-mer.
a, Representative micrograph (23,281 micrographs total) and 2D class averages. Scale bar, 50 nm. b, The 3.0 Å cryo-EM reconstruction of GOLLD with D7 symmetry, coloured by chain. In the top view (left), the inner circle is labelled. c, The 5′ (blue, residues 1–420) and 3′ (red, residues 421–833) regions of GOLLD organize into the cap and a ring of the half-shell of the nanocage, respectively. To demonstrate the separation of domains, the four regions are artificially moved apart. d, The secondary structure of GOLLD. Only one chain is displayed in full, nucleotides participating in intermolecular interactions that are from other chains are circled in light or dark grey. e, One chain of GOLLD is depicted in rainbow, intermolecular interactions or bridges are labelled, with kissing loops labelled in magenta, A-minor interactions in cyan and other interactions in lime. The same interaction, but between different pairs of chains, share the same number. Each chain interacts with four other chains. f, Same as e, but rotated and is cut away to show the rainbow-labelled chain from the interior of the nanocage with the disordered linker labelled in pink (nucleotides 497–538). gj, Select intramolecular interactions. kt, Intermolecular interactions as labelled in e. The sharpened cryo-EM map is displayed at the following contours: 12σ (e,f,i), 14σ (c,o), 16σ (b,n), 18σ (s,q), 20σ (km,p), 22σ (t), 25σ (h,i) and 30σ (g,j).
Fig. 4
Fig. 4. Structure-guided hypotheses for homo-oligomeric RNAs.
a, OLE dimer displayed with AlphaFold 3 models of OapC, OapA dimer and RpsU proteins at their proposed binding sites. b,c, The two half-shells of the RNA nanocages are held together by only a few interactions and hence could open up to encapsulate other biomolecules, such as protein, metabolites, nucleic acids or RNA–protein complexes. b, The RNA nanocage formed by ROOL is shown encapsulating a ribosomal large subunit. c, The RNA nanocage formed by GOLLD is shown exposing the covalently linked tRNAs when open. The sharpened cryo-EM maps are displayed at the following contours 7σ (a), 6σ (b) and 12σ (c).
Extended Data Fig. 1
Extended Data Fig. 1. Cryo-EM data processing workflow for OLE dimer.
(a-e) OLE resolves into a high resolution dimer, even in the absence of protein. (a) Data processing flowchart for the OLE dimer. (b) Fourier shell correlation (FSC) plot for final refinement of OLE dimer. (c) Plot of particle number against the reciprocal squared resolution for OLE dimer. The B-factor was calculated as twice the linearly fitted slope. (d) Local resolution of the OLE dimer on the cryo-EM map (top) and the molecular model (bottom). (e) Resolvability of the built model of the OLE dimer as measured by Q-score. The black line is the mean across all chains, with the maximum and minimum values depicted in light grey (N = 2 chains). The expected Q-score at this resolution is labeled with a blue dotted line.
Extended Data Fig. 2
Extended Data Fig. 2. Cryo-EM data processing workflow for ROOL nanocage complex.
(a) Data processing flowchart. (b) Fourier shell correlation (FSC) plots of the single subunit local refinement. (c) Plot of particle number against the reciprocal squared resolution for the single subunit local refinement. The B-factor was calculated as twice the linearly fitted slope. (d) Local resolution on the cryo-EM map (right) and the molecular model (left). (e) Resolvability of the built model as measured by Q-score. The black line is the mean across all chains, with the maximum and minimum values depicted in light grey (N = 8 chains). The expected Q-score at this resolution is labeled with a blue dotted line.
Extended Data Fig. 3
Extended Data Fig. 3. Cryo-EM data processing workflow for GOLLD nanocage complex.
(a) Data processing flowchart. (b-c) Fourier shell correlation (FSC) plots for the local refinement of the 5′ and 3′ domains respectively. (d-e) Plots of particle number against the reciprocal squared resolution for the local refinement of the 5′ and 3′ domains respectively. The B-factor was calculated as twice the linearly fitted slope. (f) Local resolution on the cryo-EM map (left) and the molecular model (right). (g) Resolvability of the built model as measured by Q-score. The black line is the mean across all chains, with the maximum and minimum values depicted in light grey (N = 14 chains). The expected Q-score at this resolution is labeled with a blue dotted line.
Extended Data Fig. 4
Extended Data Fig. 4. Tertiary structure of raiA RNA motif.
(a) Global view of tertiary structure of raiA motif and 2.9 Å cryo-EM map coloured by as labeled in the secondary structure, (b). (c-f) Select tertiary interactions. Description can be found in Supplemental Text 1. The sharpened cryo-EM map is displayed at the following contours (a): 8 σ, (c,e,f): 16 σ, (d): 20 σ.
Extended Data Fig. 5
Extended Data Fig. 5. Cryo-EM data processing workflow for raiA motif.
(a) Data processing flowchart. (b) Representative micrograph (10,825 micrographs total) and 2D class averages. (c) Fourier shell correlation (FSC) plot. (d) Plot of particle number against the reciprocal squared resolution. The B-factor was calculated as twice the linearly fitted slope. (e) Local resolution on the cryo-EM map (top) and the molecular model (bottom). (f) Resolvability of the built model as measured by Q-score. The expected Q-score of a RNA model at this resolution is labeled with a blue dotted line.
Extended Data Fig. 6
Extended Data Fig. 6. Cryo-EM data of HEARO RNA without protein shows disorder.
HEARO did not resolve into a high resolution structure, despite similar amount and quality of data as OLE-dimer. (a) The representative micrograph (8,294 micrographs total) of HEARO shows clear particles. (b) Select 2D class averages show that HEARO is forming RNA helices, but they have diverse orientations and are blurred, suggesting high flexibility. (c) 3D reconstructions of HEARO, overlaid with the known structure of this RNA in the OMEGA nickase complex bound to protein IsrB (PDB: 8DMB), show RNA of a similar fold to the complexed RNA. Multiple conformations are reconstructed, but with poorly resolved features, suggesting that HEARO may not form an atomically ordered structure when not in complex with its partner proteins.
Extended Data Fig. 7
Extended Data Fig. 7. Evidence of multimer formation of GOLLD, ROOL, and OLE in biologically relevant concentrations.
(a) Agilent Bioanalyzer traces demonstrate the purity of the samples. The second peak for OLE is a common artifact of poor denaturation of sample in Bioanalyzer traces. The pure monomeric reading in mass photometry, (b), shows that this peak is likely not a covalently linked dimer. (b) Mass of GOLLD, ROOL, and OLE complexes as obtained from mass photometry at 50 nM, 50 nM, and 12.5 nM respectively. The data is a histogram of particle count density, normalized per sample, where dark is many counts, white is none. Total particle counts are shown above the graph. (c) Hydrodynamic radius of GOLLD and ROOL complexes as derived from dynamic light scattering at 110 nM and 140 nM respectively. The data are plotted as relative population density, normalized by density per sample, with dark representing highly populated radius values. The temperature of the sample was raised from 25 °C to 75 °C and dynamic light scattering traces were obtained every 10 °C, showing complex melting into monomers at 65 °C and aggregation at high temperatures. (d) Representative ratiometric image for all mass photometry data (1 frame from a 60 s collection at 331 Hz). (e) Mass photometry data of OLE in different buffer conditions demonstrates OLE can dimerize at low RNA concentration, low magnesium concentration, and in the absence of magnesium with sufficient monovalent cations. (f) The mass photometric data is summarized by counting the amount of hits in the monomer, dimer, and high stoichiometry peaks. The absolute ratio of monomer:dimer is accurate as assessed in (g-h). (g) Mass photometry traces of mixtures of ROOL and GOLLD, ratiometric image examples can be found in. (h) Summary of the mixture results, with the known complex ratio plotted against the ratio reported by mass photometry. There is agreement, but with slight bias towards higher counts for the smaller species, ROOL, opposite of the previously observed trend.
Extended Data Fig. 8
Extended Data Fig. 8. Comparative and covariation sequence analysis of homo-oligomer forming RNAs.
(a-c) Distributions of covariation scores in multiple sequence alignments of (a) OLE, (b), ROOL, and (c) GOLLD sequences with select stems labeled. Dot size is proportional to the covariation score. In blue the consensus base pairs are depicted; in green, the consensus base pairs that show significant covariation are shown; in orange, other pairs that have significant covariation were depicted, they are not part of the consensus secondary structure but are compatible with it; in black, other significant pairs are depicted. Positions are relative to the original input alignment (before any gapped column is removed). (d-h) Examples of multiple alignments and profiles of sequence identity of selected stable hairpins with highly conserved loops which are involved in the intermolecular interactions are shown. Nucleotides involved in intermolecular interactions are labeled as in main Figs. 1, 2 and 3 for the RNAs OLE (B1, B3), ROOL (B6), and GOLLD (B6, B8) respectively, and highlighted with an orange box. A coloring scheme for highlighting the mutational pattern with respect to the secondary structure (folding) was used and can be found next to (d). If one predicted base-pair is formed by several different combinations of nucleotides, consistent or compensatory mutations have taken place. This is indicated by different colors. Pale colors indicate that a base pair cannot be formed in some sequences of the alignment. The sequence variants for the examples were selected from the closest branches of the evolutionary trees built based on the multiple sequence alignments used for the covariation analysis.

Similar articles

Cited by

References

    1. Weinberg, Z. et al. Detection of 224 candidate structured RNAs by comparative analysis of specific subsets of intergenic regions. Nucleic Acids Res.45, 10811–10823 (2017). - PMC - PubMed
    1. Puerta-Fernandez, E., Barrick, J. E., Roth, A. & Breaker, R. R. Identification of a large noncoding RNA in extremophilic eubacteria. Proc. Natl Acad. Sci. USA103, 19490–19495 (2006). - PMC - PubMed
    1. Weinberg, Z., Perreault, J., Meyer, M. M. & Breaker, R. R. Exceptional structured noncoding RNAs revealed by bacterial metagenome analysis. Nature462, 656–659 (2009). - PMC - PubMed
    1. Narunsky, A. et al. The discovery of novel noncoding RNAs in 50 bacterial genomes. Nucleic Acids Res.52, 5152–5165 (2024). - PMC - PubMed
    1. ENCODE Project Consortium. An integrated encyclopedia of DNA elements in the human genome. Nature489, 57–74 (2012). - PMC - PubMed

MeSH terms

LinkOut - more resources