. 2025 May 6;16(1):4203.
doi: 10.1038/s41467-025-59229-9.

HiBC: a publicly available collection of bacterial strains isolated from the human gut

Affiliations

HiBC: a publicly available collection of bacterial strains isolated from the human gut

Thomas C A Hitch et al. Nat Commun. .

Abstract

Numerous bacteria in the human gut microbiome remain unknown and/or have yet to be cultured. While collections of human gut bacteria have been published, few strains are accessible to the scientific community. We have therefore created a publicly available collection of bacterial strains isolated from the human gut. The Human intestinal Bacteria Collection (HiBC) ( https://www.hibc.rwth-aachen.de ) contains 340 strains representing 198 species within 29 families and 7 phyla, of which 29 previously unknown species are taxonomically described and named. These included two butyrate-producing species of Faecalibacterium and new dominant species associated with health and inflammatory bowel disease, Ruminococcoides intestinale and Blautia intestinihominis, respectively. Plasmids were prolific within the HiBC isolates, with almost half (46%) of strains containing plasmids, with a maximum of six within a strain. This included a broadly occurring plasmid (pBAC) that exists in three diverse forms across Bacteroidales species. Megaplasmids were identified within two strains, the pMMCAT megaplasmid is globally present within multiple Bacteroidales species. This collection of easily searchable and publicly available gut bacterial isolates will facilitate functional studies of the gut microbiome.


Conflict of interest statement

Competing interests: The authors declare no competing interests.

Figures
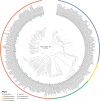
Fig. 1
Fig. 1. Phylogenetic diversity of isolates within HiBC.
Tree based on all 340 genomes, generated using Phylophlan. Phyla are indicated with colours. The Bacillota are split due to the placement of Fusobacteriota, which separated strains assigned to ‘Bacillota_A’ by GTDB, however, this is dependent on the method used for tree creation (Supplementary Results). The potential need for splitting the phylum Bacillota is therefore independently supported by the Phylophlan tree and GTDB. Blue circles identify strains belonging to the 29 novel species that are taxonomically described in this paper.
Fig. 2
Fig. 2. Ecology of isolated human gut bacteria and their proteins.
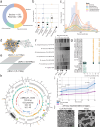
a The number of strains and genomes produced by eight major isolation projects, along with HiBC, were compared. Strains were deemed requestable if it was claimed in the original publication, although these claims were not substantiated. They were deemed deposited if culture collection identifiers were included in the original paper and were confirmed to exist. Genomes were deemed high quality if they were >90% complete and <5% contaminated. The number of strains within each study is stated, while the percentage meeting each criterion is plotted. Red dots highlight datasets which have barriers to their accessibility, i.e., data available upon request or access limited to specific countries. Strain collections: GMbC, Global Microbiome Conservancy; BIO-ML, Broad Institute-OpenBiome Microbiome Library; CGMR, Chinese Gut Microbial Reference; CAMII, Culturomics by Automated Microbiome Imaging and Isolation; hGMB, Human Gut Microbial BioBank; HBC, Human Gastrointestinal Bacterial Collection; HiBC, Human Intestinal Bacteria Collection (this study); IHU, collection of the Institut Hospitalier Universitaire Méditerranée Infection,; HMP, Human Microbiome Project at ATCC. b Number of species per isolate collection, either via manual curation (HiBC) or dereplication of the available genomes (ANI values > 95% indicated identical species). c The cumulative relative abundance of gut metagenomes across 4624 individuals from Leviatan et al. covered by all isolated bacteria across studies including HiBC (Global isolates, dark blue), HiBC alone (green), or the subset represented by the 29 novel taxa described in this work (light blue), which had matches within 4583 of the samples. d Relative abundance of dominant (mean relative abundance >0.25%) novel taxa across 4,624 individuals, with the number of positive samples stated. Each strain represents a distinct novel species, described in detail in the protologues at the end of the “Methods” section. e, f Genomic location of proteins significantly differentially prevalent between Crohn’s disease (CD) samples and healthy controls (inner ring), or ulcerative colitis (UC) samples and healthy controls (outer ring). The delta-prevalence (prevalence in healthy donors – prevalence in corresponding patients) is shown in blue (more prevalent in healthy controls), red (UC), or mauve (CD). The species, strain, number of proteins predicted within the genome, and those significantly differentially between health conditions are shown within the circle. Only contigs >10 kp were plotted.  In panel c and d, boxplots include a line in the centre indicating the median, the boxes represent the interquartile range, and the whiskers represent the minimum and maximum values, not including outliers.
Fig. 3
Fig. 3. Plasmid repertoire of human gut bacterial isolates and their association with disease and phenotypes.
a Phylum level diversity of plasmid-positive isolates. b Number of plasmids reconstructed within each isolate. The boxplots include a central line indicating the median, boxes represent the interquartile range, and whiskers represent the minimum and maximum values, not including outliers. c Length of reconstructed plasmids in log-10 scale; a bar represents the number; a line represents the distribution. d Network analysis of pBAC plasmid sequence similarity to each other as determined by MobMess. e Sequence alignment of a representative from pBAC cluster 1, 2 and 3. Grey lines show regions of >99% similarity. f The plasmid repertoire purified from 7 strains predicted to contain either a single or multiple pBAC plasmids, as well as additional plasmids. The arrows indicate bands with a size matching the reconstructed pBAC plasmids. g Proteins encoded on pBAC plasmids from different strains with significantly different prevalence between Crohn’s disease (CD) patients and healthy controls. Each point represents a single differentially prevalent protein, coloured based on the pBAC cluster the protein was encoded on (e). The strains are: Bacteroides xylanisolvens (CLA-KB-H139, CLA-SR-H015); Bacteroides caccae (CLA-SR-H005, CLA-KB-H116); Phocaeicola vulgatus (CLA-JM-H27B, CLA-JM-H27,CLA-KB-H143, CLA-AP-H4,4716a, 4896a, HDF, 4889b, CLA-KB-H148); Phocaeicola massiliensis (CLA-AP-H7, CLA-AP-H24); Phocaeicola dorei (CLA-KB-H130, CLA-KB-H95, CLA-KB-H103,CLA-AA-H245); Phocaeicola coprocola (CLA-JM-H3); Bacteroides thetaiotaomicron (CLA-SR-H011); Bacteroides faecis (CLA-KB-H105); Bacteroides cellulosilyticus (CLA-SR-H013); Bacteroides zhangwenhongii (CLA-AA-H144). h Plasmid map of pMMCAT_H253. The innermost rings represent the association of proteins differentially prevalent between CD samples and healthy controls (first ring), or ulcerative colitis (UC) samples and healthy controls (second ring) via InvestiGUT. Proteins enriched in CD are purple, those enriched in healthy samples are blue, and those enriched in UC are red. The third ring represents the GC content relative to the average of the entire plasmid. Boxes are used to represent genes identified on the plasmid in the forward (outer ring) and reverse (inner ring) strand, with coloured boxes being assigned a COG category, while grey boxes represent COG-unassigned proteins. The fimbriae loci proteins are indicated in dark grey. Enzymes with a single restriction site are indicated on the outer ring in orange. i Quantification of cell adhesion from a pMMCAT-containing strain of P. vulgatus (CLA-AA-H253) and its closest relative strain (H-iso) without the megaplasmid (see “Methods” section). Visualised are the mean values with the 95% confidence intervals. Statistics: paired, one-tailed t-tests. j Representative images of cell adhesion of the two selected strains. Images were taken from the three replicates tested. Green scale bars represent 50 µm.
Fig. 4
Fig. 4. Novel diversity within Faecalibacterium and strain-dependent butyrate production.
a The two novel species of Faecalibacterium described within this paper placed within the current landscape of Faecalibacterium spp. with a valid name, along with the type genomes for proposed divisions of F. prausnitzii, as determined by GTDB. The phylogenomic tree was rooted on Ruminococcus bromii ATCC 27255T. Novel species are in bold, and the type strain of F. prausnitzii is underlined. b Relative abundance and prevalence of the genus Faecalibacterium, and each Faecalibacterium species represented within HiBC across 4624 metagenomic samples. The boxplots include a central line indicating the median, boxes represent the interquartile range, and whiskers represent the minimum and maximum values, not including outliers. c Butyrate production pathway in Faecalibacterium with gene names and KEGG ortholog identifiers when possible. d Phylogenomic tree of the Faecalibacterium strains within HiBC, displaying the ability of each strain to produce butyrate over a 48 h-period, along with the OD600 that the strain achieved during the testing period (n = 3 independent batch cultures for each strain; the replicates are shown with individual boxes). The phylogenomic tree was rooted on R. bromii ATCC 27255T. e Sequence comparison of the butyrate production loci across the Faecalibacterium strains. Genes are coloured based on their assignment to each step in the butyrate production pathway in (c). f AlphaFold3 model of the But complex in F. tardum CLA-AA-H175 against the full But protein in F. prausnitzii CLA-AA-H222. The first CLA-AA-H175 But gene is highlighted in yellow in the dashed box, while the second gene is shown in brown. The highlighted protein is indicated in the top right of the dashed box. g Same as in (f), but this time the second CLA-AA-H175 But gene is highlighted in yellow in the dashed box, while the first gene is in brown. The highlighted protein is indicated in the top right of the dashed box. h Correlation of the mean OD600 against the mean butyrate production of each strain with a linear regression and its 95% confidence interval and analysed using a two-sided Pearson correlation coefficient.

References

    1. Forster, S. C. et al. A human gut bacterial genome and culture collection for improved metagenomic analyses. Nat. Biotechnol.37, 186–192 (2019). - PMC - PubMed
    1. Groussin, M. et al. Elevated rates of horizontal gene transfer in the industrialized human microbiome. Cell184, 2053–2067.e18 (2021). - PubMed
    1. Liu, C. et al. Enlightening the taxonomy darkness of human gut microbiomes with a cultured biobank. Microbiome9, 1–29 (2021). - PMC - PubMed
    1. Browne, H. P. et al. Culturing of ‘unculturable’ human microbiota reveals novel taxa and extensive sporulation. Nature533, 543–546 (2016). - PMC - PubMed
    1. Hedlund, B. P. et al. SeqCode: a nomenclatural code for prokaryotes described from sequence data. Nat. Microbiol.7, 1702–1708 (2022). - PMC - PubMed

LinkOut - more resources