. 2025 May 6;16(1):4214.
doi: 10.1038/s41467-025-58966-1.

m6A/IGF2BP3-driven serine biosynthesis fuels AML stemness and metabolic vulnerability

Affiliations

m6A/IGF2BP3-driven serine biosynthesis fuels AML stemness and metabolic vulnerability

Feng Huang et al. Nat Commun. .

Abstract

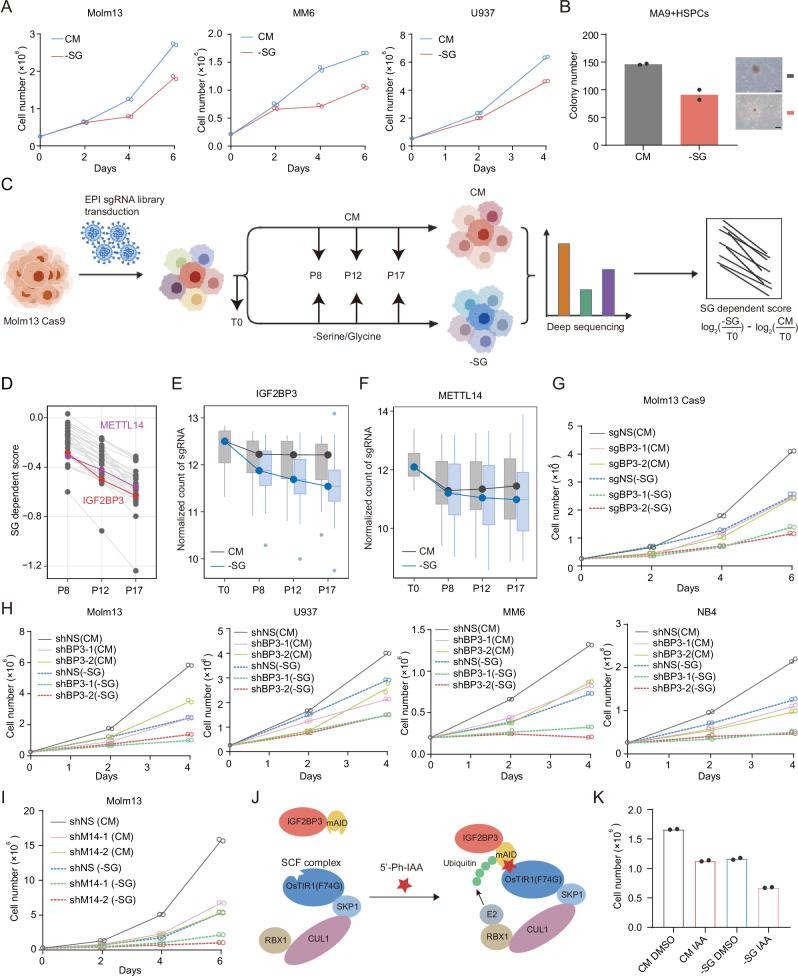
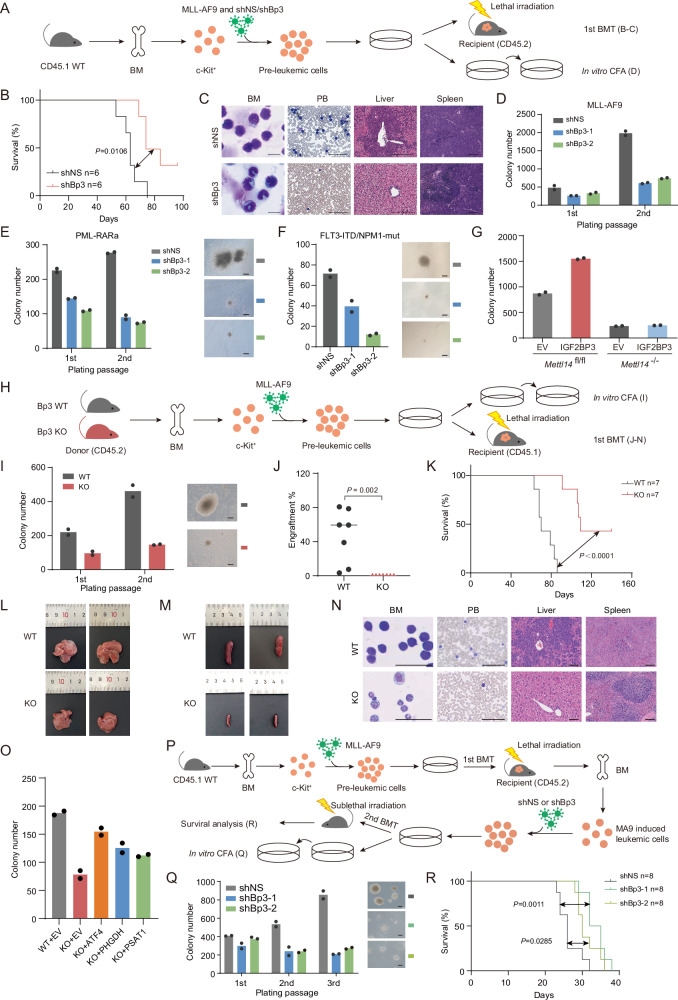
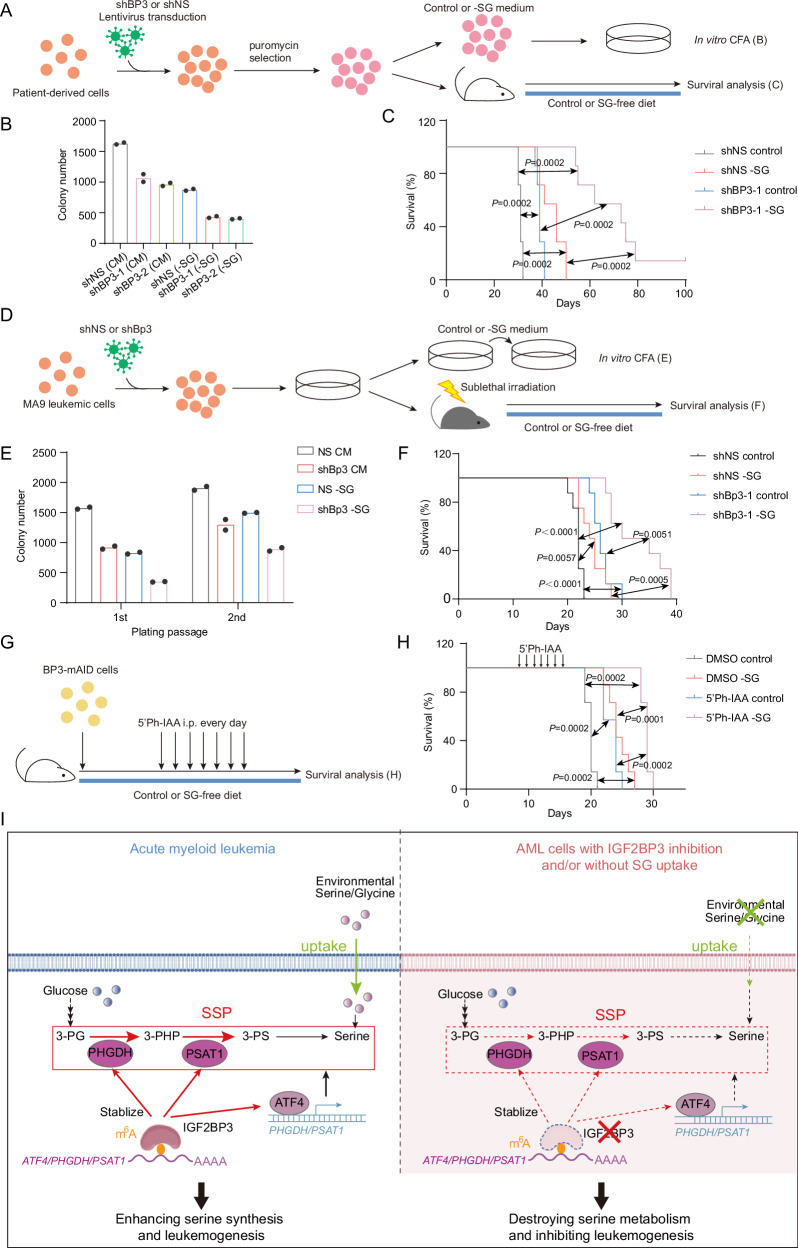
Metabolic reprogramming of amino acids represents a vulnerability in cancer cells, yet the mechanisms underlying serine metabolism in acute myeloid leukemia (AML) and leukemia stem/initiating cells (LSCs/LICs) remain unclear. Here, we identify RNA N6-methyladenosine (m6A) modification as a key regulator of serine biosynthesis in AML. Using a CRISPR/Cas9 screen, we find that depletion of m6A regulators IGF2BP3 or METTL14 sensitizes AML cells to serine and glycine (SG) deprivation. IGF2BP3 recognizies m6A on mRNAs of key serine synthesis pathway (SSP) genes (e.g., ATF4, PHGDH, PSAT1), stabilizing these transcripts and sustaining serine production to meet the high metabolic demand of AML cells and LSCs/LICs. IGF2BP3 silencing combined with dietary SG restriction potently inhibits AML in vitro and in vivo, while its deletion spares normal hematopoiesis. Our findings reveal the critical role of m6A modification in the serine metabolic vulnerability of AML and highlight the IGF2BP3/m6A/SSP axis as a promising therapeutic target.


Conflict of interest statement

Competing interests: The authors declare no competing interests.

Figures

Fig. 1
Fig. 1. A CRISPR/Cas9-based genetic screen reveals a role of m6A in the sensitivity of AML cells to SG starvation.
A Growth curves of AML cell lines grown in complete medium (CM) or equivalent medium lacking serine and glycine (-SG). B Mouse HSPCs were transduced with MLL-AF9 (MA9) retroviruses, followed by cultured in CM or -SG progenitor medium for 2 days. The cells were then plated into mouse methylcellulose medium for CFA. Colony numbers and representative photos of colonies are shown. Bar = 200 μm. C A schematic diagram, created from GDP (https://BioGDP.com, Agreement number: GDP2025UWV74M), depicting the CRISPR/Cas9-based screening strategy. Lentivirus-transduced Molm13 Cas9 cells were selected with puromycin for 5 days and collected for an initial gDNA sample (denoted as T0). Cells were further grown in CM or -SG medium for 8, 12, or 17 population doublings, and were denoted as P8, P12, or P17, respectively. For each gene, we calculated its gene score as the mean log2 fold change (LFC) in the abundance of all the sgRNAs targeting the corresponding gene in different population doublings compared to T0. The SG-dependent score refers to the difference in gene scores in the absence versus presence of SG at the same population doubling. D The SG-dependent scores of the top 30 genes from the screening in (C), with the m6A regulatory genes IGF2BP3 and METTL14 being highlighted in red and purple, respectively. E, F The normalized abundance of the 12 sgRNAs targeting IGF2BP3 (E) or METTL14 (F) from cells cultured in CM or -SG medium and collected at P8, P12, and P17. The definition of data points is same as in (C). n = 12 sgRNAs. The boxes extend from the 25th to the 75th percentiles, with a distinct line marking the median. Whiskers extend to the maximum and minimum data points. G Growth curves of Molm13 Cas9 transduced with control sgRNA (sgNS) or IGF2BP3 sgRNA (sgBP3) and grown in CM or -SG medium. H Growth curves of control or IGF2BP3 KD cells in CM or -SG medium. I Growth curves of control or METTL14 KD Molm13 cells in CM or -SG medium. J Schematic illustration showing the AID2 system in inducing rapid degradation of IGF2BP3 protein. K Relative growth of IGF2BP3-mAID (clone BP3-mAID cells) cells in CM or -SG medium with or without treatment with 5’Ph-IAA (IAA) for 24 h. Mean ± SD values are shown. n = 2 biologically independent repeats in (A, B, G, H, I, and K). Source data are provided as a Source Data file.
Fig. 2
Fig. 2. IGF2BP3 regulates serine biosynthesis as an m6A reader.
A Bubble diagram showing the enrichment of metabolic pathways by the C13-labeled metabolites with reduced levels after IGF2BP3 KD in Molm13 cells. B Heatmaps showing levels of representative C13-labeled metabolites after IGF2BP3 KD in Molm13 cells. C The total levels and isotopolog distribution (M + n, n refers to numbers of 13C) of purines measured by LC-MS in Molm13 cells transduced with IGF2BP3 shRNAs or shNS and grown in medium containing U-[13C]-glucose. D Schematic of the serine synthesis pathway and its downstream pathways. E The levels of C13-labeled serine (M + 3) were measured by LC-MS in Molm13 cells transduced with IGF2BP3 shRNAs or shNS and grown in medium containing U-[13C]-glucose. FH Intracellular serine level measured by fluorescence-based serine detection assays in Molm13 cells transduced with shRNAs (F) or sgRNAs (G) targeting IGF2BP3 or shRNAs targeting METTL14 (H), compared to those with negative control (shNS). I The Venn diagram showing the overlap of significantly downregulated genes (adjusted P < 0.05, fold change <0.67) in Molm13 cells with IGF2BP3 KD, as well as in U937 BP3-mAID cells treated with 5’Ph-IAA for 6 or 24 h to induce degradation of the IGF2BP3 protein. J Pie chart showing numbers of transcripts with or without m6A modifications among the 61 overlapping genes in (H), and heatmap showing expression changes of the 48 m6A-containing transcripts in IGF2BP3 KD Molm13 cells or IGF2BP3-depleted U937 cells. K GO enrichment analysis of the 48 candidate targets of IGF2BP3 in (I). The degrees of interactions were generated by STRING. Mean ± SD values are shown. n = 2 biologically independent repeats in (C) and (E), while n = 3 biologically independent repeats in (FH). P-values were calculated with one-sided Hypergeometric test (A, K); two-tailed Wald test adjusted with Benjamini-Hochberg Procedure (I); two-tailed student’s t-test (FH); Source data are provided as a Source Data file.
Fig. 3
Fig. 3. IGF2BP3 directly regulates expression of ATF4, PHGDH, and PSAT1 via m6A recognition.
A Western blot after IGF2BP3 KD in various AML cell lines. GAPDH was used as a loading control. B Western blot of U937 BP3-mAID cells after treatment with 5’Ph-IAA for the indicated time periods. ACTB was used as a loading control. C Western blot of Molm13 cells after overexpression of wild-type (BP3-WT) or KH3-4 mutated (BP3-KH34) IGF2BP3. D Western blot of Molm13 cells after METTL14 KD. E IGV tracks showing the distribution of m6A (GEO: GSE97408) or IGF2BP3 binding sites (GEO: GSE90639) in target mRNAs. Gray shadow depicts high-confidence m6A regions for qPCR validation in (G) and (H). F RIP assays using an IGF2BP3 antibody were performed in Molm13 cells, followed by qPCR to detect direct binding of IGF2BP3 to target mRNAs at regions indicated in (E). G MeRIP-qPCR was performed in control and METTL14 KD Molm13 cells to detect the change of m6A abundance at indicated regions of ATF4, PHGDH, and PSAT1 transcripts. H Bst DNA polymerase-mediated cDNA extension and qPCR assays to evaluate relative m6A abundance changes at specific sites within ATF4, PHGDH, and PSAT1 transcripts in control and METTL14 KD Molm13 cells. I Control and IGF2BP3 KD Molm13 cells were treated with actinomycin D for indicated time periods and the RNA level of target genes was examined by qPCR. 18S rRNA was used as a loading control. The mRNA half-life (t1/2) was calculated and shown. (J, K) Live cell counting (J) and cytometric analysis of Annexin V+ apoptotic cells (K) in Molm13 cells upon IGF2BP3 KD and ATF4, PHGDH, or PSAT1 overexpression. EV, empty vector. (L, M) Molm13 cells were co-transduced with control or IGF2BP3 shRNAs and ATF4/PHGDH/PSAT1 overexpression vectors and subjected to colony-forming assays (L) and serine level detection (M). Representative results from one of the two independent experiments were shown (AD). Mean ± SD values are shown. n = 3 biologically independent repeats in (F, G, H, I, K, and M), while n = 2 biologically independent repeats in (J) and (L). Two-tailed student’s t-test (FH), two-way ANOVA (K, M). Source data are provided as a Source Data file.
Fig. 4
Fig. 4. Igf2bp3 promotes murine AML initiation and development.
A Schematic illustration of the in vivo primary BMT assay and in vitro CFA with HSPCs co-transduced with MA9 retroviruses and Igf2bp3 shRNA (or shNS) lentiviruses. B Kaplan–Meier curves showing the effect of Igf2bp3 KD on MA9-induced leukemogenesis. C Wright-Giemsa staining of BM cells and PB blood smear, and hematoxylin and eosin (H&E) staining of livers and spleens of the representative primary BMT mice from (B) at the endpoint. Scale bars from left to right: 20 μm, 50 μm, 200 μm, 300 μm. D, E CFA using mouse HSPCs transduced with MA9 (D) or PML-RARa (E) plus shNS, Bp3-sh1, or Bp3-sh2 viruses. F HSPCs from FLT3-ITD/NPM1-mut mice were transduced with shNS, Bp3-sh1, or Bp3-sh2 viruses and seeded for CFA. Bar = 200 μm. G HSPCs from Mettl14fl/fl-CREERT mice were transduced with MA9 retroviruses and seeded for CFA. Mettl14 KO was induced by addition of 4-Hydroxytamoxifen (4-OHT, 1 mM) during plating. H Schematic illustration of the in vivo primary BMT assay and in vitro CFA with HSPCs from Igf2bp3 WT and KO mice. I Colony numbers and representative photos of colonies in the CFA assays illustrated in (H). Bar = 200 μm. J Flow cytometric analysis of CD45.2+ donor cell percentages in PB of recipient mice 8 weeks after BMT. n = 7 mice. K Kaplan–Meier curves showing the effect of Igf2bp3 KO on MA9-induced leukemogenesis. L, M Representative images of liver (L) and spleen (M) tissues from the primary BMT mice in (K) at the endpoint. N Wright-Giemsa staining of BM cells and PB blood smear, and H&E staining of livers and spleens of representative primary BMT recipient mice from (K) at the endpoint. Scale bars are same as in (C). O HSPCs from WT or Igf2bp3 KO mice were co-transduced with MA9 and ATF4-, PHGDH-, or PSAT1-overexpressing viruses and seeded for CFA. P Schematic illustration of the secondary BMT assay and CFA with MA9-induced leukemic cells transduced with Igf2bp3 shRNA (or shNS) lentiviruses. Q CFA assays showing the effect of Igf2bp3 KD on BM cells from MA9 leukemia mice. Bar = 200 μm. R Kaplan–Meier curves showing the result of secondary BMT using cells collected from the first plating of (O). Representative results from one of at least two mice were shown (C, N). Mean ± SD values are shown. n = 2 biologically independent repeats in (D, E, F, G, I, O, and Q). Statistical analysis: Two-tailed student’s t-test (J); log-rank test (B, K, and R). Source data are provided as a Source Data file.
Fig. 5
Fig. 5. IGF2BP3 is highly expressed in LSCs/LICs and required for the maintenance of AML stemness.
A Expression of IGF2BP3 mRNA in AML patient samples and healthy donors from the TNMplot database. Box plot, center line, median; box limits, upper and lower quartiles; whiskers, 1.5× interquartile range. n = 407 healthy samples; n = 151 AML samples. B Expression of IGF2BP3 in CD34+ and CD34- cells from BM of healthy donors (normal) or AML patients as detected by microarray (GSE30029). n = 31 CD34+ normal samples; n = 46 CD34+ AML samples; n = 44 CD34- AML samples. C Expression of IGF2BP3 in blast (LSC, non-engrafting) or LSC (LSC+, engrafting) cells from AML patients (GSE199452). n = 40 LSC samples; n = 70 LSC+ samples. D Experimental scheme for (EG). Patient-derived CD34+ cells were transduced with shNS or shRNAs targeting IGF2BP3 and subjected to different assays. EG Growth curves (E), percentages of Annexin V+ apoptotic cells (F), and colony numbers (G) of patient-derived CD34+ leukemia cells with or without IGF2BP3 KD. Bar = 200 μm. H The percentage of L-GMP population (CD45.2+Lin-c-kit+Sca1-CD34+CD16/32+) in BM of the primary BMT mice. n = 6 mice per group. I, J Statistics of the percentage of Annexin V+ (I) or Ki67+ (J) L-GMPs of mice in (H). n = 6 mice. K In vitro LDA assays using MA9-transduced HSPCs from Igf2bp3 WT and KO mice. Logarithmic plots show the percentage of nonresponding wells (those without any colonies) at different doses of cells seeded. The estimated LSC/LIC frequency is calculated by ELDA and shown. L, M In vitro LDA assays of mouse HSPCs co-transduced with MA9 plus shRNA targeting Igf2bp3 (L) or its target genes (M). N HSPCs collected from Igf2bp3 WT and HO mice were co-transduced with MA9 and target gene-overexpressing viruses and selected in methylcellulose medium with G418 and puromycin for 7 days before seeded for LDA assays. Mean ± SD values are shown. n = 2 biologically independent repeats in E, G while n = 3 biologically independent repeats in (F). Statistical analysis: Two-tailed student’s t-test (A, C, F, HJ); two-way ANOVA (B); One-sided Chi-squared test (KN). Source data are provided as a Source Data file.
Fig. 6
Fig. 6. Igf2bp3 is dispensable for normal hematopoiesis.
A Schematic outline of experimental strategy testing the effect of Igf2bp3 KO on mouse static normal hematopoiesis. n = 7 mice per group. BD PB analysis of Igf2bp3 WT and KO mice. The density of white blood cells (WBC), lymphoma cells (LYM), red blood cells (RBC) (C), palates (PLT) (D), neutrophils (NEUT), monocytes (MONO), and eosinophils (EO) (E) are shown. E Flow cytometric gating strategies for HSC and progenitors. F, G Frequencies of various hematopoietic progenitors in the BM of Igf2bp3 WT and KO mice as examined by flow cytometry. LSK, Lin-Sca1+cKit+ cells; MPP, multipotent progenitor (Lin-Sca1+cKit+CD48+CD150-); LT-HSC, long-term HSC (Lin-Sca1+cKit+CD48-CD150+); ST-HSC, short-term HSC (Lin-Sca1+cKit+CD48-CD150-); LMPP, lymphoid-primed multipotent progenitor (Lin-Sca1highcKithighCD127+CD135+); CLP, common lymphoid progenitor (Lin-Sca1lowcKitlowCD127+CD135+); CMP, common myeloid progenitor (Lin-Sca1-cKit+CD34intCD16/32low); GMP, granulocyte-monocyte progenitor (Lin-Sca1-cKit+CD34+CD16/32high); MEP, megakaryocyte–erythroid progenitor (Lin-Sca1-cKit+CD34-CD16/32-). H Flow cytometric gating strategies for mature cells. I Frequencies of various mature cells in the BM of Igf2bp3 WT and KO mice as examined by flow cytometry. J Schematic outline of competitive repopulation assay. n = 7 mice per group. K Flow cytometric gating strategy for BM cells derived from Igf2bp3 WT or KO donor mice in the competitive repopulation assay. L Flow cytometry analysis for different donor-derived cells (CD45+) in PB of recipient mice 4, 8, 12, and 16 weeks after BMT. M, N Percentage of donor-derived stem cell (M) and progenitor (N) compartments in the bone marrow of recipients 16 weeks after BMT. Mean ± SD values are shown. Statistical analysis: Two-tailed student’s t-test (BD, F, G, I, LN); n.s., not significant. Source data are provided as a Source Data file.
Fig. 7
Fig. 7. IGF2BP3 inhibition in combination with SG deprivation exhibits potent anti-leukemia efficacy in vitro and in vivo.
A Experimental scheme for (B) and (C). M-NSG immunodeficient recipient mice were transplanted with AML PDX cells (FLT3-TKD mutation) transduced with shNS or shRNA targeting Igf2bp3, and fed with a regular (control) or SG-free (-SG) diet. B Colony numbers of AML PDX cells (FLT3-TKD) are shown to reflect the effect of SG deprivation (-SG) on control (NS) or Igf2bp3 KD (shBp3) cells compared to complete medium (CM). C Kaplan–Meier curves showing survival of recipient mice fed with a regular (control) diet or an equivalent diet lacking SG (-SG). n = 7 mice per group. D Experimental scheme for (E) and (F). BM cells from MA9 leukemic mice were transduced with shNS or shRNA targeting Igf2bp3 and selected with puromycin before subjected to CFA assays (E) or BMT assays (F). E Colony numbers in CFA assays are shown to reflect the effect of SG deprivation (-SG) on control (NS) or Igf2bp3 KD (shBp3) cells compared to complete medium (CM). F Kaplan–Meier curves showing survival of recipient mice fed with a regular (control) diet or an equivalent diet lacking SG (-SG). n = 8 mice per group. G Experimental scheme of the xenotransplantation assays in (H). M-NSG immunodeficient recipient mice were transplanted with U937 BP3-mAID cells and fed with a regular (control) or SG-free (-SG) diet. 5’Ph-IAA (3 mg/kg) or vehicle control (DMSO) were given via intraperitoneal injection (i.p.) every day for 7 consecutive days starting from the 8th day after transplantation. H Kaplan–Meier curves showing survival of the M-NSG recipient mice in (G). n = 7 mice per group. I Schematic illustration of the working model and therapeutic strategy proposed in the study, created with the assistance of GDP (Agreement number: GDP2025KABQ7W). Mean ± SD values are shown. n = 2 biologically independent repeats in (B) and (E). Statistical analysis: log-rank test (C, F, and H). Source data are provided as a Source Data file.

References

    1. Dohner, H., Weisdorf, D. J. & Bloomfield, C. D. Acute myeloid leukemia. N. Engl. J. Med. 373, 1136–1152 (2015) - PubMed
    1. Kantarjian, H. et al. Acute myeloid leukemia: current progress and future directions. Blood Cancer J.11, 41 (2021). - PMC - PubMed
    1. Chen, J., Odenike, O. & Rowley, J. D. Leukaemogenesis: more than mutant genes. Nat. Rev. Cancer10, 23–36 (2010). - PMC - PubMed
    1. Shlush, L. I. et al. Tracing the origins of relapse in acute myeloid leukaemia to stem cells. Nature547, 104–108 (2017). - PubMed
    1. Hou, S., Liu, J. & Zhu, Y. Multi-omics advances for molecular characterization, precision medicine, and prognostic implications in leukemia. Cell Investig.1, 100007 (2025).

MeSH terms