. 2025 May 6;11(1):45.
doi: 10.1038/s41421-025-00795-z.

Distinct methylomic signatures of high-altitude acclimatization and adaptation in the Tibetan Plateau

Affiliations

Distinct methylomic signatures of high-altitude acclimatization and adaptation in the Tibetan Plateau

Feifei Cheng et al. Cell Discov. .

Abstract

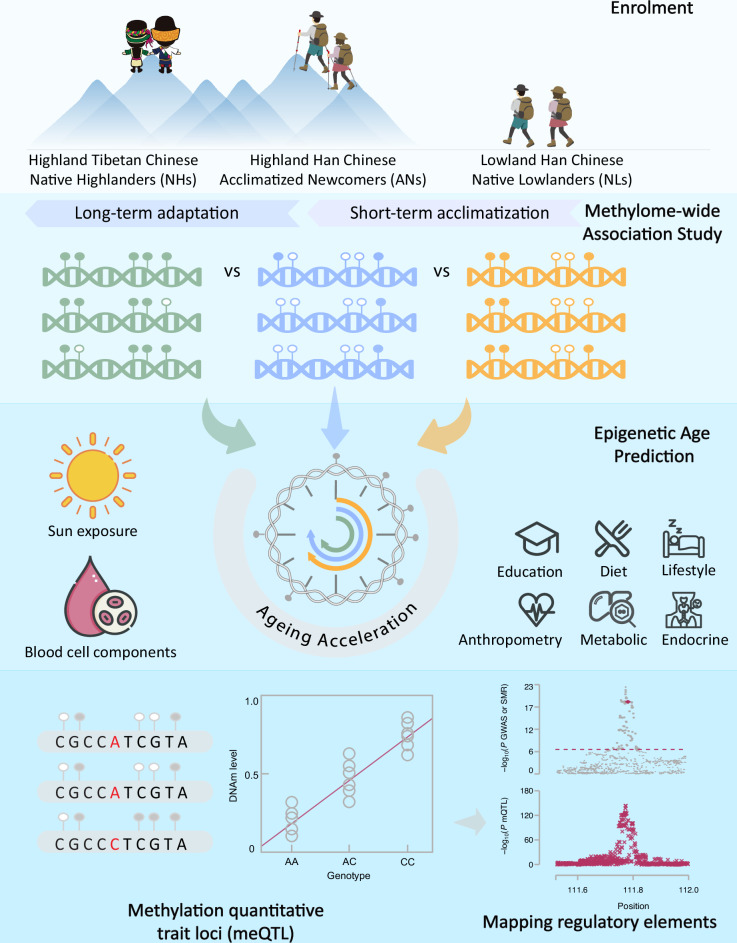
High altitude presents a challenging environment for human settlement. DNA methylation is an essential epigenetic mechanism that responds to environmental stimuli, but its roles in high-altitude short-term acclimatization (STA) and long-term adaptation (LTA) are poorly understood. Here, we conducted a methylome-wide association study involving 687 native highlanders and 299 acclimatized newcomers in the Tibetan Plateau and 462 native lowlanders to identify differentially methylated sites (DMSs) associated with STA or LTA. We identified 93 and 4070 DMSs for STA and LTA, respectively, which had no overlap, showed opposite asymmetric effect size patterns, and resided near genes enriched in distinct biological pathways/processes (e.g., cell cycle for STA and immune diseases and calcium signalling pathway for LTA). Epigenetic clock analysis revealed evidence of accelerated ageing in the acclimatized newcomers compared to the native lowlanders. Our research provides novel insights into epigenetic regulation in relation to high altitude and intervention strategies for altitude-related ageing or illnesses.


Conflict of interest statement

Conflict of interest: The authors declare no competing interests.

Figures

Fig. 1
Fig. 1. Schematic of the study design.
First, we enrolled participants, namely, native highlanders (NHs, Highland Tibetan Chinese), acclimatized newcomers (ANs, Highland Han Chinese), and native lowlanders (NLs, Lowland Han Chinese). Second, we conducted MWAS to investigate DNAm alterations associated with high-altitude STA and LTA. DMSs of long-term adaptation were identified by comparing NHs and ANs. DMSs of short-term acclimatization were identified by comparing ANs and NLs. Third, epigenetic clock analysis was utilized to assess ageing acceleration in the three groups. Eight categories of behavioral and biomedical phenotypes were tested for associations with ageing acceleration in the subjects living in the Tibetan Plateau. Fourth, with the availability of genotype and DNAm data, we performed meQTL analysis and investigated the role of genetic differentiation in driving the LTA DMSs.
Fig. 2
Fig. 2. MWAS analyses for STA and LTA.
a, c Manhattan plots of MWAS results for STA (a) and LTA (c). The x-axis denotes the genomic position, and the y-axis denotes the MWAS association log10(bacon-adjusted P value) times the sign of the effect size (the difference in the mean DNAm level of the target group from the control group). The dashed lines indicate the methylome-wide significance thresholds (bacon-adjusted P value = 1.12×10⁷). DMSs were annotated to the nearest genes. b, d The quantile-quantile plot shows the observed log10(bacon-adjusted P value) in the y-axis against the expected distribution under the null in the x-axis for STA (b) and LTA (d). e Functional element enrichment for the STA DMSs. f Functional element enrichment for the LTA DMSs. The y-axis denotes the functional elements, and the x-axis represents the corresponding odds ratios. ** indicates P value of permutation test < 0.01, and *** indicates P value of permutation test < 0.001. The 16 genomic elements included assembly gaps and alignment artefacts (GapArtf), quiescent states (Quies), heterochromatin states (HET), polycomb repressed states (ReprPC), acetylations (Acet), weak candidate enhancers (EnhWk), active candidate enhancers (EnhA), transcribed candidate enhancers (TxEnh), weak transcription (TxWk), strong transcription (Tx), exons and transcription (TxEx), zinc finger gene states (znf), DNase I hypersensitivity (DNase), bivalent promoter states (BivProm), flanking promoter states (PromF), and transcription start site states (TSS).
Fig. 3
Fig. 3. Gene-set enrichment for STA and LTA.
ad Bubble plots of the top 10 KEGG and GO terms ranked by the gene set enrichment analyses using the methylGSA R package. The y-axis denotes the biological pathways/processes, and the x-axis represents the enrichment significance log10(false discovery rate (FDR)-adjusted P value). The size of the bubble indicates the number of genes in the set. The dashed line indicates an FDR threshold of 0.05. KEGG enrichment for STA (a). KEGG enrichment for LTA (b). GO enrichment for STA (c). GO enrichment for LTA (d).
Fig. 4
Fig. 4. Characteristics of the THCH meQTLs and their performance in prioritizing DNAm probes associated with complex traits.
a Position of cis- and trans-meQTLs across the genome. Each point represents an meQTL with the position of the CpG site on the x-axis and the SNP position on the y-axis, colored based on SNP chromosomes. The dashed lines indicate the chromosome boundary. The diagonal line shows the abundance of cis-meQTLs throughout the genome. b Heatmap of meQTL effect size correlations across datasets/populations. Heatmap color and texts in the block both show the estimates of rb with the corresponding standard error in parentheses. The top significant SNP-probe pairs (FDR adjusted P values < 0.05) in the discovery group and the matched pairs in the replication group were selected for estimating rb. The analysis included three datasets/populations: the THCH data from the present study (Chinese, EAS), the Singapore iOmics data (Southeast Asians), and a meta-analysis of the Lothian Birth Cohort (LBC) and the Brisbane Systems Genetics Study (BSGS) data (EUR ancestry). c Enrichment of lead cis-meQTLs in genomic elements. Odds ratios are depicted with error bars indicating the 95% CI of the estimate. The labels are the odds ratio estimates with the enrichment test P values in parentheses. d Enrichment of lead trans-meQTLs in genomic elements. Log(odds ratios) are depicted with an error bar indicating the 95% CI of the estimate. The labels are the odds ratio estimates with the enrichment test P values in parentheses. The 16 genomic elements included assembly gaps and alignment artefacts (GapArtf), quiescent states (Quies), heterochromatin states (HET), polycomb repressed states (ReprPC), acetylations (Acet), weak candidate enhancers (EnhWk), active candidate enhancers (EnhA), transcribed candidate enhancers (TxEnh), weak transcription (TxWk), strong transcription (Tx), exons and transcription (TxEx), zinc finger gene states (znf), DNase I hypersensitivity (DNase), bivalent promoter states (BivProm), flanking promoter states (PromF), and transcription start site states (TSS). e Bar plot of the number of DNAm probes associated with 32 complex traits from the EAS GWAS summary data. The x-axis shows the acronyms for the traits, and the y-axis shows the number of DNAm probes identified with COLOC PP4 statistics > 0.8 using the THCH or LBC + BSGS meQTL data.
Fig. 5
Fig. 5. The role of genetic differentiation in driving the LTA DMSs.
a MWAS analysis upon adding a covariate of the lead variant in the known adaptative loci. The y-axis denotes LTA DMSs that are annotated to the known adaptive loci, such as EGLN1, EPAS1, and HLA-DQB1, and the x-axis represents the effect size for MWAS analysis with error bars representing standard errors. Colors indicate two different models before/after adding the lead variant as a covariate. b, c Identification of genetic loci in which meQTL and high-altitude genetic adaptation signals share the same causal variants using SMR analysis. The x-axis represents the genomic positions, and the y-axes display -log10(P-value) for GWAS, meQTL and SMR analyses in the indicated tracks. EPAS1 region in the chromosome 2 (b). EGLN1 region in the chromosome 1 (c).
Fig. 6
Fig. 6. Epigenetic age prediction.
a Scatter plots of chronological age (y-axis) against the BLUP model-predicted age (x-axis). Each dot represents an individual, and each panel represents a group in the THCH cohort. The red line represents a slope of 1 and an intercept of 0. The number in the top-left of the panel is the coefficient of determination (R2). b Box plot of the AARs of the three groups. The P values above the box represent the statistical significance of the pairwise differences in mean AAR between the two groups indicated. The P-value below the box represents the significance of the difference in mean AAR among all the three groups.

Similar articles

Cited by

References

    1. Körner, C. The use of ‘altitude’ in ecological research. Trends Ecol. Evol.22, 569–574 (2007). - PubMed
    1. Moore, L. G. Measuring high-altitude adaptation. J. Appl. Physiol.123, 1371–1385 (2017). - PMC - PubMed
    1. Zhang, X. L. et al. The earliest human occupation of the high-altitude Tibetan Plateau 40 thousand to 30 thousand years ago. Science362, 1049–1051 (2018). - PubMed
    1. Yang, J. et al. Genetic signatures of high-altitude adaptation in Tibetans. Proc. Natl. Acad. Sci. USA114, 4189–4194 (2017). - PMC - PubMed
    1. Bennett, A., Sain, S. R., Vargas, E. & Moore, L. G. Evidence that parent-of-origin affects birth-weight reductions at high altitude. Am. J. Hum. Biol.20, 592–597 (2008). - PubMed

LinkOut - more resources