. 2025 May 6;16(1):4210.
doi: 10.1038/s41467-025-59430-w.

A highly conserved neuronal microexon in DAAM1 controls actin dynamics, RHOA/ROCK signaling, and memory formation

Affiliations

A highly conserved neuronal microexon in DAAM1 controls actin dynamics, RHOA/ROCK signaling, and memory formation

Patryk Poliński et al. Nat Commun. .

Abstract

Actin cytoskeleton dynamics is essential for proper nervous system development and function. A conserved set of neuronal-specific microexons influences multiple aspects of neurobiology; however, their roles in regulating the actin cytoskeleton are unknown. Here, we study a microexon in DAAM1, a formin-homology-2 (FH2) domain protein involved in actin reorganization. Microexon inclusion extends the linker region of the DAAM1 FH2 domain, altering actin polymerization. Genomic deletion of the microexon leads to neuritogenesis defects and increased calcium influx in differentiated neurons. Mice with this deletion exhibit postsynaptic defects, fewer immature dendritic spines, impaired long-term potentiation, and deficits in memory formation. These phenotypes are associated with increased RHOA/ROCK signaling, which regulates actin-cytoskeleton dynamics, and are partially rescued by treatment with a ROCK inhibitor. This study highlights the role of a conserved neuronal microexon in regulating actin dynamics and cognitive functioning.


Conflict of interest statement

Competing interests: The authors declare no competing interests

Figures
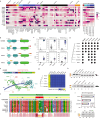
Fig. 1
Fig. 1. Neuronal-specificity and evolutionary conservation of Daam1-MIC.
a Heatmap showing gene expression levels of formin genes across multiple tissues and cell types based on VastDB. TPM: Transcript Per Million. b Schematic representation of the protein impact of neural-specific exons. Yellow-colored boxes represent upstream and downstream exons where the red box represents the alternatively spliced exon. GBD, GTPase-binding domain; FH3, Formin-Homology-3 domain or Diaphanous-Inhibitory Domain; FH2, Formin-Homology-2 domain. c Distribution of inclusion levels, using the Percent Spliced In (PSI) metric, for neural-specific exons in formin genes. PSI values were obtained from VastDB. Number of data points per plot and source data are provided as a Source Data file 1. d Evolutionary conservation of neural-specific alternative exons in formin genes. Black dots indicate the presence of an exon ortholog at the genome level. e Schematic representation of DAAM1 and its domains (top), together with DAAM1 protein structure based on AlphaFold2 (bottom). The location of Daam1-MIC (HsaEX0018410 in VastDB) is shown. f Partial amino acid sequence alignment of the FH2 domain of DAAM1 orthologs across vertebrates. Microexon (μ), upstream (C1), and downstream exons (C2) are indicated. The barplot depicts amino acid conservation. g Conserved neural-specificity of Daam1-MIC orthologs in vertebrates. PSI values from VastDB. h RT-PCR assays showing the inclusion of Daam1-MIC orthologs in different tissues from mice and zebrafish. i Srrm3/4-dependent regulation of Daam1-MIC orthologs in human, mouse and zebrafish. PSI values in the condition with (+, blue) or without (-, red) Srrm3/4 are shown. RNA-seq data from human HEK293 cells overexpressing human SRRM4, mouse N2A cells upon Srrm3/4 knockdown, and zebrafish retinae extracted from Srrm3 KO 5 days post fertilization larvae. j RT-PCR assays showing the inclusion of Daam1-MIC in cerebellum of WT and Srrm3 KO mice. h, j Inclusion and the skipping bands are indicated on the left side of the gel. PSI values are indicated below. RT-PCR assays were performed once. GBD GTPase-binding domain, FH3 Formin-Homology-3 domain or Diaphanous-Inhibitory Domain, DD Dimerization Domain, CC Coiled-Coil Domain, FH1 Formin-Homology-1 domain, FH2 Formin-Homology-2 domain, DAD Diaphanous-Autoregulatory Domain.
Fig. 2
Fig. 2. Splice variants of the DAAM1 FH2-COOH fragment differentially modulate actin dynamics.
a Schematic representation of DAAM1 domains (top) and subdivisions (bottom). FH2-COOH corresponds to the purified protein fragment. Domain nomenclature from Fig. 1e. b Structure of FH2 domain with (left) or without (right) microexon. Subregions share the same color-code as in (a). c Comparison of the linker regions among all human formin proteins. Loop color corresponds to the formin color from Fig. S1a. Structures obtained from AlphaFold2 and visualized using the PyMoL program. d Linker lengths across 10 formins. Linker color corresponds to c and S1a. Source data are provided as a Source Data file 2. e Pyrene actin polymerization assay. Each curve is the average of four technical replicates. Top: Schematic representations of the actin polymerization phases. f Actin polymerization rates, where data points correspond to technical replicates from four independent experiments. P-values from one-way ANOVA with replicate and category as factors. g Representative images of fluorescence micrographs showing F-actin fibers in the presence of microexon-containing (+MIC) or non-containing (-MIC) splice variants. 2 μM Actin and 200 nM DAAM1 fragments were used. Scale bars: 10 μm and 2 μm (magnification). Right: zoom of the regions highlighted in “15 min”. Arrows indicate differences in actin fiber morphology. h Total fiber intensity through time for 0.2 μM actin and 200 nM DAAM1 fragments. Statistical tests in Fig. S2f. i Dual-color TIRF microscopy of actin fibers obtained after 50 min using 0.2 μM actin and 200 nM SNAP-tagged proteins. Top: representative images of actin fibers. Bottom: fluorescence intensity distribution along the fibers (black/blue/red indicates actin/+MIC/-MIC proteins, respectively). Scale bar: 1 μm. j Fluorescence intensity along actin fibers through time. Statistical tests in Fig. S3f. h, j Thick lines: median from two independent experimental replicates. Dispersion: first and third quartiles.
Fig. 3
Fig. 3. Daam1-MIC removal increases calcium flux in glutamatergic neurons.
a Schematic representation of the neuronal differentiation protocol. DIV - day in vitro. b RT-PCR assays of Daam1-MIC inclusion during neuronal differentiation in representative WT and KO cell lines. RT-PCR assays were performed once. c, d Distributions of the lengths of the longest neurites (n = 491 WT, and 517 KO neurons, N = 2) (c) and individual filopodia (N = 3) (d) of neuronal precursors (DIV0 + 4 h). P-values from two-way ANOVA tests with replicate and genotype as factors. e Representative images of the calcium imaging experiment performed using FURA-2AM in mature neuronal cells (DIV21) depolarized with 30 mM KCl isotonic solution. Scale bar: 10 μm. f Distributions of calcium influx in WT and KO cell lines at various differentiation time points, based on FURA-2AM ratio. Neurons were stimulated with a 30 mM KCl isotonic solution. DIV1: n = 217 WT, and 228 KO neurons; DIV7: n = 188 WT, and 259 KO neurons; DIV14: n = 118 WT, and 134 KO neurons; DIV21: n = 116 WT, and 146 KO neurons. P-values from one-way ANOVA Tukey’s test. g Effects of the actin polymerization inhibitor Latrunculin A (LatA) and the small molecular inhibitor of formin FH2 domains (SMIFH2) on calcium currents in differentiated glutamatergic neurons at DIV14-21. The data corresponds to three independent experiments. Top: schematic representation of the mode of action of the actin-modulating drugs. h Distributions of calcium influx in WT and KO cell lines upon different treatments as depicted in (g), based on FURA-2AM ratio. Control: n = 234 WT, and 280 KO neurons; LatA: n = 124 WT, and 144 KO neurons; SMIFH2: n = 187 WT, and 187 KO neurons.
Fig. 4
Fig. 4. Daam1-MIC removal causes learning impairments by modulating the hippocampal LTP.
a Schematic representation of the Novel Object Recognition experiment. b Distribution of discrimination index (d2) quantified during discrimination phase. Each data point describes the performance of one animal. P-values from two-sided Wilcoxon rank-sum tests. c, d Schematic of the Morris Water Maze (MWM) protocol (c) and platform set-ups (d) (details in “Methods”). e Cumulative search error index during MWM for females (top) and males (bottom). P-values from two-way ANOVA tests with replicate and genotype as factors. Significant P-values for males: 0.003, 0.04, 0.005, 0.01 (Days 4−8). f Representative trajectories from one trial of Replicate 1. af Each test was performed twice, using six animals per sex and genotype (24 animals per replicate). g Maximum-intensity confocal image of a dye-filled neuron after deconvolution. Red box: dendritic region analyzed. h Field excitatory postsynaptic potentials (fEPSPs) were recorded in the CA1 dendritic layer in response to Schaffer collateral stimulation. LTP was induced by theta burst stimulation (TBS). LTP plot of fEPSP values in KO (red circles, n = 6, N = 5) compared to WT mice (blue circles, n = 5, N = 3) after TBS at 60 min. Insets of traces in the plots represent average fEPSPs during periods indicated (1 and 2). i Boxplot of LTP after TBS at 60 min. P-values from two-sided Welch’s t-tests. j 3D reconstructions of pre- (Synapsin1/2, green) and post- (PSD95, blue and pink) synaptic markers in PD22 CA1 hippocampal sections. Pink spots represent postsynapses at ≤0.5μm from the presynapses (functional synapses) and blue ones at >0.5μm. Scale bar: 1 μm. k Percentage of functional synapses. N = 7 WT, and 8 KO mice. P-values from two-sided Wilcoxon rank-sum tests. l Representative images of dendritic spines after deconvolution. Scale bar: 5 μm. m, n Number of total dendritic spines (m) and thin spines per μm (n). N = 5 WT, and 5 KO mice, 100 μm of dendrites per cell. One dot corresponds to one neuron analyzed. Lines represent the relation between the averaged values from the animals analyzed in experimental replicates. P-values from two-sided Wilcoxon rank-sum tests.
Fig. 5
Fig. 5. Loss of Daam1-MIC impairs RHOA/ROCK signaling cascade.
a Zoom-in of representative STORM images of actin (phalloidin-A647N) (white) overlaid with the conventional fluorescent image of PSD95 (green) of primary hippocampal cultures shown in Fig. S10a. Scale bar = 1 µm. b Quantification of the STORM localizations of F-actin in dendritic spines co-localizing with PDS95 signal, normalized per area. Each point represents a dendritic spine. Black lines connect the paired means of different biological replicates. P-values correspond to paired two-sided Mann-Whitney tests. c, d Interaction of DAAM1 with RHOA. c Co-immunoprecipitation experiment performed with anti-FLAG antibody. d Quantification of the interaction between DAAM1-ΔDAD constructs with ( + MIC) or without microexon (-MIC) and RHOA in panel (c) and S10e,f. N = 3 biological replicates (experiments). P-values from two-sided Wilcoxon rank-sum tests. e Confocal micrographs representing RhoA2G distribution (top) and RhoA activity (sensor ratio; bottom) in neurons. Boxes: example regions of interest. Scale bar: 50 μm. f Comparison of biosensor efficiency. One dot represents FRET efficiency in one neuron. WT: n = 59, KO: n = 57 neurons, N = 2 replicates. P-values from two-way ANOVA with replicate and genotype as factors. g Scatter plot showing changes in gene expression (log2 fold changes) between WT and KO cells in the control treatment (Veh) (X-axis) vs. KO control cells and KO cells treated with ROCK inhibitor (Y-axis). Each data point corresponds to a gene colored according to their “rescue” group: orange, rescued by ROCKi; red, not rescued; gray, other genes (see “Methods”). h Molecular Function GO term enrichment for genes with a rescue pattern (orange in (g)). i, j Calcium influx measurements upon ROCKi treatment. P-values from Kruskal–Wallis test. Control: n = 66 WT, and 51 KO neurons; ROCKi: n = 83 WT, and 88 KO neurons. k NOR experiment performed to test the effect of ROCKi. l Discrimination index values in the different conditions and for each genotype. P-values from two-sided Wilcoxon rank-sum tests. NOR test was performed twice, using six animals per treatment and genotype in each replicate. Replicates were separated by sex (24 animals per replicate).
Fig. 6
Fig. 6. Daam1-MIC impacts F-actin polymerization and the interplay with RHOA/ROCK signaling cascade.
Summary of the observed phenotypes upon Daam1-MIC removal and their relation to the RHOA/ROCK signaling cascade,,. DVL binds to DAAM1, releasing its autoinhibition, which is further facilitated by interaction with RHOA. Active DAAM1 leads to RHOA activation through an unknown mechanism involving DAAM1’s C-terminal part (dashed lined) and is not dependent on direct binding RHOA-DAAM1 interaction. Microexon removal decreases RHOA binding to DAAM1’s N-terminal region. This is proposed to lead to lower hydrolysis of RhoA-GTP, increasing the pool of active RHOA and in turn, hyperactivating the RHOA/ROCK signaling cascade. Arrows indicate the directionality of the event. The dotted arrow indicates a potential, unknown feedback loop from actin polymerization to ROCK pathway activation. GAP - GTPase-activating protein, GEF - guanine nucleotide exchange factor, GTP - Guanosine triphosphate, GDP - Guanosine diphosphate.

References

    1. Cingolani, L. A. & Goda, Y. Actin in action: the interplay between the actin cytoskeleton and synaptic efficacy. Nat. Rev. Neurosci.9, 344–356 (2008). - PubMed
    1. Dillon, C. & Goda, Y. THE ACTIN CYTOSKELETON: Integrating form and function at the synapse. Annu. Rev. Neurosci.28, 25–55 (2005). - PubMed
    1. Papandréou, M.-J. & Leterrier, C. The functional architecture of axonal actin. Mol. Cell. Neurosci.91, 151–159 (2018). - PubMed
    1. Lamprecht, R. Actin cytoskeleton role in the maintenance of neuronal morphology and long-term memory. Cells10, 1795 (2021). - PMC - PubMed
    1. McLeod, F. & Salinas, P. C. Wnt proteins as modulators of synaptic plasticity. Curr. Opin. Neurobiol.53, 90–95 (2018). - PMC - PubMed

LinkOut - more resources