. 2025 May 6;16(1):4194.
doi: 10.1038/s41467-025-59262-8.

Phylogenetic divergence of GABAB receptor signaling in neocortical networks over adult life

Affiliations

Phylogenetic divergence of GABAB receptor signaling in neocortical networks over adult life

Max A Wilson et al. Nat Commun. .

Abstract

Cortical circuit activity is controlled by GABA-mediated inhibition in a spatiotemporally restricted manner. GABAB receptor (GABABR) signalling exerts powerful slow inhibition that controls synaptic, dendritic and neuronal activity. But, how GABABRs contribute to circuit-level inhibition over the lifespan of rodents and humans is poorly understood. In this study, we quantitatively determined the functional contribution of GABABR signalling to pre- and postsynaptic domains in rat and human cortical principal cells. We find that postsynaptic GABABR differentially control pyramidal cell activity within the cortical column as a function of age in rodents, but minimally change over adult life in humans. Presynaptic GABABRs exert stronger inhibition in humans than rodents. Pre- and postsynaptic GABABRs contribute to co-ordination of local information processing in a layer- and species-dependent manner. Finally, we show that GABABR signalling is elevated in patients that have received the anti-seizure medication Levetiracetam. These data directly increase our knowledge of translationally relevant local circuit dynamics, with direct impact on understanding the role of GABABRs in the treatment of seizure disorders.


Conflict of interest statement

Competing interests: The authors declare no competing interests.

Figures
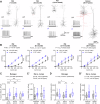
Fig. 1
Fig. 1. Age- and species-dependent changes in neuronal excitability.
A Example reconstructions of L2/3 and L5 neurons from rat and human neocortex. Inset, voltage response of example cells in response to −500 to +500 pA current injections (100 pA steps, 500 ms duration). B Current-voltage responses of L2/3 (black) and L5 (blue) neurons from 1-month-old (left; L2/3: 25 cells from 14 rats, L5: 25 cells from 13 rats), 6–8-month-old (middle left; L2/3: 35 cells from 20 rats, L5: 31 cells from 20 rats), and 12–14-month-old rats (middle right; L2/3: 13 cells from 5 rats, L5: 11 cells from 5 rats), and human neocortex (right; L2/3: 37 cells from 20 cases, L5: 16 cells from 9 cases). C The slope of the current-frequency (FI) plot between 0 and 500 pA from recorded neurons between layers and age of the same rats (L2/3 vs. L5: p = 2.6 × 10−9 (1-month), 2.55 × 10−9 (6–8 months), 0.599 (12–14 months), L2/3: P = 0.0004 (1 vs. 12–14 months), 0.0335 (1 vs. 6–8 months), 0.0191 (6–8 vs. 12–14 months); Tukey post hoc tests). C’ Comparison of FI slopes of L2/3 and L5 PCs in adult rats (6–14 months) and humans. D Membrane capacitance of recorded neurons in rats for the same age groups (L2/3 vs. L5: p = 0.0025 (1-month), 0.0006 (6–8-month), 0.0364 (12–14 months), L2/3: P = 0.0729 (1 vs. 12–14 months), 0.0029 (1 vs. 6–8 months), 0.834 (6–8 vs. 12–14 months); Tukey post hoc tests). D’ Comparison of membrane capacitance L2/3 and L5 PCs in adult rats (6–14 months) and humans. All data is shown as either mean ± SEM (B) or boxplots (25–75% range) with the median indicated and whiskers indicating maximum/minimum ranges (C and D). All data are overlain by responses of individual cells (circles). Statistical test results are shown above graphs from 2-way ANOVA (2-sided, B) and LMM models (C and D), with results from post-hoc 2-sided Tukey tests: *P < 0.05, **P < 0.01; ***P < 0.001.
Fig. 2
Fig. 2. Pharmacologically activated postsynaptic GABABR currents in rat and human neocortex.
A Whole-cell currents from L2/3 (black) and L5 (blue) PCs from 1-, 6–8-, 12–14-month-old rats, and human neocortex following bath-application of baclofen and CGP. Number of cells and baseline current (grey line) indicated. B Peak baclofen current from L2/3 and L5 in 1-month (L2/3: 10 cells/8 rats; L5: 11 cells/5 rats), 6–8-month (L2/3: 22 cells/13 rats; L5: 19 cells/13 rats), and 12–14-month-old (L2/3: 12 cells/5 rats; L5: 11 cells/5 rats) rats (L2/3 vs. L5: p = 7.0 × 10−6 (1-month), 0.317 (6–8-month), 0.105 (12–14-month). B’ Peak baclofen current of adult rats and humans (L2/3: 34 cells/19 cases; L5: 12 cells/8 cases). C Baclofen current-density for rat neurons (L2/3 vs. L5: p = 0.0002 (1-month), 0.282 (6–8-month), 0.762 (12–14-month). C’ Baclofen current density for adult rat and human neurons. D Scatter-plot of baclofen current density for rat L2/3 (black) and L5 (blue) and age (months) showing linear regression (solid lines) with 95% confidence intervals (dashed lines) and R2 and P-values (F-test). E Scatter-plot of baclofen current density from human L2/3 (black) and L5 (blue) plotted against age (years) in the same format. F Time-course plots of L2/3 (black) and L5 (blue) PCs from 1-month (L2/3: 8 cells/5 rats; L5: 6 cells/3 rats) and 6–8-month (L2/3: 8 cells/5 rats; L5: 7 cells/5 rats) following bath-application of CGP. G GABABR-mediated tonic-currents plotted for rat PCs. Data is shown as mean ± SEM (A, F), or boxplots (25–75% range) with median indicated and whiskers indicating maximum/minimum ranges (B, C, G) or individual data (filled circle) as a scatter-plot (D, E). Box-plots are overlain by responses of individual cells (open circles). Statistics shown from LMM (B, C, G) or Pearson correlation (D, E), with comparisons from 2-sided Tukey post-hoc tests: *P < 0.05, **P < 0.01; ***P < 0.001. Source data are provided as a Source Data file.
Fig. 3
Fig. 3. GABA release activates GABABRs with age-dependent differences.
A Immunofluorescence for GABAB1 (green) and NeuN (magenta) in rat and human neocortex, with layers (dashed lines) and depth (arrow). Scale = 100 μm. B GABAB1 intensity normalised to cortical depth for 1 (black, n = 5), 6–8 (grey, n = 3) and 12–14-month-old (grey, n = 3) rats, with SEM (dotted lines). C GABAB1 intensity for human (magenta, 6 patients) and adult rat (black, 6–14-months). D Schematic of IPSC recordings, with control and CGP from L2/3 (black) and L5 (blue). E IPSC amplitudes in 1 (L2/3: 19 cells/11 rats; L5: 17 cells/8 rats), 6–8 (L2/3: 22 cells/13 rats; L5: 17 cells/13 rats), and 12–14-month-old (L2/3: 12 cells/5 rats; L5: 11 cells/5 rats) rats. E’ IPSC amplitude for adult rats and humans (L2/3: 19 cells/13 cases; L5: 8 cells/5 cases). F IPSC 20–80% rise-time in 1-month (L2/3: 18 cells/10 rats; L5: 5 cells/5 rats), 6–8-month (L2/3: 15 cells/13 rats; L5: 7 cells/6 rats), and 12–14-month-old (L2/3: 11 cells/5 rats; L5: 3 cells/2 rats) rats. Rise-time could not be measured for all IPSCs. F’ 20–80% rise-time in adult rat and humans (L2/3: 14 cells/10 cases; L5: 6 cells/4 cases). G IPSC decay time-constant from 1 (L2/3: 18 cells/10 rats; L5: 6 cells/5 rats), 6–8 (L2/3: 15 cells/13 rats; L5: 7 cells/6 rats), and 12–14 (L2/3: 11 cells/5 rats; L5: 3 cells/2 rats) rats (L5: 1 vs. 12–14 months, p = 0.035, L5: 6–8 vs.12–14 months, p = 0.0013; 12–14-month: L2/3 vs. L5: P = 0.0048). G’ Decay time-constants of adult rat and human (L2/3: 17 cells/10 cases; L5: 5 cells/5 cases). H IPSC charge-transfer 1 (L2/3: 19 cells/11 rats; L5: 17 cells/8 rats), 6–8 (L2/3: 20 cells/13 rats; L5: 15 cells/13 rats), and 12–14-month-old (L2/3: 12 cells/5 rats; L5: 11 cells/5 rats) rats. H’ IPSC charge-transfer for adult rat and humans (L2/3: 22 cells/13 cases; L5: 8 cells/5 cases). Data shown as boxplots (25–75% range) with median indicated and whiskers indicating maxima/minima, showing individual points. Statistics from LMM with 2-sided Tukey post-hoc tests: *P < 0.05, **P < 0.01; ***P < 0.001. Source data are provided as a Source Data file.
Fig. 4
Fig. 4. Perisomatic GABABRs differentially inhibit AP discharge in L2/3 and L5 PCs over development.
A Schematic of experimental set-up depicting puff-application of 50 μM baclofen (red) to the perisomatic region during whole-cell recordings. IR-DIC image confirming somatic recording (record) and puff-pipette location in L5. B Baclofen puff-mediated currents recorded at −65 mV from L2/3 (black) and L5 PCs (blue), from 1- and 6–8-month-old rats, and humans. Baclofen puff (red arrow) and baseline (grey line) are shown for reference. C Action potential (AP) output of L2/3 (black, upper) and L5 (blue, lower) PCs from 1-month old rats held at +25 pA above rheobase following baclofen puff under control conditions (left) or in CGP (right). D AP firing during baclofen puff recordings for L2/3 (7 cells/4 rats) and L5 PCs (7 cells/4 rats), compared in the presence of CGP (grey or light blue). Right, AP discharge at 2–3 s after baclofen puff (U = 2, p = 0.0023). Number of cells is shown in parentheses. E, F The same analysis performed in 6–8-month-old rats (L2/3: 5 cells/4 rats; L5: 5 cells/4 rats; U = 10, p = 0.651). G, H The same analysis performed in human cortex (L2/3: 6 cells/5 cases; L5: 5 cells/5 cases; U = 9, p = 0.873). Data is shown as either mean ± SEM (left and middle panels) or boxplots (25–75% range) with median indicated and whiskers indicating maximum/minimum ranges with individual cell data overlain (right panels). Statistics are shown as ns P > 0.05, **P < 0.01, all from 2-sided Mann–Whitney tests. Source data are provided as a Source Data file.
Fig. 5
Fig. 5. Presynaptic GABABRs strongly inhibit synaptic inputs to human cortical PCs.
A Recording configuration for L2/3 PCs, showing stimulus (lightning) applied to L1 or L4. B EPSCs evoked by L1 stimulation in L2/3 PCs were recorded at −70 mV for control (Ctrl) and following application baclofen (Bacl.) and CGP, the latter underlain by control (grey). Time-course of EPSC amplitude following baclofen and CGP wash-in is shown below, with baseline indicated (grey dashed line). C Data in the same form, but for L4 inputs (light grey). D Baclofen-mediated inhibition of L1 (black) and L4 (grey) inputs to L2/3 PCs during the last minute of wash-in from 6–8-month-old rats (8 cells/4 rats) and humans (L1: 15 cells/7 cases; L4: 14 cells/7 cases). E Recording configuration for L5 PCs with stimulus applied to L1 or L5. F EPSCs evoked by L1 stimulation in L5 PCs under control (Ctrl), and following baclofen, and CGP, the latter underlain by control (blue traces). Time-course of EPSC amplitude following baclofen and CGP wash-in is shown below. G Data in the same form, but for L5 inputs (light blue). H Baclofen-mediated inhibition of L1 (blue) and L5 inputs (light blue) inputs to L5 PCs during the last minute of wash-in from 6–8-month-old rat (L1: 9 cells/4 rats; L5: 9 cells/4 rats) and human (L1: 10 cells/3 cases; L5: 10 cells/3 cases). I Human EPSC recordings from L1 stimulation in L2/3 PC following L1 stimulation, before (black) and after (red) CGP wash-in for 10 EPSCs have been amplitude scaled for brevity to clarify CGP effects. J Short-term plasticity (STP) of EPSCs, normalised to the first, at 10 Hz (6 cells/3 cases). K STP of EPSCs at 20 Hz (6 cells/3 cases). Data is shown as mean ± SEM (B, C, F, G, J, K) or boxplots (25–75% range) with the median indicated and whiskers indicating maximum/minimum ranges (D, H). All statistics are shown from either LMM (D, H) or 2-way repeated measures ANOVA (2-sided, J, K). Source data are provided as a Source Data file.
Fig. 6
Fig. 6. GABABR activation attenuates oscillatory activity in L2/3 and L5 of the human cortex.
A Local field potential (LFP) signals filtered into theta (θ), beta (β), low-gamma (Lo-γ), or high-gamma (Hi-γ) frequency ranges for L2/3 (black) and L5 (blue) during control (kainic acid and carbachol—KA+CCh) and during the last 2 min of 2 µM (light blue and grey) or 20 µM (lightest blue and grey) baclofen (Bacl.) application. B Power-spectra of L2/3 control (black; 8 slices/8 cases), 2 µM (grey; 5 slices/5 cases) or 20 µM (light grey; 8 slices/8 cases) baclofen recording, or following CGP (red; 3 slices/3 cases), or in L5 for control (blue; 8 slices/8 cases) 2 µM (light blue; 5 slices/5 cases) and 20 µM (lightest blue; 8 slices/8 cases) baclofen. C Area-under-curve (AUC) for KA+CCh recordings from L2/3 (black) and L5 (blue). D Effect on AUC (% change from KA+CCh) for frequency bands following 2 μM (dark grey, 5 slices/5 cases) and 20 μM (light grey; 8 slices/8 cases) baclofen. E The same data but for L5 (2 μM Bacl.; light blue, 5 slices/5 cases) and (20 μM Bacl.; lightest blue; 8 slices/8 cases). F CGP wash-in on AUC change for L2/3 (3 slices/3 cases) and L5 (2 slices/2 cases), not tested due to insufficient replicates. G Filtered LFP signals from L2/3 of 6–8-month-old rats in KA+CCh (dark green), 2 µM (mid green) or 20 µM (lightest green) baclofen. Right, power spectra of adult rat LFP recording for control (black; 6 slices/6 rats) and 2 μM (mid green; 5 slices/5 rats), or 20 μM baclofen (mid green; 6 slices/6 rats). H Comparison of AUC change following 2 μM (left) and 20 μM (right) baclofen for L2/3 of human (black) and rat (green) recordings. Data are shown as mean ± SEM (B, G), or boxplots (25–75% range) with the median indicated and whiskers indicating maximum/minimum ranges with individual data points overlain. Statistics are shown from 2-way ANOVA (2-sided, CE) or 3-way ANOVA (H). Source data are provided as a Source Data file.
Fig. 7
Fig. 7. GABABR activation de-synchronises beta/gamma coupling in human cortical circuits.
A Schematic of auto-correlation and cross-correlation analysis strategy. B Example plots of auto-correlation strength as a function of lag-time (ms) in LFP recordings from L2/3 (black) and L5 (blue) of the human cortex under control conditions (Kainic Acid, KA [0.6–2 µM] + Carbachol, CCh [60–200 µM]). C Example plots of cross-correlation strength between prominent oscillations in LFP recording from human L2/3 under control conditions (black) and following 2 µM (dark grey) or 20 µM (light grey) baclofen bath application. D Comparison of log-transformed correlation strength at zero lag (no time delay) between key oscillatory bands in L2/3 revealed significant frequency and baclofen effects. E Similar observations on cross-correlation strength were observed in human cortex L5 with respect to frequency and baclofen application. Data are shown as boxplots (25–75% range) with the median indicated and whiskers indicating maximum/minimum ranges; with individual values overlain. Statistical tests were performed with two-way ANOVA (two-sided). Source data are provided as a Source Data file.
Fig. 8
Fig. 8. Pre-surgical LEV leads to elevated GABABR signalling in L2/3 of the human neocortex.
A Responses of human L2/3 PCs to depolarising current (500 pA, 500 ms), from seizure-free patients (black), patients with seizures and received LEV (red, SZ&LEV), or patients not experiencing seizures, but receiving LEV (purple). B Currentfrequency responses (0–500 pA, 500 ms), from control (24 cells/15 cases), SZ&LEV (24 cells/11 cases), and LEV (13 cells/4 cases). C GABABR IPSCs evoked in L2/3 PCs from control (22 cells/13 cases), SZ&LEV (19 cells/10 cases), and LEV (8 cells/4 cases), superimposed response in CGP (light traces) and IPSC amplitudes for each patient group. D Whole-cell current following baclofen and CGP wash-in for control (27 cells/17 cases), SZ&LEV (18 cells/11 cases), and LEV (6 cells/4 cases) patients. E Baclofen current-density for control (34 cells/18 cases), SZ&LEV (23 cells/13 cases), and LEV (7 cells/4 cases) patients (Ctrl vs. SZ&LEV: p = 0.014; Ctrl vs. LEV-alone: p = 0.048; SZ&LEV vs. LEV-alone: p = 0.705; Tukey post hoc tests). F Baclofen current-density in slices pre-treated for 3 h with 100 μM LEV or vehicle, from control (Veh: 6 cells/4 cases; LEV: 8 cells/5 cases) and SZ&LEV patients (Veh: 7 cells/5 cases; LEV: 7 cells/4 cases). G Power spectra from L2/3 LFP recordings in KA+CCh from control (8 slices/8 cases), SZ&LEV (6 slices/6 cases), and LEV (4 slices/4 cases) patients. H Relative change in AUC from LEV-only patients compared to control following 2 μM (left) or 20 μM (right) baclofen wash-in. All data is shown as either mean ± SEM (B, D, G) or boxplots (25−75% range) with the median indicated and whiskers indicating maximum/minimum ranges (C, E, F, H) with individual values overlain. Statistics from LMM (C), 1-way ANOVA (E) with Holm–Sidak tests, 2-way (2-sided, B, F), or 3-way ANOVA (H).

References

    1. Mody, I. & Pearce, R. A. Diversity of inhibitory neurotransmission through GABAA receptors. Trends Neurosci.27, 569–575 (2004). - PubMed
    1. Princivalle, A., Duncan, J., Thom, M. & Bowery, N. GABAB1a, GABAB1b and GABAB2 mRNA variants expression in hippocampus resected from patients with temporal lobe epilepsy. Neuroscience122, 975–984 (2003). - PubMed
    1. Teichgräber, L. A. et al. Impaired function of GABAB receptors in tissues from pharmacoresistant epilepsy patients. Epilepsia50, 1697–1716 (2009). - PubMed
    1. Sheilabi, M. A. et al. Quantitative expression and localization of GABAB receptor protein subunits in hippocampi from patients with refractory temporal lobe epilepsy. Neuropharmacology136, 117–128 (2018). - PubMed
    1. Schuler, V. et al. Epilepsy, hyperalgesia, impaired memory, and loss of pre-and postsynaptic GABAB responses in mice lacking GABAB. Neuron31, 47–58 (2001). - PubMed

MeSH terms

LinkOut - more resources