. 2025 May 6;16(1):4205.
doi: 10.1038/s41467-025-59298-w.

Two-stage CD8+ CAR T-cell differentiation in patients with large B-cell lymphoma

Affiliations

Two-stage CD8+ CAR T-cell differentiation in patients with large B-cell lymphoma

Guoshuai Cao et al. Nat Commun. .

Abstract

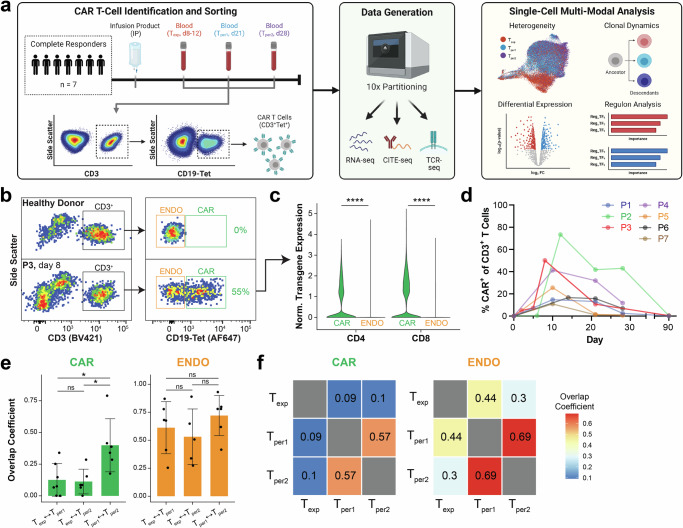
Advancements in chimeric antigen receptor (CAR) T-cell therapy for treating diffuse large B-cell lymphoma (DLBCL) have been limited by an incomplete understanding of CAR T-cell differentiation in patients. Here, we show via single-cell, multi-modal, and longitudinal analyses, that CD8+ CAR T cells from DLBCL patients successfully treated with axicabtagene ciloleucel undergo two distinct waves of clonal expansion in vivo. The first wave is dominated by an exhausted-like effector memory phenotype during peak expansion (day 8-14). The second wave is dominated by a terminal effector phenotype during the post-peak persistence period (day 21-28). Importantly, the two waves have distinct ontogeny from the infusion product and are biologically uncoupled. Precursors of the first wave exhibit more effector-like signatures, whereas precursors of the second wave exhibit more stem-like signatures. We demonstrate that CAR T-cell expansion and persistence are mediated by clonally, phenotypically, and ontogenically distinct CAR T-cell populations that serve complementary clinical purposes.


Conflict of interest statement

Competing interests: P.A.R. reports Research Support/Funding: BMS, Kite Pharma, Inc./Gilead, MorphoSys, Calibr, Tessa Therapeutics, Fate Therapeutics, Xencor, and Novartis Pharmaceuticals Corporation. Speaker’s Bureau: Kite Pharma, Inc./Gilead; Consultancy on advisory boards: AbbVie, Novartis Pharmaceuticals Corporation, BMS, Janssen, BeiGene, Karyopharm Therapeutics Inc., Takeda Pharmaceutical Company, Kite Pharma, Inc./Gilead, Sana Biotechnology, Nektar Therapeutics, Nurix Therapeutics, Intellia Therapeutics, and Bayer. Honoraria: Novartis Pharmaceuticals Corporation. M.R.B. reports Membership on an Advisory Board or Consultancy for Kite/Gilead, Novartis, CRISPR Therapeutics, Autolus Therapeutics, BMS, Incyte, Sana Biotechnology, Iovance Biotherapeutics. He has served on a Speakers Bureau for BMS, Kite/Gilead, Agios, and Incyte. J.P.K. receives research support from Merck, Verastem, and iTeos; has served on a speaker’s bureau for Kite/Gilead; and has served on advisory boards for Verastem, Seattle Genetics, MorphoSys, and Karyopharm. The remaining authors declare no competing interests.

Figures

Fig. 1
Fig. 1. CD8+ CAR T cells from complete responders undergo a clonotypic shift in vivo.
a Schematic depicting sorting strategy, data generation, and single-cell multi-modal analysis of CAR T cells in peripheral blood from seven CAR T-cell therapy patients (P1-7) who exhibited complete responses with axicabtagene ciloleucel. Created in BioRender. Hu, Y. (2025) https://BioRender.com/hqo12oz. b Representative flow plots depicting anti-CD3 and CD19 antigen-tetramer staining of peripheral blood mononuclear cells from P3 versus a healthy donor. CD3+Tet+ (“CAR”) and CD3+Tet (“ENDO”) patient cells were sorted from the indicated gates. c Violin plots depicting normalized CAR transgene mRNA expression of sorted CAR and ENDO T cells, split by CD4+ (left) and CD8+ (right) subsets. Expression levels were compared by two-sided Wilcoxon Rank-Sum test with Bonferroni correction, whereby **** indicates p < 0.0001. d Line plots depicting expansion and contraction of peripheral blood CAR abundance over the course of therapy. e, f Bar graphs and heatmaps depicting overlap coefficients for TCR clonotypes comparing CAR (left) and ENDO (right) repertoires between Texp, Tper1, and Tper2. Overlap coefficients were compared by two-sided t test, whereby * indicates p < 0.05 and ns indicates not significant. Each dot represents a measurement from a single patient (n = 7). Data are presented as mean values ± SEM. Exp expansion stage, Per persistence stage. Source data are provided as a Source Data file.
Fig. 2
Fig. 2. Phenotypic heterogeneity of peripheral blood CD8+ and CD4+ CAR T cells.
UMAPs depicting single-cell transcriptomes of CD8+ (a) and CD4+ (e) CAR T cells colored by cell cluster. Inset depicts distribution of transcriptomes across timepoints. Violin plots depicting normalized expression levels of key genes and proteins for annotating and phenotyping CD8+ (b) and CD4+ (f) CAR T cells. For extended versions, see Fig. S5a and S6a. Stacked bar graphs depicting proportions of each CD8+ (c) and CD4+ (g) CAR T-cell phenotype at different timepoints. Boxplots depicting proportion of CD8+ (d) and CD4+ (h) CAR T cells of a given phenotype at different timepoints. Each dot represents a measurement from a single patient (n = 7). The central line indicates the median. The bounds of the box indicate the 25th–75th percentile. The length of the whiskers indicates 1.5 times the inter-quartile range from the first and third quartiles. Proportions are compared between timepoints by two-sided t test, whereby *** indicates p < 0.001, ** indicates p < 0.01, * indicates p < 0.05, and ns indicates not significant. CM central memory, EM effector memory, TE terminal effector, Mem memory, ISG interferon stimulated genes, Th1 type 1 helper-like. Source data are provided as a Source Data file.
Fig. 3
Fig. 3. Integration of clonotypic and phenotypic shifts supports a two-stage differentiation model.
All figure panels are based on the clonotype-phenotype linked dataset (n = 32432 cells). a Proportion of CAR T cells with an exhausted-like effector memory (EM-exh), terminal effector (TE), or other phenotypes at each timepoint. b Total abundance of all clones that were predominantly EM-exh at Texp (left), TE at Tper1 (middle), or TE at Tper2 (right), measured across timepoints. A clone’s predominant phenotype was defined as the phenotype with the greatest representation. Each point represents clones from a patient (n = 6). Abundance across timepoints were compared by repeated measures ANOVA with paired two-sided post hoc t tests, whereby **** indicates p < 0.0001, *** indicates p < 0.001, ** indicates p < 0.01, * indicates p < 0.05, and ns indicates not significant. c Overlay of clonal abundance dynamics with 95% confidence intervals for clones annotated as EM-exh from Texp (red) or TE from Tper1/Tper2 (blue). d Pie chart depicting proportion of the top 500 clones classified as Wave 1, Wave 2, or Other. e Heatmap depicting normalized CAR abundance across timepoints for the top 500 largest clones. f Clonal dynamics and phenotypic distribution for the top 500 clones, grouped into Wave 1 and Wave 2. Left panels depict the change in clonal abundance across timepoints, while right panels show the predominant phenotype distribution at each timepoint. g Cartoon summarizing the two-stage model for CAR T-cell differentiation. Bulk CAR T-cell expansion and contraction (black line) masks the dynamics of Wave 1 (EM-exh, expansion phase timeframe, red) and Wave 2 (TE, persistence phase timeframe, blue) clones. Created in BioRender. Hu, Y. (2025) https://BioRender.com/rwp4v6g. Source data are provided as a Source Data file.
Fig. 4
Fig. 4. Transcriptional signatures and regulatory networks of CD8+ CAR T cells at Texp and Tper.
a Heatmap depicting correlation between pseudo-bulk transcriptome of each sample (patient by timepoint). Samples were ordered along columns and rows by hierarchical clustering. Transcriptomes of day 7 samples from Maus et al. were added for external validation. b Stacked bar graph depicting label transfer of timepoint (Texp or Tper) from this study’s dataset onto single-cell transcriptomes of samples from Maus et al. c Gene set enrichment analysis comparing CAR T cells between Texp and Tper. Gene sets were ordered by direction of upregulation and magnitude of enrichment. d Tile map depicting normalized expression of genes (columns) among different cell clusters at Texp and Tper (rows). Genes were manually grouped into modules according to known functions. e Schematic for regulon construction and Texp versus Tper classification. After transcriptomes were transformed into regulomes, regulon scores were calculated to train a machine-learning model to classify CAR T cells from Texp and Tper. Key regulons were identified based on importance for the model’s predictions. Created in BioRender. Hu, Y. (2025) https://BioRender.com/3ltrr3g. f Bar graph depicting the SHapley Additive exPlanation (SHAP) values for the top eight regulons underlying Texp and Tper predictions. g Tile map depicting normalized signature scores of regulons (columns) among different cell clusters at Texp and Tper (rows). Regulons were grouped as Texp-determining (left) and Tper-determining (right). Target networks for the top eight Texp-determining (h) and Tper-determining regulons (i). In each regulatory network, only the top differentially expressed genes are depicted. Each gene is colored according to log2 fold-change between expression in Texp (red) and Tper (blue). Source data are provided as a Source Data file.
Fig. 5
Fig. 5. Infusion product precursors of peripheral blood CD8+ CAR T cells.
a UMAP depicting single-cell transcriptomes of infusion product CD8+ T cells colored by cell cluster. Density maps (b) and violin plots (c) depicting expression levels of key genes and proteins for annotation and phenotyping. For extended version, see Fig. S11a, b. d Cartoon depicting identification of Pre-Texp and Pre-Tper using endogenous TCR clonotypes as unique indices. Created in BioRender. Hu, Y. (2025) https://BioRender.com/49klewt. e Stacked bar graph depicting proportion distribution of all infusion product (top row) or precursors of peripheral blood CD8+ CAR T cells (bottom two rows) among the four cell clusters. f Colored UMAPs depicting distribution of Pre-Texp, Pre-Tper, and non-linked infusion product cells (“IP only”) on the overall UMAP. g Tile map depicting normalized expression of genes (columns) among Pre-Texp, Pre-Tper, and IP only infusion product cells (rows). Genes were manually grouped into modules according to known functions. h Violin plots depicting expression levels of select differentially expressed gene sets between Pre-Texp (n = 1813 cells), Pre-Tper (n = 2502 cells), and IP only (n = 8464 cells) infusion product cells. Expression levels were compared by two-sided Wilcoxon Rank-Sum test with p values adjusted for multiple hypotheses testing using the Benjamini-Hochberg method, whereby **** indicates p < 0.0001 and ** indicates p < 0.01. The central line indicates the median. The bounds of the box indicate the 25th–75th percentile. The length of the whiskers indicates 1.5 times the inter-quartile range from the first and third quartiles. i Gene set enrichment analysis comparing Pre-Texp and Pre-Tper. Gene sets were ordered according to direction of upregulation and magnitude of enrichment. j Enrichment plots for select gene sets differentially expressed between Pre-Texp and Pre-Tper infusion product cells. Enrichment scores are computed by the Kolmogorov-Smirnov test with false discovery rate (FDR) adjusted q-values. k Cartoon depicting fates of CD8+ CAR T cells over the entire course of therapy, from infusion product precursors to peripheral blood CAR T cells at Texp and Tper. Created in BioRender. Hu, Y. (2025) https://BioRender.com/3dtq7c4. NES normalized enrichment score. Source data are provided as a Source Data file.
Fig. 6
Fig. 6. Transcriptomic signatures of exhausted-like EM CD8+ CAR T cells.
UMAP depicting single-cell transcriptomes of peripheral blood CD8+ T cells colored by cell cluster (a) or density contours of each cluster (b). The exhausted-like EM cluster is located on the lower half of the UMAP. c Density maps depicting expression levels of major T-cell genes and proteins, divided into categories. In the “receptor” category, proteins are placed directly beneath the corresponding gene. d Flow plots for validating transcriptomic data. Plots depict expression of CD39 and CD57 (top row) or CX3CR1 (bottom row) in CD8+ CAR T cells at each timepoint from P2. Exhausted-like EM CAR T cells were expected to be Texp-specific with high CD39 and low CD57/CX3CR1 expression. e, f Heat map depicting normalized expression of major gene sets from Wherry et al. (e). Expression of two of the gene sets were depicted as violin plots (f), ordered by decreasing expression level per cluster (EM, exh-like: n = 7163 cells; CM: n = 1883 cells, EM: n = 4937 cells; TE, exh-like: n = 552 cells; TE: n = 21019 cells). The central line indicates the median. The bounds of the box indicate the 25th–75th percentile. The length of the whiskers indicates 1.5 times the inter-quartile range from the first and third quartiles. Expression levels were compared to that of the cluster with highest expression via two-sided Wilcoxon Rank-Sum test, with p values adjusted for multiple hypotheses testing using the Benjamini-Hochberg method, whereby **** indicates p < 0.0001, *** indicates p < 0.001. g Volcano plot depicting differentially expressed genes found via two-sided Wilcoxon Rank-Sum test with Bonferroni adjustment between EM and exhausted-like EM CD8+ CAR T cells. Genes were colored according to direction of upregulation. h Enrichment plots for select gene sets differentially expressed between EM and exhausted-like EM CD8+ CAR T cells. Enrichment scores are computed by the Kolmogorov-Smirnov test with false discovery rate (FDR) adjusted q-values. Source data are provided as a Source Data file.

Update of

References

    1. Diffuse Large B-Cell Lymphoma - Cancer Stat Facts. https://seer.cancer.gov/statfacts/html/dlbcl.html
    1. Liu, Y. & Barta, S. K. Diffuse large B‐cell lymphoma: 2019 update on diagnosis, risk stratification, and treatment. Am. J. Hematol.94, 604–616 (2019). - PubMed
    1. Longo, D. L., Sehn, L. H. & Salles, G. Diffuse large B-cell lymphoma. https://doi-org.proxy.uchicago.edu/10.1056/NEJMra2027612, 384, 842–858 (2021). - DOI - PMC - PubMed
    1. June, C. H., O’Connor, R. S., Kawalekar, O. U., Ghassemi, S. & Milone, M. C. CAR T cell immunotherapy for human cancer. Science359, 1361–1365 (2018). - PubMed
    1. Neelapu, S. S. et al. Axicabtagene ciloleucel CAR T-cell therapy in refractory large B-cell lymphoma. N. Engl. J. Med.377, 2531–2544 (2017). - PMC - PubMed

MeSH terms

LinkOut - more resources