Lifespan reference curves for harmonizing multi-site regional brain white matter metrics from diffusion MRI
- PMID: 40328780
- PMCID: PMC12056076
- DOI: 10.1038/s41597-025-05028-2
Lifespan reference curves for harmonizing multi-site regional brain white matter metrics from diffusion MRI
Abstract
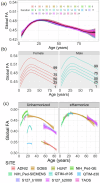
Age-related white matter (WM) microstructure maturation and decline occur throughout the human lifespan, complementing the process of gray matter development and degeneration. Here, we create normative lifespan reference curves for global and regional WM microstructure by harmonizing diffusion MRI (dMRI)-derived data from ten public datasets (N = 40,898 subjects; age: 3-95 years; 47.6% male). We tested three harmonization methods on regional diffusion tensor imaging (DTI) based fractional anisotropy (FA), a metric of WM microstructure, extracted using the ENIGMA-DTI pipeline. ComBat-GAM harmonization provided multi-study trajectories most consistent with known WM maturation peaks. Lifespan FA reference curves were validated with test-retest data and used to assess the effect of the ApoE4 risk factor for dementia in WM across the lifespan. We found significant associations between ApoE4 and FA in WM regions associated with neurodegenerative disease even in healthy individuals across the lifespan, with regional age-by-genotype interactions. Our lifespan reference curves and tools to harmonize new dMRI data to the curves are publicly available as eHarmonize ( https://github.com/ahzhu/eharmonize ).
© 2025. The Author(s).
Conflict of interest statement
Competing interests: The authors declare no competing interests.
Figures


Update of
-
Lifespan reference curves for harmonizing multi-site regional brain white matter metrics from diffusion MRI.bioRxiv [Preprint]. 2024 Mar 1:2024.02.22.581646. doi: 10.1101/2024.02.22.581646. bioRxiv. 2024. Update in: Sci Data. 2025 May 6;12(1):748. doi: 10.1038/s41597-025-05028-2. PMID: 38463962 Free PMC article. Updated. Preprint.
References
MeSH terms
Substances
Grants and funding
- U01 DA051039/DA/NIDA NIH HHS/United States
- R01AA016274/U.S. Department of Health & Human Services | National Institutes of Health (NIH)
- P30 AG059305/AG/NIA NIH HHS/United States
- U01 DA041148/DA/NIDA NIH HHS/United States
- WT_/Wellcome Trust/United Kingdom
- P41EB015922/U.S. Department of Health & Human Services | National Institutes of Health (NIH)
- UL1 TR002345/TR/NCATS NIH HHS/United States
- R01 AA016274/AA/NIAAA NIH HHS/United States
- R01 AG058854/AG/NIA NIH HHS/United States
- P30 AG066444/AG/NIA NIH HHS/United States
- P41 EB015922/EB/NIBIB NIH HHS/United States
- U24 DA041147/DA/NIDA NIH HHS/United States
- R01 AG043434/AG/NIA NIH HHS/United States
- U01 DA041120/DA/NIDA NIH HHS/United States
- RF1AG057892/U.S. Department of Health & Human Services | National Institutes of Health (NIH)
- U19 AG076581/AG/NIA NIH HHS/United States
- R01AG078423/U.S. Department of Health & Human Services | National Institutes of Health (NIH)
- U01 DA051018/DA/NIDA NIH HHS/United States
- R01 EB015611/EB/NIBIB NIH HHS/United States
- U01 DA041093/DA/NIDA NIH HHS/United States
- U01 MH109589/MH/NIMH NIH HHS/United States
- U01 AG024904/AG/NIA NIH HHS/United States
- RF1 NS136995/NS/NINDS NIH HHS/United States
- MH078111/U.S. Department of Health & Human Services | NIH | National Institute of Mental Health (NIMH)
- R01 AG078423/AG/NIA NIH HHS/United States
- U54HG013247/U.S. Department of Health & Human Services | National Institutes of Health (NIH)
- U24 DA041123/DA/NIDA NIH HHS/United States
- P01 AG003991/AG/NIA NIH HHS/United States
- U01 DA051038/DA/NIDA NIH HHS/United States
- P01 AG026276/AG/NIA NIH HHS/United States
- U01 DA041134/DA/NIDA NIH HHS/United States
- R01 MH116147/MH/NIMH NIH HHS/United States
- U01 DA041022/DA/NIDA NIH HHS/United States
- R01 MH078111/MH/NIMH NIH HHS/United States
- R01MH116147/U.S. Department of Health & Human Services | National Institutes of Health (NIH)
- R01AG058464/U.S. Department of Health & Human Services | National Institutes of Health (NIH)
- N01 HD023343/HD/NICHD NIH HHS/United States
- P30AG059305/U.S. Department of Health & Human Services | National Institutes of Health (NIH)
- U01 DA041156/DA/NIDA NIH HHS/United States
- U01 DA050987/DA/NIDA NIH HHS/United States
- U19AG076581/U.S. Department of Health & Human Services | National Institutes of Health (NIH)
- R01 EB009352/EB/NIBIB NIH HHS/United States
- U01 DA051037/DA/NIDA NIH HHS/United States
- U01 DA051016/DA/NIDA NIH HHS/United States
- R01 HD050735/HD/NICHD NIH HHS/United States
- U01 DA041025/DA/NIDA NIH HHS/United States
- U01 DA050989/DA/NIDA NIH HHS/United States
- U54 MH091657/MH/NIMH NIH HHS/United States
- U01 DA041089/DA/NIDA NIH HHS/United States
- RF1 MH123163/MH/NIMH NIH HHS/United States
- U01 DA050988/DA/NIDA NIH HHS/United States
- MH083824/U.S. Department of Health & Human Services | NIH | National Institute of Mental Health (NIMH)
- U01 DA041106/DA/NIDA NIH HHS/United States
- Zenith/Alzheimer's Association
- RF1 AG057892/AG/NIA NIH HHS/United States
- UL1 TR000448/TR/NCATS NIH HHS/United States
- 496682/Department of Health | National Health and Medical Research Council (NHMRC)
- U01 DA041117/DA/NIDA NIH HHS/United States
- 1009064/Department of Health | National Health and Medical Research Council (NHMRC)
- U54 HG013247/HG/NHGRI NIH HHS/United States
- U01 DA041028/DA/NIDA NIH HHS/United States
- U01 DA041048/DA/NIDA NIH HHS/United States
- R01MH134004/U.S. Department of Health & Human Services | National Institutes of Health (NIH)
- MH0708143/U.S. Department of Health & Human Services | NIH | National Institute of Mental Health (NIMH)
- R01 AG087513/AG/NIA NIH HHS/United States
- R01 AG058464/AG/NIA NIH HHS/United States
- R01 MH134004/MH/NIMH NIH HHS/United States
- R01 MH083824/MH/NIMH NIH HHS/United States
- U01 DA041174/DA/NIDA NIH HHS/United States
- R01AG058854/U.S. Department of Health & Human Services | National Institutes of Health (NIH)
- RC2 DA029475/DA/NIDA NIH HHS/United States
- R01 AG059874/AG/NIA NIH HHS/United States
LinkOut - more resources
Full Text Sources
Miscellaneous

