. 2025 May 6;15(1):15814.
doi: 10.1038/s41598-025-96135-y.

Mapping the anatomical and transcriptional landscape of early human fetal ovary development

Affiliations

Mapping the anatomical and transcriptional landscape of early human fetal ovary development

Sinead M McGlacken-Byrne et al. Sci Rep. .

Abstract

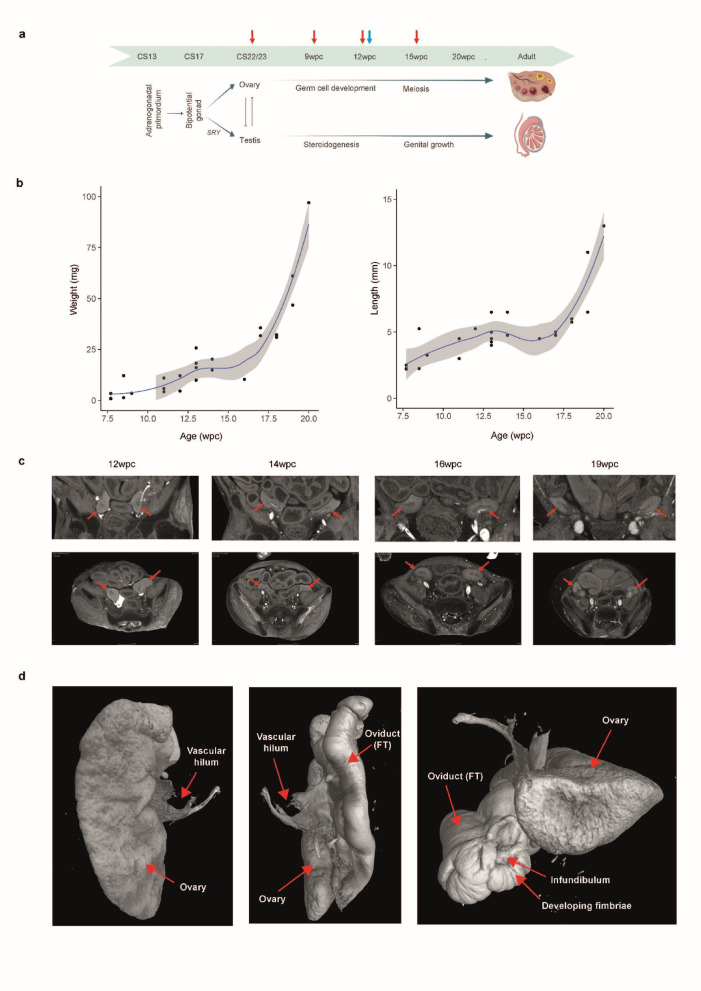
The complex genetic mechanisms underlying human ovary development can give rise to clinical phenotypes if disrupted, such as Primary (or Premature) Ovarian Insufficiency and Differences of Sex Development. We combine single-nuclei RNA sequencing, bulk RNA sequencing, and micro-focus computed tomography to elucidate the anatomy and transcriptional landscape of the human fetal ovary across key developmental timepoints (Carnegie Stage 22 until 20 weeks post conception). We show the marked growth and distinct morphological changes within the fetal ovary at the critical timepoint of germ cell expansion and demonstrate that the fetal ovary becomes more transcriptomically distinct from the testis with age. We describe previously uncharacterised ovary developmental pathways, relating to neuroendocrine signalling, energy homeostasis, mitochondrial networks, and inflammasome regulation. We define transcriptional regulators and candidate genes for meiosis within the developing ovary. Together, this work advances our fundamental understanding of human ovary development and has relevance for human ovarian insufficiency phenotypes.

Keywords: Micro-focus computed tomography; Ovarian insufficiency; Ovary development; Ovary function; Transcriptomics.


Conflict of interest statement

Declarations. Competing interests: The authors declare no competing interests.

Figures

Fig. 1
Fig. 1
Human fetal ovary growth and morphology during development. (a) Graphic depicting the antagonistic differentiation pathways of gonads arising from the adrenogonadal primordium at approximately CS17 and resulting in the formation of the fetal ovary or testis. Red arrows indicate experimental stages for the bulk RNA sequencing study; blue arrows indicate stages included for the single-cell RNA sequencing study; green arrows indicate microCT imaging. CS, Carnegie stage; wpc, weeks post conception. (b) Growth curves of the ovary between CS22 and 20wpc (left panel: weight (mg); right panel: length (mm)). Data for single glands (n = 27) are shown. (c) Micro-CT of the fetal ovary in situ at 12wpc, 14wpc, 16wpc, and 19wpc demonstrating growth and anterolateral migration of the ovary over time. Ovaries are indicated with red arrows. Upper panels show coronal views and lower panels show axial views. (d) Micro-CT images of a fetal ovary and associated Fallopian tube (FT) structures at 20wpc.
Fig. 2
Fig. 2
Transcriptome analysis during human fetal ovary development. (a) Principal component analysis of all 47 tissue samples included in this study (19 ovaries, 20 testes, 8 controls). The plot shows individual samples positioned according to the first and second principal components. RNA was extracted from each individual sample and RNA sequencing undertaken without pooling. Individual samples were grouped together as described for bioinformatic analysis. CS, Carnegie stage; PC, principal component; wpc, weeks post conception. (b) Overlay between three differential gene expression analyses: ovary v control (data from all stages combined); testis v control (data from all stages combined); ovary v testis (data from all stages combined)(log2FC > 2, p.adj < 0.05). The total numbers of positively differentially-expressed genes (DEGs) are shown above the Venn diagrams. Total numbers and names of the top ten genes within the ovary-specific (red), testis-specific (green), gonad-specific (violet), and highly ovary-specific (pink) DEGsets are shown within the Venn diagram. “Highly ovary-specific” refers to DEGset in both the ovary v control and ovary v testes datasets. The top ten differentially expressed genes within the gonad-specific and highly ovary-specific genesets are shown in boxes. (c) Volcano plots demonstrating four differential gene expression analyses comparing ovary v testis samples at CS22/23 (both n = 5), 9/10wpc (both n = 5), 11/12wpc (both n = 5), 15/16wpc (ovary n = 4, testis n = 5). Each dot represents a single gene. Genes that were differentially expressed with a log2FC > 2 and p.adj < 0.05 are coloured cyan; those coloured red did not meet these significance thresholds. A max value of log10(p.adj) is displayed on the y-axis of the graph. Total numbers of positively and negatively DEGs are shown in violet. Gene names of the top ten positively and negatively DEGs across each developmental timepoint are displayed, based on log2FC. (d) Heatmap showing normalized gene expression values for the top 30 differentially expressed highly ovary-specific genes identified in (b) across the entire count matrix. Genes are ordered according to descending log2FC values. Samples are ordered according to tissue and stage (supervised). A color scale represents gene expression intensity (violet, lowest; yellow, neutral; red, highest). A p.adj value of < 0.05 was used throughout this analysis.
Fig. 3
Fig. 3
snRNA-seq of two 46,XX human fetal ovaries. (a) UMAP (uniform manifold approximation and projection) of cell lineages across the merged dataset, which represents 10,291 cells from two 46,XX ovaries. Individual cell populations are annotated. FGC, fetal germ cells; OSE, ovarian surface epithelium; PGC, primordial germ cells. Markers were based on prior knowledge, markers identified in this study (e.g., GABRG1), and on previously published markers (Garcia-Alonso et al., Nature, 2022). (b) Upper panel: Dot plot showing the relative average expression and percentage of cells expressing germ cell markers used for snRNA-seq analysis of the developing ovary. Lower panel: Dot plot showing the relative average expression and percentage of cells expressing somatic cell markers. FGC, fetal germ cells; OSE, ovarian surface epithelium; PGC, primordial germ cells. (c) Violin plots showing key differentially expressed genes in the fetal ovary localized to the merged 11/12wpc 46,XX snRNA-seq dataset (left panel; see Fig. 3a for cluster annotation) and to the bulk RNAseq data at four developmental stages. (d) Dot plot demonstrating expression within different single-cell populations of potentially upregulated novel ovary genes, some of which are related to metabolic function or cell proliferation. e Dot plot demonstrating expression within different single-cell populations of key MAGE family genes.
Fig. 4
Fig. 4
Ovary-, testis-, and gonad-specific transcription factors in early development. (a) Relative proportions of differentially expressed transcription factors (TFs) in the ovary from the most represented TF families are shown across four developmental stages (log2FC > 2, p.adj < 0.05). bHLH, Basic Helix-Loop-Helix; DEGs, differentially expressed genes; HMG, high mobility group; TF, transcription factor; zf-C2H2, Cys2–His2 zinc finger. (b) Heatmap showing top ten differentially expressed TFs at the 15/16wpc peri-meiosis stage (log2FC > 2, p.adj < 0.05). (c) Heatmap showing expression of the top 15 ovary-specific TFs across the dataset (differentially expressed in both ovary v testis and ovary v control differential gene expression analyses). (d) Venn diagram demonstrating overlap between four differential gene expression analyses (log2FC > 2, p.adj < 0.05; ovary v testis, ovary v control, testis v control, and testis v ovary) in order to identify ovary-, gonad-, and testis-specific TFs. All TFs are shown where possible, or else the total number (n) and a subset of most highly expressed in that category. (e) Gene enrichment analysis (Metascape) of ovary-specific TFs. (f) Dot plot localizing the expression of key TFs of interest to individual cell clusters on snRNA-seq analysis.
Fig. 5
Fig. 5
Nuclear receptor expression in the developing human fetal ovary. (a) Venn diagram showing overlapping differential gene expression analyses of nuclear receptors (NRs): ovary v control, ovary v testis, testis v control, testis v ovary (log2FC > 0.5, p.adj < 0.05). Ovary-, testis-, and gonad-specific NRs are identified. (b) Heatmap showing differentially expressed NRs across the geneset (log2FC > 0.5, p.adj < 0.05). (c) Selected highly expressed NRs localized to UMAPs from snRNA-seq data (upper panels) and as violin plots over time in the bulk RNAseq data (lower panels). See Fig. 3 for cluster annotation.
Fig. 6
Fig. 6
The fetal ovary is enriched for neuroendocrine and neurotransmitter genes. (a) Violin plots demonstrating the increased expression of selected neuroactive genes in the ovary at four developmental timepoints. Green, ovary; orange, testis. (b) UMAP representation of 46,XX ovary snRNA-seq data. Expression of NAV3 and GABRA2 localizes to the ovarian surface epithelial (OSE) cell cluster and to interstitial cell populations. See Fig. 3b for cluster annotation. (c) Gene enrichment analysis (Metascape) of differentially expressed genes (log2FC > 2, padj < 0.05) in the 9/10wpc ovary demonstrating an enrichment of terms relating to neuroendocrine and neurotransmitter signalling. (d) Dot plot demonstrating expression of selected neuroactive genes within individual cell clusters in snRNA-seq analysis. FGCs, fetal germ cells; OSE, ovarian surface epithelium; PGCs, primordial germ cells.
Fig. 7
Fig. 7
Identifying novel meiosis candidate genes. (a) Gene enrichment analysis (Metascape) of differentially expressed genes (log2FC > 2, p.adj < 0.05) at 15/16wpc, confirming an enrichment of genes related to meiosis and germ cell competence. (b) Venn diagram overlapping the PanelApp geneset; differentially expressed PanelApp genes in the ovary v testis (log2FC > 2, p.adj < 0.05); and meiosis-annotated genes on enrichment analysis of genes differentially expressed in the 15/16wpc ovary v 15/16wpc testis and 15/16wpc ovary v ovary CS22/23. (c) Genes differentially expressed in the 15/16wpc ovary v 15/16wpc testis and 15/16wpc ovary v ovary CS22/23 which were not annotated on enrichment analysis as meiosis genes were identified (n = 622) and overlapped with markers of the oogonia cluster (n = 33) to extract potentially novel candidate meiosis genes. (d) Dot plot showing expression of 33 potentially novel meiosis candidate genes across cell clusters.

References

    1. Svingen, T. & Koopman, P. Building the mammalian testis: origins, differentiation, and assembly of the component cell populations. Genes Dev.27, 2409–2426 (2013). - PMC - PubMed
    1. Sekido, R. & Lovell-Badge, R. Sex determination involves synergistic action of SRY and SF1 on a specific Sox9 enhancer. Nature453, 930–934 (2008). - PubMed
    1. Yao, H. H. C. The pathway to femaleness: current knowledge on embryonic development of the ovary. Mol. Cell. Endocrinol.230, 87–93 (2005). - PMC - PubMed
    1. Chassot, A. A. et al. Activation of β-catenin signaling by Rspo1 controls differentiation of the mammalian ovary. Hum. Mol. Genet.17, 1264–1277 (2008). - PubMed
    1. Tomizuka, K. et al. R-spondin1 plays an essential role in ovarian development through positively regulating Wnt-4 signaling. Hum. Mol. Genet.17, 1278–1291 (2008). - PubMed

LinkOut - more resources