. 2025 May 6;8(1):703.
doi: 10.1038/s42003-025-08142-4.

Functional role of cell classes in monkey prefrontal cortex after learning a working memory task

Affiliations

Functional role of cell classes in monkey prefrontal cortex after learning a working memory task

Amirreza Asadi et al. Commun Biol. .

Abstract

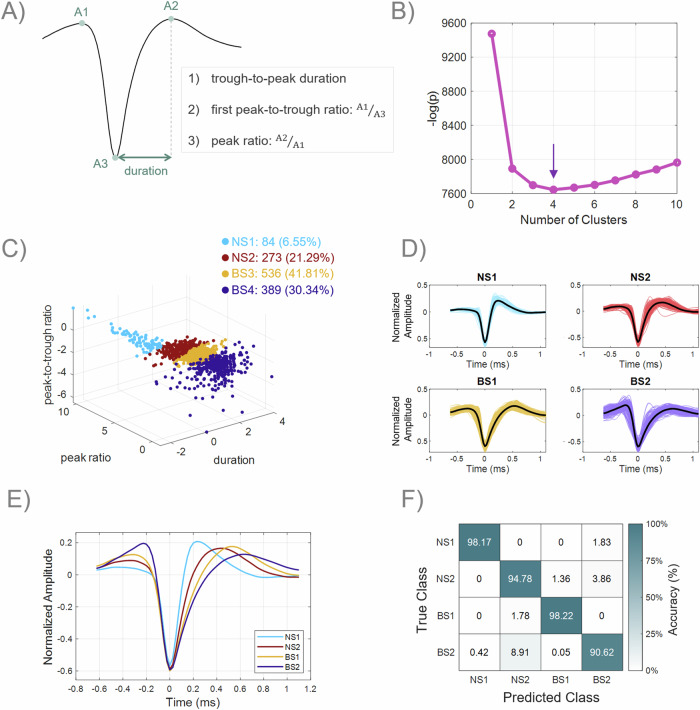
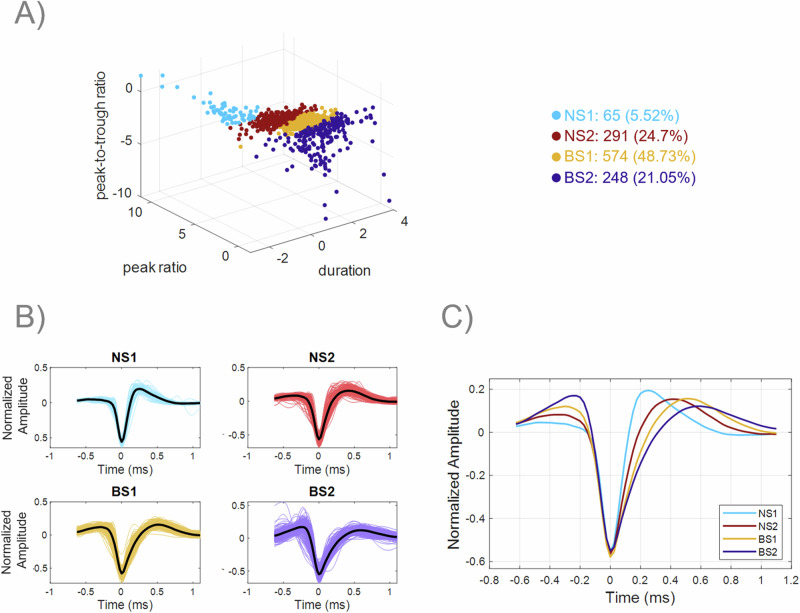
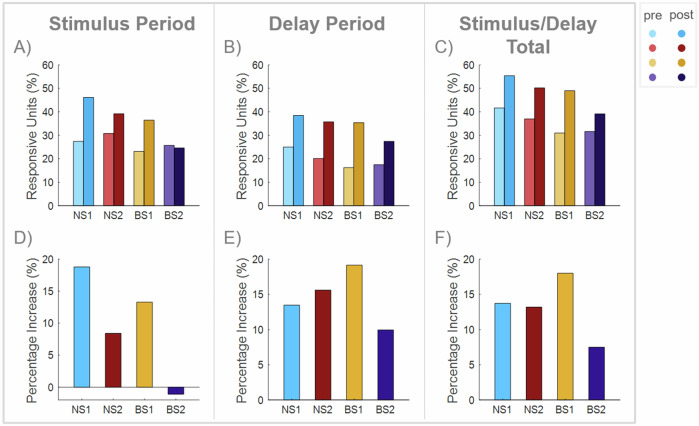
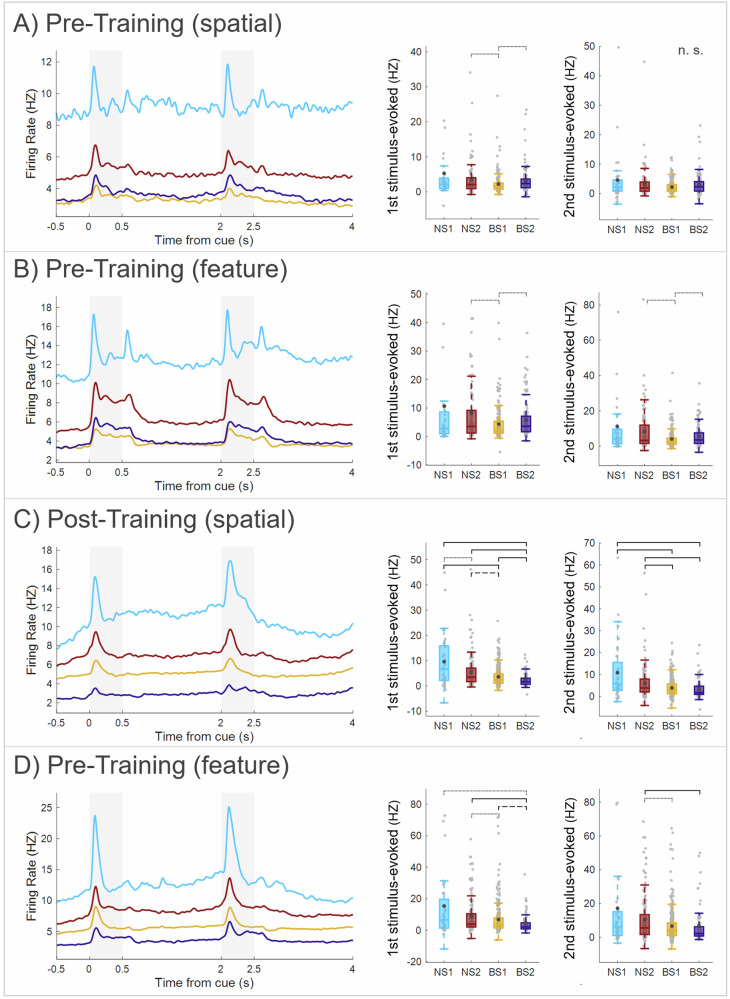
The prefrontal cortex (PFC) is important for learning and performing working memory tasks. However, its precise role for spatial and non-spatial working memory, and the role of different cell types in the circuits that maintain working memory remain poorly understood. To investigate this issue, we analyzed single-unit recordings from the PFC of monkeys during the passive viewing phase before they learned the task rules and after learning, during the execution of active working memory tasks (spatial and feature). Through cluster analysis of extracellular spike waveform features, we identified two classes of narrow-spiking neurons (putative inhibitory cells) and two classes of broad-spiking neurons (putative pyramidal cells). These putative cell classes exhibited distinct physiological characteristics, including baseline firing rates, baseline neural firing variability, and visual stimulus-evoked responses. Neuronal response modulation varied heterogeneously across these cell classes after training and performing active tasks. Training and execution of spatial working memory resulted in higher activity in all class types, highlighting the involvement of diverse prefrontal circuits in spatial information processing. In contrast, feature working memory training and execution affected activity of broad-spiking cell classes alone, suggesting less involvement of a prefrontal circuit in the representation of feature information. We also revealed hitherto unknown, differential effects of training and task execution on different broad-spiking cell types. One broad-spiking neuron subtype exhibited significant response modulation, with increased baseline firing rate, stimulus-evoked responses, and working memory-related firing rates. Another broad-spiking subtype showed decreased baseline firing rate and variability, which may optimize neural coding efficiency. This study advances our understanding of the functional heterogeneity within the PFC and the specialized contributions of different neuronal subtypes to cognitive processes.


Conflict of interest statement

Competing interests: The authors declare no competing interests.

Figures

Fig. 1
Fig. 1. Behavioral task.
A Spatial task. The sequence of events in the spatial task included fixation, stimulus presentation, and delay periods. During the pre-training phase, monkeys maintained fixation while stimuli appeared passively in different spatial locations. In the post-training phase, after the second delay period, choice targets appeared, requiring the monkey to saccade to a target based on the spatial match of the stimuli. B Feature task. The sequence of events in the feature task included fixation, stimulus presentation, and delay periods. During pre-training, monkeys maintained fixation while different shapes were presented passively. In the post-training phase, after the delay period, choice targets appeared, requiring the monkey to saccade to a target based on the feature match of the stimuli. C Stimulus sets. The spatial set consisted of nine possible locations arranged on a 3 × 3 grid. The feature set included eight distinct shapes: square, triangle, circle, diamond, plus sign, H, number sign, and inverted Y.
Fig. 2
Fig. 2. Cluster-based identification of cell classes in pre-training recordings via extracellular spike waveform.
A Extracted waveform features for clustering: trough-to-peak duration, first peak-to-trough ratio (A1/A3), and peak ratio (A2/A1). B Bayesian information criterion (BIC) analysis for determining the optimal number of clusters. Four clusters were chosen as the optimal number based on the minimum BIC, as shown by the purple arrow. C Three-dimensional representation of spike waveform features and clustering using Gaussian mixture modeling (GMM). The clusters were identified as narrow-spiking 1 (NS1, blue, n = 84), narrow-spiking 2 (NS2, red, n = 273), broad-spiking 1 (BS1, yellow, n = 536), and broad-spiking 2 (BS2, purple, n = 389). D Spike waveforms of different cell classes. The average spike waveform for each class is displayed in black. E Comparison of average waveforms between clusters. F Confusion matrix for validation of cluster separation. Using the fitted GMM distributions, synthetic data points were generated, and their true labels were evaluated against the GMM-predicted assignments. The main diagonal represents the accuracy rate of classifying each class (cluster separation), while the elements outside the main diagonal indicate the percentage of misclassification (cluster overlap). The overall average accuracy was 95.45%.
Fig. 3
Fig. 3. Identification of cell classes in post-training recordings using the fitted model on pre-training units.
A Three-dimensional representation of spike waveform features in post-training recordings and clustering using the GMM trained on pre-training units. NS1 (n = 65) and NS2 (n = 291) clusters are blue and red, respectively, while BS1 (n = 574) and BS2 (n = 248) are yellow and purple. B Spike waveforms of different cell classes. The average spike waveform for each class is displayed in black. C Comparison of average waveforms between clusters.
Fig. 4
Fig. 4. Percentage of responsive units for cell classes.
A Percentage of responsive neurons to visual stimuli in each class. These neurons exhibit a significant increase in firing rate during the stimulus presentation period compared to baseline. Pre-training recordings for each class are depicted in light colors, while post-training units are depicted in dark colors. In the pre-training phase, 27.4% (n = 23/84), 30.8% (n = 84/273), 23.1% (n = 124/536), and 25.7% (n = 100/389) of NS1, NS2, BS1, and BS2 neurons were responsive, respectively. In the post-training phase, the percentages were 46.2% (n = 30/65), 39.2% (n = 114/291), 36.4% (n = 209/574), and 24.6% (n = 61/248) for NS1, NS2, BS1, and BS2 neurons, respectively. B Percentage of responsive neurons during the delay period in each class. These neurons exhibit a significant increase in firing rate during the delay period compared to baseline. In the pre-training phase, 25.0% (n = 21/84), 20.2% (n = 55/273), 16.2% (n = 87/536), and 17.5% (n = 68/389) of NS1, NS2, BS1, and BS2 neurons were responsive, respectively. In the post-training phase, the percentages were 38.5% (n = 25/65), 35.7% (n = 104/291), 35.4% (n = 203/574), and 27.4% (n = 68/248), respectively. C Total percentage of responsive neurons during either the stimulus presentation or delay period (or both) in each class. These neurons exhibit a significant increase in firing rate during either or both periods compared to baseline. In the pre-training phase, 41.7% (n = 35/84), 37.0% (n = 101/273), 31.0% (n = 166/536), and 31.6% (n = 123/389) of NS1, NS2, BS1, and BS2 neurons were responsive, respectively. In the post-training phase, the percentages were 55.4% (n = 36/65), 50.2% (n = 146/291), 49.0% (n = 281/574), and 39.1% (n = 97/248), respectively. D Changes in the percentage of responsive units during the stimulus presentation period after training and execution of the WM tasks for each class. E Changes in the percentage of responsive units during the delay period after training and execution of the WM tasks for each class. F Changes in the total percentage of responsive units during either the stimulus presentation or delay period (or both) after training and execution of the WM tasks for each class.
Fig. 5
Fig. 5. Physiological characteristics of cell classes.
A Baseline firing rate (FR) of each cell class for pre-training units. B Baseline Fano factor (FF) of each cell class for pre-training units. C Baseline coefficient of variation of the interspike interval distribution (CV) of each cell class for pre-training units. D Baseline local variation (LV) of each cell class for pre-training units. The number of pre-training units was n = 35, 101, 166, and 123 for NS1, NS2, BS1, and BS2 classes, respectively. E Baseline FR of each cell class for post-training units. F Baseline FF of each cell class for post-training units. G Baseline CV of each cell class for post-training units. H Baseline LV of each cell class for post-training units. All measures were calculated during a 1000 ms baseline fixation period. The number of pre-training units was n = 36, 146, 281, and 97 for NS1, NS2, BS1, and BS2 classes, respectively. Each box plot shows the median (horizontal line), interquartile range (box), and whiskers extending to 1.5 times the interquartile range. Gray dots represent individual data points for each unit, and larger black dots indicate group means. Statistical significance was assessed using the Kruskal-Wallis test for multiple comparisons (p < 0.05) and the Mann-Whitney U test with FDR adjustment for pairwise comparisons. Dotted, dashed, and solid lines indicate p < 0.05, p < 0.01, and p < 0.005 (Mann-Whitney U test, FDR adjusted), respectively.
Fig. 6
Fig. 6. Neuronal responses to visual stimuli across cell classes.
A, B Firing dynamics in the pre-training phase for the spatial and feature tasks, respectively. C, D Firing dynamics in the post-training phase for the spatial and feature tasks, respectively. The left panels display the average spike density function (SDF) of each cell class during the interval from −0.5 s to 4 s relative to the onset of the first stimulus. Gray bars indicate stimulus presentation intervals (0–0.5 s and 2–2.5 s). NS1, NS2, BS1, and BS2 classes are represented in blue, red, yellow, and purple, respectively. The right panels represent the first and second stimulus-evoked responses for each cell class. Stimulus-evoked response refers to the increase in firing rate during stimulus presentation. Each box plot shows the median (horizontal line), interquartile range (box), and whiskers extending to 1.5 times the interquartile range. Gray dots represent individual data points for each unit, and larger black dots indicate group means. Statistical significance was assessed using the Kruskal-Wallis test for multiple comparisons (n.s. indicates no significant difference) and the Mann-Whitney U test with FDR adjustment for pairwise comparisons. Dotted, dashed, and solid lines indicate p < 0.05, p < 0.01, and p < 0.005, respectively (Mann-Whitney U test, FDR adjusted).
Fig. 7
Fig. 7. Changes in baseline neural activity: pre-training vs. post-training.
A Comparison of baseline firing rates between pre-training passive (light color) and post-training active (dark color) phases for each cell class. B Comparison of baseline Fano factor between pre-training and post-training phases for each cell class. C Comparison of baseline coefficient of variation between pre-training and post-training phases for each cell class. D Comparison of baseline local variation between pre-training and post-training phases for each cell class. Each box plot shows the median (horizontal line), interquartile range (box), and whiskers extending to 1.5 times the interquartile range. Gray dots represent individual data points for each unit, and larger black dots indicate group means. *, **, and *** indicate p < 0.05, p < 0.01, and p < 0.005, respectively (Mann-Whitney U test).
Fig. 8
Fig. 8. Changes in stimulus-evoked responses: pre-training vs. post-training.
A Comparison of first stimulus-evoked responses between pre-training passive (light color) and post-training active (dark color) phases for each cell class in the spatial task. B Comparison of second stimulus-evoked responses between pre-training and post-training phases for each cell class in the spatial task. C Comparison of first stimulus-evoked responses between pre-training and post-training phases for each cell class in the feature task. D Comparison of second stimulus-evoked responses between pre-training and post-training phases for each cell class in the feature task. Each box plot shows the median (horizontal line), interquartile range (box), and whiskers extending to 1.5 times the interquartile range. Gray dots represent individual data points for each unit, and larger black dots indicate group means. *, **, and *** indicate p < 0.05, p < 0.01, and p < 0.005, respectively (Mann-Whitney U test).
Fig. 9
Fig. 9. Changes in delay responses: pre-training vs. post-training.
A Comparison of firing rate during the first delay period between pre-training passive (light color) and post-training active (dark color) phases for each cell class in the spatial task. B Comparison of Fano factor during the delay period between pre-training and post-training phases for each cell class in the spatial task. C Comparison of coefficient of variation during the delay period between pre-training and post-training phases for each cell class in the spatial task. D Comparison of local variation during the delay period between pre-training and post-training phases for each cell class in the spatial task. E Comparison of firing rate during the delay period between pre-training and post-training phases for each cell class in the feature task. F Comparison of Fano factor during the delay period between pre-training and post-training phases for each cell class in the feature task. G Comparison of coefficient of variation during the delay period between pre-training and post-training phases for each cell class in the feature task. H Comparison of local variation during the delay period between pre-training and post-training phases for each cell class in the feature task. Each box plot shows the median (horizontal line), interquartile range (box), and whiskers extending to 1.5 times the interquartile range. Gray dots represent individual data points for each unit, and larger black dots indicate group means. *, **, and *** indicate p < 0.05, p < 0.01, and p < 0.005, respectively (Mann-Whitney U test).
Fig. 10
Fig. 10. Relationship between neuronal firing rate and choice accuracy across cell classes in the active WM tasks.
A Comparison of firing rates during the second delay period between low choice accuracy (light color) and high choice accuracy (dark color) sessions for each cell class in the spatial WM task. The number of units with low and high choice accuracy was n = 16 and 19 for NS1, n = 69 and 77 for NS2, n = 147 and 134 for BS1, and n = 48 and 49 for BS2, respectively. B Comparison of firing rates during the second delay period between low choice accuracy (light color) and high choice accuracy (dark color) sessions for each cell class in the feature WM task. The number of units with low and high choice accuracy was n = 18 and 17 for NS1, n = 52 and 94 for NS2, n = 122 and 159 for BS1, and n = 42 and 55 for BS2, respectively. Each box plot shows the median (horizontal line), interquartile range (box), and whiskers extending to 1.5 times the interquartile range. Gray dots represent individual data points for each unit, and larger black dots indicate group means. *, **, and *** indicate p < 0.05, p < 0.01, and p < 0.005, respectively (Mann-Whitney U test).

Similar articles

References

    1. Baddeley, A. Working memory. Science255, 556–559 (1992). - PubMed
    1. Gathercole, S. E., Brown, L. & Pickering, S. J. Working memory assessments at school entry as longitudinal predictors of National Curriculum attainment levels. Educ. Child Psychol.20, 109–122 (2003).
    1. Baddeley, A. Working memory: Theories, models, and controversies. Annu. Rev. Psychol.63, 1–29 (2012). - PubMed
    1. Jaffe, R. J. & Constantinidis, C. Working memory: from neural activity to the sentient mind. Compr. Physiol.11, 1–41 (2021). - PMC - PubMed
    1. Riley, M. R. & Constantinidis, C. Role of prefrontal persistent activity in working memory. Front. Syst. Neurosci.9, 181 (2016). - PMC - PubMed

LinkOut - more resources