. 2025 May 6;109(1):111.
doi: 10.1007/s00253-025-13496-0.

Influence of orthodontic appliances and nitrate on the oral microbiota

Affiliations

Influence of orthodontic appliances and nitrate on the oral microbiota

Elisabeth Reichardt et al. Appl Microbiol Biotechnol. .

Abstract

In this pilot study, we investigated the bacterial changes introduced on the subgingival, tongue, and saliva microbiota during fixed orthodontic treatment, with or without daily administration of nitrate-containing beet juice for 2 weeks in 22 individuals with good general health. We followed clinical parameters in combination with microbiota changes before, after 2 weeks, and after 6 months of treatment with fixed orthodontic appliances. In accordance with variations in community composition at the sampling sites, effects to orthodontic treatment differed. Subgingival communities responded promptly to orthodontic treatment with no additional structural changes over time, whereas saliva and tongue communities were affected only after extended treatment. Periodontal pathogens such as Selenomonas sputigena were enriched in subgingival communities, whereas Streptococcus mutans was enriched in saliva. Specifically, Rothia mucilaginosa increased tremendously in relative abundance in both tongue and saliva communities. The effect of beet juice on microbial composition was significant in subgingival samples even though the differences were not mirrored in single differentially distributed genera or species. This indicates changes in the complete subgingival microbial net of interacting species. However, the prevention of Corynebacterium matruchotii enrichment by beet juice may be important for prevention of biofilm formation. Enrichment of Neisseria flavescens group bacteria and Abiotrophia and depletion of different Actinomyces and Stomatobaculum were observed on tongue communities. We conclude that subgingival microbiota are rapidly affected by fixed orthodontic appliances and can be positively influenced by regular administration of nitrate-containing juice. KEY POINTS: • The subgingival site, tongue, and saliva contain different microbiota • The microbiota react differently to orthodontic treatment and beet juice • Key genera and species affected by treatments were identified.

Keywords: Dietary supplements; Gingival disease; Nitrate; Oral health; Oral microbiota; Orthodontic fixed appliances.


Conflict of interest statement

Declarations. Ethical approval: The study was approved by the Medical Ethics Committees of the University of Wuerzburg, Germany, and Northwest and Central Switzerland (trial register: 185–2017; 2019–01896). All parents/legal guardians of the participants signed informed consent before participation. Conflict of interest: The authors declare no competing interests.

Figures

Fig. 1
Fig. 1
Differences in bacterial community structure in saliva, SA; dorsum of the tongue, TO; and subgingival plaque, SU. a The global bacterial community structure was assessed by non-metric multidimensional scaling (nMDS) and is based on standardized species abundance data. Similarities were calculated using the Bray–Curtis similarity algorithm. b Relative abundance of genera predominant in saliva, tongue, and subgingival plaque samples. Only genera with a mean relative abundance > 3% on at least one site are shown. c Relative abundance of species predominant in saliva, tongue, and subgingival plaque samples. Only species with a mean relative abundance > 2% on at least one site are shown. Sequence variants which could not be assigned to a species are joined as “others”
Fig. 2
Fig. 2
Relative mean abundance of genera and genus level taxa as well as of species in SU samples. a The mean relative abundance (% rel abundance) of genera and genus level taxa at time 0, 1, and 2 is displayed as well as the standard error of mean. Differences in taxon distribution were evaluated by the Friedman test. If a differential distribution was indicated (adjusted p < 0.05), taxa differentially distributed over time were further assessed by Dunn’s post-hoc test. Statistically significant differences are indicated as *p < 0.05, **p < 0.01, or ***p < 0.001. b The relative abundance of species is given at time 0, 1, and 2. Differences in taxon distribution were evaluated by the Friedman test. If a differential distribution was indicated, taxa differentially distributed over time were further assessed by Dunn’s post-hoc test. Statistically significant differences are indicated as *p < 0.05, **p < 0.01, or ***p < 0.001. The median is indicated by a black line and the mean by +. The box represents the interquartile range (IQR). The whiskers extend to the upper adjacent value (largest value = 75 th percentile + 1.5 × IQR) and the lower adjacent value (lowest value = 25 th percentile − 1.5 × IQR) and the dots represent outliers
Fig. 3
Fig. 3
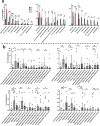
Relative mean abundance of genera and genus level taxa as well as of species in SA samples. a The mean relative abundance (% rel abundance) of genera and genus level taxa at time 0, 1, and 2 is displayed as well as the standard error of mean. Differences in taxon distribution were evaluated by the Friedman test. If a differential distribution was indicated (adjusted p < 0.05), taxa differentially distributed over time were further assessed by Dunn’s post-hoc test. Statistically significant differences are indicated as *p < 0.05, **p < 0.01, or ***p < 0.001. b The relative abundance of species is given at time 0, 1, and 2. Differences in taxon distribution were evaluated by the Friedman test. If a differential distribution was indicated, taxa differentially distributed over time were further assessed by Dunn’s post-hoc test. Statistically significant differences are indicated as *p < 0.05, **p < 0.01, or ***p < 0.001. The median is indicated by a black line and the mean by +. The box represents the IQR. The whiskers extend to the upper adjacent value (largest value = 75 th percentile + 1.5 × IQR) and the lower adjacent value (lowest value = 25 th percentile − 1.5 × IQR), and the dots represent outliers
Fig. 4
Fig. 4
Relative mean abundance of genera and genus level taxa as well as of species in TO samples. a The mean relative abundance (% rel abundance) of genera and genus level taxa at time 0, 1, and 2 is displayed as well as the standard error of mean. Differences in taxon distribution were evaluated by the Friedman test. If a differential distribution was indicated (adjusted p < 0.05), taxa differentially distributed over time were further assessed by Dunn’s post-hoc test. Statistically significant differences are indicated as *p < 0.05, **p < 0.01, or ***p < 0.001. b The relative abundance of species is given at time 0, 1, and 2. Differences in taxon distribution were evaluated by the Friedman test. If a differential distribution was indicated, taxa differentially distributed over time were further assessed by Dunn’s post-hoc test. Statistically significant differences are indicated as *p < 0.05, **p < 0.01, or ***p < 0.001. The median is indicated by a black line and the mean by +. The box represents the IQR. The whiskers extend to the upper adjacent value (largest value = 75 th percentile + 1.5 × IQR) and the lower adjacent value (lowest value = 25 th percentile − 1.5 × IQR), and the dots represent outliers
Fig. 5
Fig. 5
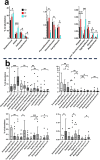
The effect of juice on the relative abundance of selected taxa in TO samples. The relative abundance (% rel abundance) at time 0 and 1 and separately in controls (C) or juice consuming patients (J) is displayed as well as the median. Differences in taxon distribution were evaluated by a 2-way repeated measures ANOVA on square root transformed abundance data. Statistically significant pairwise differences were corrected by the Sidak post-hoc test and are indicated as *p < 0.05, **p < 0.01, ***p < 0.001, and ****p < 0.0001. The significance of interaction between the factors time and juice consumption is indicated as insert to each graph. Untransformed relative abundance data are visualized
Fig. 6
Fig. 6
The effect of juice on the relative abundance of selected taxa in SA samples. The relative abundance (% rel abundance) at time 0 and 1 and separately in controls (C) or juice consuming patients (J) is displayed as well as the median. Differences in taxon distribution were evaluated by a 2-way repeated measures ANOVA on square root transformed abundance data. Statistically significant pairwise differences were corrected by the Sidak post-hoc test and are indicated as *p < 0.05, **p < 0.01, and ***p < 0.001. The significance of interaction between the factors time and juice consumption is indicated as insert to each graph. Untransformed relative abundance data are visualized
Fig. 7
Fig. 7
The effect of juice on the relative abundance of selected taxa in SU samples. The relative abundance (% rel abundance) at time 0 and 1 and separately in controls (C) or juice consuming patients (J) is displayed as well as the median. Differences in taxon distribution were evaluated by a 2-way repeated measures ANOVA on square root transformed abundance data. Statistically significant pairwise differences were corrected by the Sidak post-hoc test and are indicated as *p < 0.05, **p < 0.01, and ***p < 0.001. The significance of interaction between the factors time and juice consumption is indicated as insert to each graph. Untransformed relative abundance data are visualized

References

    1. Alexander SA (1991) Effects of orthodontic attachments on the gingival health of permanent second molars. Am J Orthod Dentofacial Orthop 100:337–340. 10.1016/0889-5406(91)70071-4 - PubMed
    1. Babikow E, Ghaltakhchyan N, Livingston T, Qu Y, Liu C, Hoxie A, Sulkowski T, Bocklage C, Marsh A, Phillips ST, Mitchell KB, Ribeiro AA, Jackson TH, Roach J, Wu D, Divaris K, Jacox LA (2024) Longitudinal microbiome changes in supragingival biofilm transcriptomes induced by orthodontics. JDR Clin Trans Res 9:265–276. 10.1177/23800844231199393 - PMC - PubMed
    1. Baker JL, Mark Welch JL, Kauffman KM, McLean JS, He X (2024) The oral microbiome: diversity, biogeography and human health. Nat Rev Microbiol 22:89–104. 10.1038/s41579-023-00963-6 - PMC - PubMed
    1. Callahan BJ, McMurdie PJ, Rosen MJ, Han AW, Johnson AJ, Holmes SP (2016) DADA2: high-resolution sample inference from Illumina amplicon data. Nat Methods 13:581–583. 10.1038/nmeth.3869 - PMC - PubMed
    1. Camarinha-Silva A, Jauregui R, Chaves-Moreno D, Oxley AP, Schaumburg F, Becker K, Wos-Oxley ML, Pieper DH (2014) Comparing the anterior nare bacterial community of two discrete human populations using Illumina amplicon sequencing. Environ Microbiol 16:2939–2952. 10.1111/1462-2920.12362 - PubMed

MeSH terms

LinkOut - more resources