. 2025 Jun;44(12):3448-3467.
doi: 10.1038/s44318-025-00447-8. Epub 2025 May 6.

CHD8 interacts with BCL11A to induce oncogenic transcription in triple negative breast cancer

Affiliations

CHD8 interacts with BCL11A to induce oncogenic transcription in triple negative breast cancer

Mark Waterhouse et al. EMBO J. 2025 Jun.

Abstract

The identification of tumour-specific protein-protein interactions remains a challenge for the development of targeted cancer therapies. In this study we describe our approach for the identification of triple negative breast cancer (TNBC)-specific protein-protein interactions focusing on the oncogene BCL11A. We used a proteomic approach to identify the BCL11A protein networks in TNBC and compared it to its network in B-cells, a cell type in which BCL11A plays crucial roles. This approach identified the chromatin remodeller CHD8 as a TNBC-specific interaction partner of BCL11A. We show that CHD8 also plays a key role in TNBC pathogenesis, with detailed multi-omics analysis revealing that BCL11A and CHD8 co-regulate several targets and synergise to drive tumour development and progression. Using a battery of biophysical assays, we confirm that the BCL11A-CHD8 interaction is direct and identify chemical fragments that disrupt this interaction and affect downstream targets, decreasing proliferation in 3D colony assays. Our study provides a proof-of-principle approach for investigating tumour-specific protein-protein interactions and identifies lead chemical compounds that could be developed into novel therapeutics for TNBC.

Keywords: BCL11A; CHD8; TNBC; Tumour Specific Protein–protein Interactions.


Conflict of interest statement

Disclosure and competing interests statement. The authors declare no competing interests.

Figures

Figure 1
Figure 1. CHD8 interacts with BCL11A in TNBC and plays a role in TNBC pathology.
(A) Rapid Immunoprecipitation mass spectrometry of endogenous proteins (RIME) was performed on a range of TNBC samples and primary mouse B-cells, using BCL11A as a bait protein. Detailed results from the mass spectrometry analysis including protein accession number, gene description, mascot score, coverage, and unique peptides have been included in Dataset EV1–6. For cumulative Mascot score word cloud analysis (bottom panels), we first subtracted proteins identified from the BCL11A IP mass spec that were also present in the IgG isotype control IP mass spec, thereby removing any non-specific proteins. Subsequently, proteins with a minimum of one unique peptide were included and the cumulative mascot score was calculated. The word cloud represents each protein and the size representative to the mascot score. This analysis was performed on two independent B-cell runs (right word cloud) and seven independent TNBC cell line or PDX tissue runs (left word cloud). This identified CHD8 as a major interacting partner in TNBC samples but not B cells, with CHD8 being the only interaction partner identified in all TNBC samples. (B) 4T1 cells were transfected with plasmids encoding either Chd8 shRNA or gRNA sequences and were subsequently used in 3D colony assays or xenografted into mice for tumour growth assays (n = 3). An ordinary one-way ANOVA with a Dunnett multiple comparison correction was used. Means of each test condition were compared to the mean of the control condition. P values reported are *p < 0.05; **p < 0.01; ***p < 0.001 and ****p < 0.0001. shRNA-mediated knockdown of Chd8 in mouse TNBC 4T1 cells leads to a reduction in tumour growth in both 3D colony assays (left panel) and xenograft transplantation assays (middle panel), CRISPR-mediated knockout of Chd8 produces similar results (right panel) demonstrating that CHD8 also plays a role in TNBC (n = 4). Error bars on the box and whisker denote the minimum and maximum datapoints, the box bounds are the upper and lower quartile values and the line in the middle of the box if is the median value. An ordinary one-way ANOVA with a Dunnett multiple comparison correction was used for statistical analysis of the xenograft plots. Means of each knockdown condition were compared to the mean of the control condition. *p < 0.05; *p < 0.01; ***p < 0.001 and ****p < 0.0001. The Western Blot in this figure panel is also shown in Appendix Fig. S1D. (C) Western blot analysis of BCL11A and CHD8 was performed in patient-derived xenografts derived from TNBC or luminal breast tumours. This identified selective upregulation of both proteins in TNBC tumours but not luminal breast cancer tumours. Further qPCR analysis showed amplification of BCL11A RNA in TNBC tumours (n = 14) versus luminal tumours (n = 9), whereas CHD8 is unaltered at the RNA level. Error bars on the box and whisker denote the minimum and maximum datapoints, the box bounds are the upper and lower quartile values and the line in the middle of the box if is the median value. (D) Western blot analysis of BCL11A and CHD8 was performed using tumours derived from a Brca1f/f p53+/− Blg-Cre mouse model, in which mice spontaneously form TNBC tumours. This showed upregulation of both proteins and upregulation of BCL11A only at the RNA level (n = 6). Controls in this experiment were mammary gland preparations from C57BL/6 mice (n = 3). Error bars on the box and whisker denote the minimum and maximum datapoints, the box bounds are the upper and lower quartile values and the line in the middle of the box if is the median value. (E) Knockdown of Bcl11a using shRNA in 4T1 cells showed a reduction in the levels of BCL11A and CHD8 protein, with a corresponding reduction in Bcl11a RNA but not Chd8 RNA (n = 3). An ordinary one-way ANOVA with a Dunnett multiple comparison correction was used for statistical analysis of these plots. Means of each knockdown condition were compared to the mean of the control condition. *p < 0.05; *p < 0.01; ***p < 0.001 and ****p < 0.0001. The Western Blot in this figure panel is also shown in Appendix Fig. S1D. Source data are available online for this figure.
Figure 2
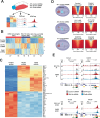
Figure 2. Multi-OMICS analysis of Bcl11a and Chd8 knockdown cells identifies a large subset of shared target genes.
(A) To further explore the role of BCL11A and CHD8 in TNBC, multi-OMICS analysis of 4T1 cells transfected with either control shRNA, Bcl11a-targeting shRNA or Chd8-targeting shRNA was performed. Cells were submitted for bulk RNAseq; ChIPseq, to investigate genomic binding of BCL11A and CHD8; and ATACseq, to investigate modulation of chromatic accessibility. (B) Bulk RNAseq identified a number of protein-specific gene targets, but also identified a large subset of overlapping target genes. The expression of overlapping gene targets appeared to be affected in similar directions and magnitudes by either Bcl11a or Chd8 knockdown. (C) Heat map of the top 30 up- and down-regulated genes from the overlapping gene set. This set of genes is derived from panel B and uses the same scale bar. (D) Transcription start site (TSS) heat maps showing the genomic binding behaviour of BCL11A (left panels) and CHD8 (right panels) in control shRNA (top panels), Bcl11a shRNA (middle panels) and Chd8 shRNA (bottom panels) cell lines. Knockdown of either Bcl11a or Chd8 results in an overall reduction of genomic binding for both proteins around the TSS. (E) Manual inspection of ChIP-seq data confirms co-dependency of BCL11A and CHD8 for binding to promoter regions. Knockdown of either Bcl11a (red peaks) or Chd8 (blue peaks) results in reduced genomic binding versus control (grey peaks). ATACseq analysis shows that knockdown of Chd8, but not Bcl11a, reduces chromatin accessibility at gene target promoter regions.
Figure 3
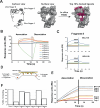
Figure 3. CHD8 is highly specific for and directly interacts with BCL11A.
(A) Western blot analysis of BCL11A and CHD8 was performed on samples from co-immunoprecipitation (Co-IP) experiments. BCL11A and CHD8 were independently immunoprecipitated in human TNBC cells (MDA231), mouse TNBC cells (4T1) patient-derived xenografts (PDX) and wild-type (C57BL/6) mouse spleen. Western Blots validated that BCL11A and CHD8 interact in the TNBC and PDX samples, but not in spleen sampes. (B) Western Blot analysis of BCL11A and other members of the CHD family using CoIP samples from panel A. Further analysis showed high specificity of the BCL11A-CHD8 interaction, with no interaction observed between BCL11A and other members of the CHD family. (C) To confirm direct interaction of BCL11A and CHD8, recombinant full-length human versions of BCL11A and CHD8 were expressed and purified from Expi293F cells. Cells were lysed and proteins purified via the StrepTag using StrepTactin XT 4-Flow resin. (D) Purity and quality of recombinant proteins was assessed by SDS-PAGE and Western Blotting, showing a high purity and mono-dispersity of proteins. (E) A surface plasmon resonance (SPR) assay was constructed to confirm direct interaction of BCL11A and CHD8. In this assay, one partner (CHD8) was attached to the surface of an SPR chip, while the other partner (BCL11A) was injected in increasing concentrations. A reference flow cell containing an unrelated protein (BSA) was used as a binding control. Protein binding to the SPR surface causes a change in resonance angle, which can be used to detect protein interactions. (F) SPR using recombinant purified proteins confirms a direct interaction between BCL11A and CHD8. A concentration-dependent increase in binding responses was observed upon injection of BCL11A, with slow association and dissociation rates observed. Responses at the end of the sample injection (600 s) were used to estimate the steady-state affinity of the interaction, which was measured at 870 nM (50% Rmax). (G) A second SPR assay was constructed, whereby either full-length CHD8 or BCL11A was immobilised to the chip surface. Truncated BCL11A or CHD8 proteins were then injected in series into the flow cell containing their interaction partner (i.e. BCL11A vs CHD8 fragments, CHD8 versus BCL11A fragments). This identified BCL11A 601-835 and CHD8 450-950 as the most likely interface between BCL11A and CHD8. The schematic in panel C was generated using BioRender. Source data are available online for this figure.
Figure 4
Figure 4. In silico fragment screening of BCL11A identifies several hit compounds that prevent in vitro BCL11A-CHD8 complex formation.
(A) GLIDE-based virtual screening using three diverse fragment libraries was performed using PDB structure 6ki6. The top 10% of hits were re-scored and manually inspected, with the best 8 hits purchased for screening. Hits located in the zinc finger 6 region were prioritised due to higher uniqueness in this region compared to BCL11B. (B) SPR screening for validation of in silico hits. BCL11A was immobilised to an SPR sensor surface, with each fragment injected at a single high concentration (400 μM). 6 out of the 8 purchased fragments were validated as BCL11A binders. (C) Further assessment of validated binders was then performed in a concentration series. Fragments were then injected in a 1:3 serial dilution series to confirm binding and to generate kinetics and affinity data using an SPR chip comprising separate flow cells with either BCL11A or BCL11B immobilised. An example of the concentration series data for fragment 8 is shown for BCL11A and BCL11B binding. All fragments were shown to also bind the homologous BCL11B. (D) An SPR assay was constructed to investigate the ability of fragment hits to prevent BCL11A-CHD8 complex formation. Full-length recombinant CHD8 was immobilised to the chip surface, with subsequent injection of BCL11A alone or of BCL11A that had been pre-incubated with 400 μM of each fragment. Inhibition of the complex was determined through a reduction in binding response of BCL11A binding to the chip surface. (E) All of the fragments tested prevented BCL11A-CHD8 complex formation with varying efficiencies, indicated by a reduction of BCL11A binding to the CHD8-coated surface. (F) Percentage inhibition of BCL11A binding to the chip surface is summarised. Responses are normalised to the BCL11A binding response. Source data are available online for this figure.
Figure 5
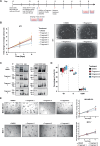
Figure 5. 3D colony assays identify differential effects on the growth of colony size upon treatment with BCL11A-CHD8 interaction inhibitors, with the effect being TNBC cell-line specific.
(A) To assess the effect of putative BCL11A-CHD8 interaction inhibitors, 4T1, MCF-7 and MDA-MB-231 cells were grown in 3D and treated with inhibitors across 6 days. Cells were imaged at day 0, 3 and 6 for analysis of colony formation. (B) Fold change in average 4T1 colony size relative to day 0 size upon treatment of fragments at 200 μM across 6 days of treatment, fitted with simple linear regression identifying that the slopes of fold change in average colony size over time differ globally within 4T1s (n = 3 passages, F = 3.999, p = 0.025) (left panel). 3D colony assay images visualising the phenotypic changes in 4T1 colony size following 6 days of treatment with 3 selected binders. The scale bar represents 2000um (right panel). (C) Co-Immunoprecipitation (CoIP) experiments in which BCL11A and CHD8 were independently immunoprecipitated from 4T1 cells treated with 1% DMSO (vehicle control) or 400 μM of Fragment 1, Fragment 3 or Fragment 5. Anti-BCL11A Western Blots demonstrate that 4T1 treatment has no effect on the levels of BCL11A (input) or in the recognition of BCL11A by an anti-BCL11A antibody (left panels). Conversely, anti-BCL11A Western Blots on CHD8 IP samples (right panels) demonstrates an interaction between CHD8 and BCL11A in the DMSO control, but not in the fragment treatment conditions, suggesting inhibition of the BCL11A-CHD8 interaction by these fragments in a cell-based format. (D) Percentage of 4T1 cells in G1, S and G2/M phase following treatment of fragments 1, 3 and 5 at 200 μM for 24 h, determined by flow cytometry. Data presented as median and range (n = 3 passages), G1 analysed by Kruskal–Wallis test, G2/M and S phase analysed by two-way ANOVA with post-hoc Dunnett’s test identifying a significant difference between treatment with DMSO and Fragment 3 (p = 0.0294). (E) Fold change in average colony size relative to day 0 size comparing human cell lines MCF-7 and MDA-MB-231 upon treatment of fragments 1, 3 and 5 at 200 μM. 3D colony assay images visualising the phenotypic changes in MCF-7 and MDA-MB-231 colony size. The scale bars represent 1000 μm (left panel) Fitted simple linear regressions to fold change in average colony size over time identifies global differences in MDA-MB-231 cells (n = 3 passages, F = 3.727, p = 0.0226), with no global difference in the slope (n = 3, F = 0.5817, p = 0.6319) or intercept (n = 3 passages, F = 0.5734, p = 0.6368) in MCF-7 cells (right panel). Source data are available online for this figure.

References

    1. Bolstad BM, Irizarry RA, Astrand M, Speed TP (2003) A comparison of normalization methods for high density oligonucleotide array data based on variance and bias. Bioinformatics 19:185–193 - PubMed
    1. Bruna A, Rueda OM, Greenwood W, Batra AS, Callari M, Batra RN, Pogrebniak K, Sandoval J, Cassidy JW, Tufegdzic-Vidakovic A et al (2016) A Biobank of breast cancer explants with preserved intra-tumor heterogeneity to screen anticancer compounds. Cell 167:260–274.e22 - PMC - PubMed
    1. Capdeville R, Buchdunger E, Zimmermann J, Matter A (2002) Glivec (STI571, imatinib), a rationally developed, targeted anticancer drug. Nat Rev Drug Discov 1:493–502 - PubMed
    1. Carey L, Winer E, Viale G, Cameron D, Gianni L (2010) Triple-negative breast cancer: disease entity or title of convenience? Nat Rev Clin Oncol 7:683–692 - PubMed
    1. Castro-Mondragon JA, Riudavets-Puig R, Rauluseviciute I, Lemma RB, Turchi L, Blanc-Mathieu R, Lucas J, Boddie P, Khan A, Manosalva Perez N et al (2022) JASPAR 2022: the 9th release of the open-access database of transcription factor binding profiles. Nucleic Acids Res 50:D165–D173 - PMC - PubMed

MeSH terms

LinkOut - more resources