. 2025 Jun;10(6):1310-1322.
doi: 10.1038/s41564-025-01989-7. Epub 2025 May 6.

Gut commensal Phascolarctobacterium faecium retunes innate immunity to mitigate obesity and metabolic disease in mice

Affiliations

Gut commensal Phascolarctobacterium faecium retunes innate immunity to mitigate obesity and metabolic disease in mice

Rebeca Liébana-García et al. Nat Microbiol. 2025 Jun.

Abstract

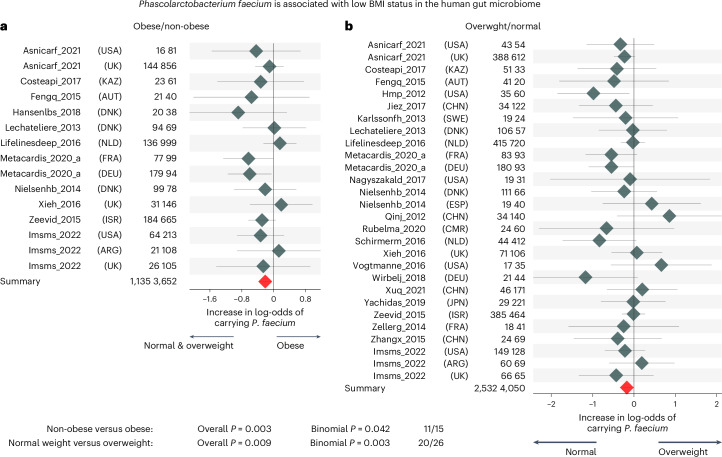
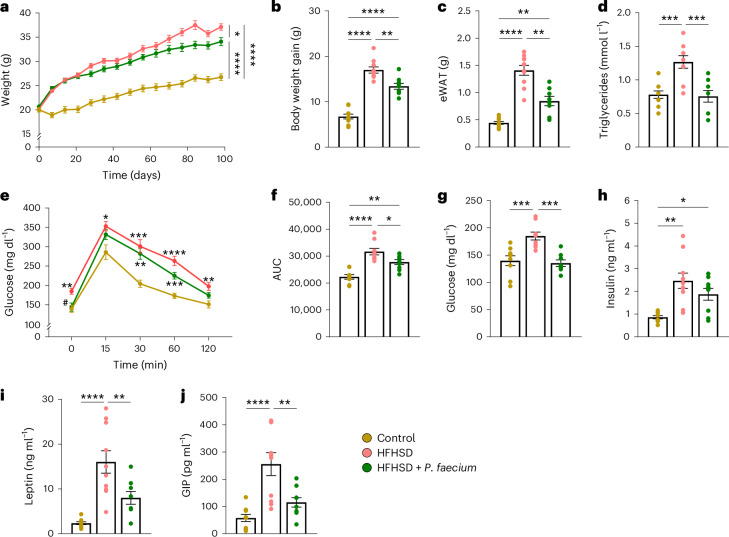
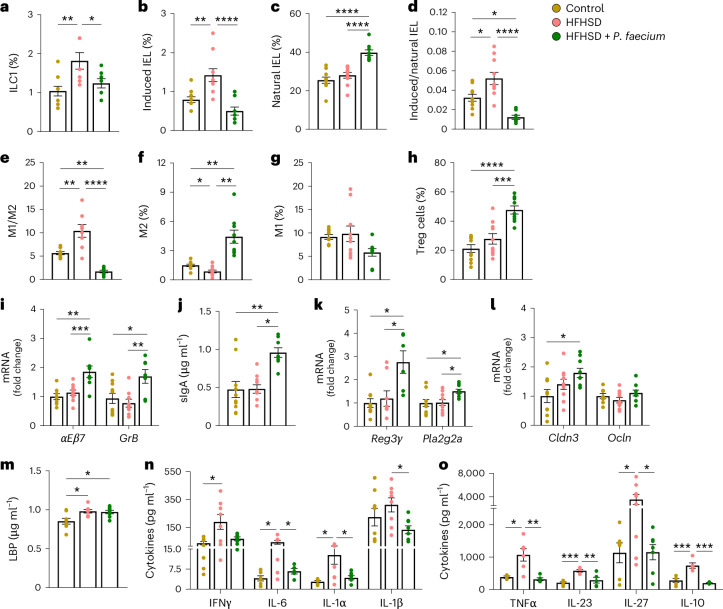
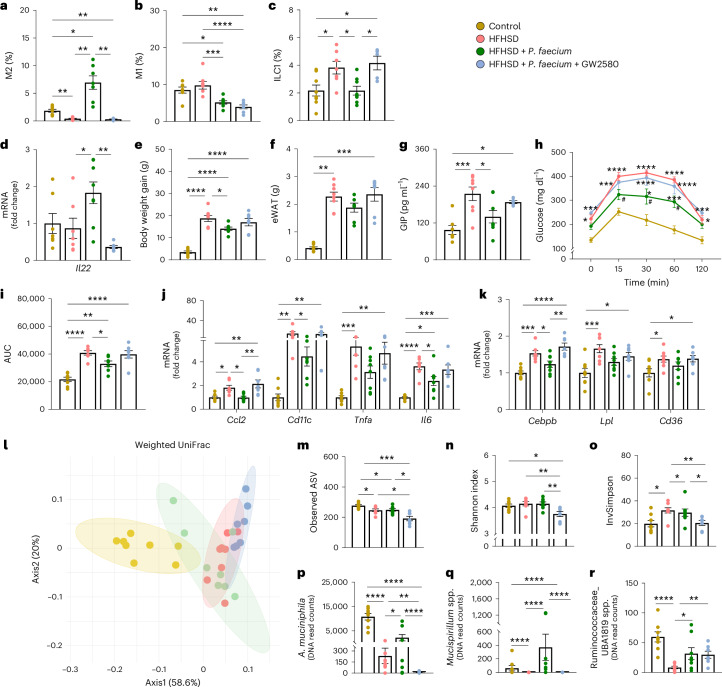
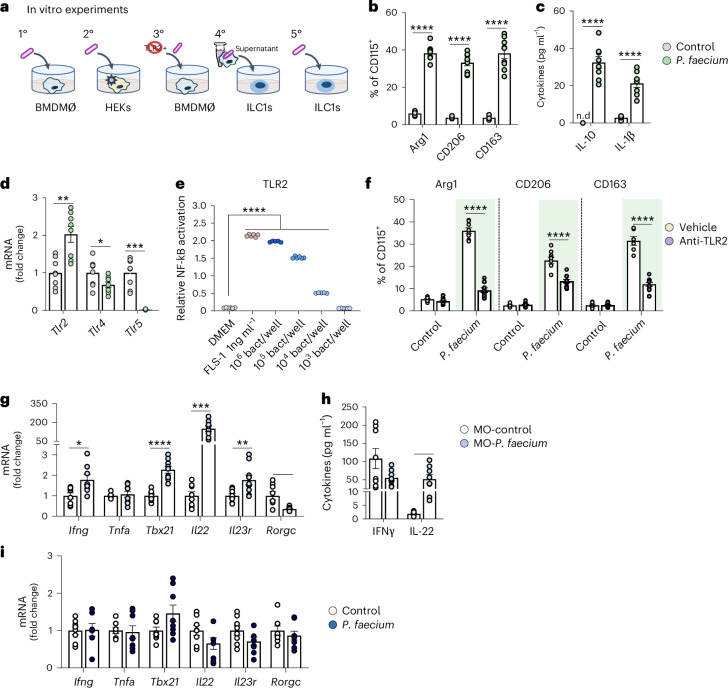
The gut microbiota may protect against obesity and chronic metabolic conditions by regulating the immune response to dietary triggers. Yet the specific bacteria that control the overactivation of the immune system in obesity and their mode of action remain largely unknown. Here we surveyed 7,569 human metagenomes and observed an association between the gut symbiont Phascolarctobacterium faecium and non-obese adults regardless of nationality, sex or age. In a mouse model of diet-induced obesity, we confirmed the specificity of P. faecium DSM 32890 anti-obesogenic properties compared with other species of the same genus. P. faecium reversed the inflammatory phenotype associated with obesity. Specifically, P. faecium promoted polarization of alternatively activated macrophages (M2), which reversed the obesity-induced increase in gut-resident type 1 innate lymphoid cells. This resulted in mitigation of glucose intolerance, adiposity and body weight gain irrespective of treatment with live or pasteurized bacteria. The metabolic benefits were independent of the adaptive immune system, but they were abolished by an inhibitor of M2 polarization in mice. P. faecium directly promoted M2-macrophage polarization through TLR2 signalling and these effects seemed to be independent of gut microbiota changes. Overall, we identify a previously undescribed gut commensal bacterium that could help mitigate obesity and metabolic comorbidities by retuning the innate immune response to hypercaloric diets.


Conflict of interest statement

Competing interests: Y.S., M.R.-P. and I.L.-A. are authors of a patent (patent application no. 201831166, Spain, 2018) belonging to CSIC on Phascolarctobacterium faecium DSM 32890. The other authors declare no competing interests.

Figures

Fig. 1
Fig. 1. The species P. faecium is linked with lower BMI in two large pooled analyses of the human gut microbiome.
a, Forest plot of a random-effect meta-analysis of the presence of P. faecium (3,652 non-obese versus 1,135 obese participants). b, Forest plot of a random-effect meta-analysis of the presence of P. faecium (4,050 normal-weighted and 2,532 overweight participants). Study name, sample sizes and nationalities are reported. The overall logistic regression meta-analysis significance was assessed using two-tailed standard t-test against the null hypothesis of a zero effect size. Binomial tests were used to assess the overproportion of single-dataset tests leaning towards one side of the plot assuming an expected proportion of 50%. Values are presented as mean ± 95% confidence intervals.
Fig. 2
Fig. 2. P. faecium DSM 32890 curbs body weight gain and adiposity, and restores glucose homeostasis in diet-induced obesity.
af, Body weight evolution (a), body weight gain (b), weight of eWAT (c), plasma triglyceride levels (d), blood glucose levels after an oral glucose load (2 g kg−1) (e) and area under the curve (AUC) at week 10 of intervention (f). gj, Fasting glucose (g), insulin (h), leptin (i) and GIP (j) levels in plasma. Control and HFHSD n = 10, HFHSD + P. faecium n = 9. Values are presented as mean ± s.e.m. of n biological replicates shown as individual dots. Significant differences were assessed using one- or two-way ANOVA followed by a post hoc Tukey’s test; *P < 0.05. In e, ‘*’ is used when compared to control diet and ‘#’ when compared to HFHSD. *P < 0.05, **P < 0.01, ***P < 0.001, ****P < 0.0001 and #P < 0.05. Source data
Fig. 3
Fig. 3. P. faecium DSM 32890 reduces HFHSD-induced intestinal and systemic inflammation.
ad, Analysis of the small intestine: ILC1s (percentage of T-bet+ IFNγ+ cells from LIN cells) in total intestinal epithelial cells (a); induced IELs (percentage of CD3+CD2+CD5+ TCRαβ+ cells from CD45+ cells) in the total intestinal epithelial cells (b); natural IELs (percentage of CD3+CD2CD5 TCRγδ+ cells from CD45+ cells) in the total intestinal epithelial cells (c) and induced and natural IEL ratio (d). eg, Ratio of M1 to M2 macrophages (e), alternative activated (M2) macrophages (percentage of CD206+ Arg1+ cells from F4/80+ cells) (f) and pro-inflammatory (M1) macrophages (percentage of CD80+ iNOS+ cells from F4/80+ cells) (g) in the total lamina propria cells. h, Treg cells (percentage of CD25+ Foxp3+ cells from CD4+ cells) in the total lamina propria cells. i, mRNA relative expression of αEβ7 integrin and granzyme B (GrB) in the small intestine. j, Secretory immunoglobulin A (sIgA) level in the caecal content. k,l, mRNA relative expression of Reg3γ and Pla2g2a (k) and of claudin (Cldn) 3 and occludin (Ocln) (l) in the small intestine. m, Plasma LBP levels. n,o, Plasma levels of indicated cytokines. Control and HFHSD n = 10, and HFHSD + P. faecium n = 9 for al; control, HFHSD and HFHSD + P. faecium n = 8 for mo. Values are presented as mean ± s.e.m. of n biological replicates shown as individual dots. Significant differences were assessed using one-way ANOVA or Kruskal–Wallis test followed by the corresponding post hoc test; *P < 0.05, **P < 0.01, ***P < 0.001 and ****P < 0.0001. Source data
Fig. 4
Fig. 4. P. faecium DSM 32890 protects metabolic health in obesity in the absence of adaptive immunity and irrespective of its viability in vivo.
ad, Body weight gain (a) and weight of eWAT (b), blood glucose levels after an oral load of glucose (2 g kg−1) (c) and AUC (d). eg, Alternative activated (M2) macrophages (percentage of CD206+ Arg1+ cells from F4/80+ cells) in the total lamina propria cells (e), ILC1s (percentage of T-bet+ IFN-γ+ cells from LIN cells) in total intestinal epithelial cells (f) and pro-inflammatory (M1) macrophages (percentage of CD80+iNOS+ cells from F4/80+ cells) in the total lamina propria cells (g). hk, Analysis of the small intestine: alternative activated (M2) macrophages (percentage of CD206+ Arg1+ cells from F4/80+ cells) in the total lamina propria cells (h), ratio of M1 to M2 (i), pro-inflammatory (M1) macrophages (percentage of CD80+ iNOS+ cells from F4/80+ cells) in the total lamina propria cells (j) and ILC1s (percentage of T-bet+ IFN-γ+ cells from LIN cells) in total intestinal epithelial cells (k). ln, Body weight gain (l), blood glucose levels after an oral load of glucose (2 g kg−1) (m) and AUC at week 10 of intervention (n). Rag1/ control and HFHSD n = 10, and Rag1/ HFHSD + P. faecium n = 6 for ag; WT mice n = 8 for hn. Values are presented as mean ± s.e.m. of n biological replicates shown as individual dots. Significant differences were assessed using one- or two-way ANOVA followed by a post hoc Tukey’s test; *P < 0.05. In c and m, ‘*’ is used when compared to the control diet and ‘#’ when compared to HFHSD. *P < 0.05, **P < 0.01, ***P < 0.001, ****P < 0.0001, #P < 0.05, ##P < 0.01 and ####P < 0.0001. Source data
Fig. 5
Fig. 5. P. faecium DSM 32890 exerts metabolic benefits through M2-macrophage polarization.
a,b, Analysis of the small intestine: alternative activated (M2) macrophages (percentage of CD206+ Arg1+ cells from F4/80+ cells) (a) and pro-inflammatory (M1) macrophages (percentage of CD80+ iNOS+ cells from F4/80+ cells) (b) in the total lamina propria cells. c,d, ILC1s (percentage of T-bet+ IFN-γ+ cells from LIN cells) in total intestinal epithelial cells (c) and mRNA relative expression of IL-22 (d). ei, Body weight gain (e) and weight of eWAT (f), fasting GIP levels in plasma (g), blood glucose levels after an oral load of glucose (2 g kg−1) (h) and AUC (i). j,k, mRNA relative expression of immune makers (j) and lipid metabolic (k) genes in the eWAT. lo, Analysis of the microbiota in the caecal content: beta-diversity based on weighted UniFrac distances (l), observed ASVs (m), Shannon diversity index (n) and Inverse Simpson index (o). pr, Normalized abundance of Akkermansia muciniphila (p), Mucispirillum spp. (q) and Ruminococcaceae_UBA1819 spp. (r). Control, HFHSD and HFHSD + P. faecium n = 8 and HFHSD + P. faecium + GW2580 n = 7. Values are presented as mean ± s.e.m. of n biological replicates shown as individual dots. Significant differences were assessed using one- or two-way ANOVA or Kruskal–Wallis test followed by the corresponding post hoc test. Non-parametric methods were applied for statistical analysis of alpha diversity and differential abundance analysis was performed using the DESeq2 v.1.36 R package. The resulting P values were corrected using the Benjamini–Hochberg (BH) FDR procedure; *P < 0.05. In h, ‘*’ is used when compared to the control diet and ‘#’ when compared to HFHSD. *P < 0.05, **P < 0.01, ***P < 0.001, ****P < 0.0001 and #P < 0.05. Source data
Fig. 6
Fig. 6. P. faecium DSM 32890 directly promotes M2-macrophage polarization via TLR2.
a, Schema of in vitro experiments. b, Arg1, CD206 and CD163 percentages of MHC-II+CD11c+CD11bhigh CD115+ in BMDMØ cell cultures (n = 9). c, Cytokine levels in the BMDMØ culture supernatants (n = 8). d, mRNA relative expression of TLRs in BMDMØ cultures exposed to PBS (grey) or P. faecium (green) for 6 h (n = 8). e, Relative NF-kB activation in response to different P. faecium concentrations in HEK293-Blue-hTLR2 cells (n = 6). f, Arg1, CD206 and CD163 percentages of MHC-II+CD11c+CD11bhigh CD115+ in BMDMØ cell cultures co-exposed to P. faecium (1:10 cell/bacteria ratio) and/or anti-TLR2 (1 μg ml−1) (n = 12). g, mRNA relative expression of genes in intestinal ILC1 cultures exposed to control BMDMØ supernatants (MO-control n = 8) or supernatants of P. faecium DSM 32890 primed BMDMØ (MO-P. faecium n = 10) for 6 h. h, Cytokine levels in the ILC1 culture supernatant (n = 8). i, mRNA relative expression of indicated genes of intestinal ILC1 cultures challenged with P. faecium DSM 32890 for 6 h (n = 8). Values are presented as mean ± s.e.m. of n biological replicates shown as individual dots. Significant differences were assessed using unpaired Student’s t-test (two-sided), one-way ANOVA (e) or two-way ANOVA (f) followed by a post hoc Tukey’s test. *P < 0.05, **P < 0.01, *** P < 0.001 and ****P < 0.0001. Source data
Extended Data Fig. 1
Extended Data Fig. 1. Meta-analysis of association of Phascolarctobacterium species with BMI in a large-scale human cohort.
(a) Forest plot of a random effect meta-analysis of the presence of the species P. succinatutens (3,938 normal-weighted participants and 2,565 overweight). (b) Forest plot of a random effect meta-analysis of the presence of the species of Phascolarctobacterium spp. ET69 (3,486 normal-weighted participants and 2,088 overweight). Study name, sample sizes, and nationalities are reported. The overall logistic regression meta-analysis significance was assessed through two-tailed standard t-test against the null-hypothesis of a zero effect-size. Binomial tests assess the overproportion of single-datasets tests leaning toward one side of the plot assuming an expected proportion of 50%. Values are presented as mean ± 95% confidence intervals.
Extended Data Fig. 2
Extended Data Fig. 2. P. faecium mitigates the metabolic disturbances triggered by an obesogenic diet.
(a) Cholesterol concentration in plasma (mg/dL) and (b) the homeostatic model assessment for insulin resistance (HOMA-IR) index, (c) Body weight evolution, (d) body weight gain (g) (e) Fasting glucose (mg/dL). Values presented are mean ± s.e.m. Control and HFHSD n = 10, HFHSD + P. faecium n = 9 (A and B); HFHSD and HFHSD + P. faecium n = 5, HFHSD + P. succinatutens n = 4 (c–e). Data points show measurements from each mouse sample. Significant differences were assessed by one- or two-way ANOVA followed by a post-hoc Tukey test. Asterisk (*) represent statistical significance at *p < 0.05, **p < 0.01, and **** p < 0.0001. Source data
Extended Data Fig. 3
Extended Data Fig. 3. P. faecium exerts metabolic benefits by polarizing M2 macrophages.
(a) Body weight gain (g), (b) weight (g) of epididymal white adipose tissue (eWAT), (c) blood glucose levels after an oral load of glucose (2 g/kg) and (d) area under the curve (AUC) at week 10 of intervention. (e) ratio of M1 to M2 macrophages (f) mRNA relative expression of indicated genes in the small intestine, (g) fasting glycemia (mg/dL), (h) mean relative abundance by group of the 15 most abundant genera/families, (i) Beta-diversity based on weighted UniFrac distances. Values are presented as mean (Control, HFHSD and HFHSD + P. faecium n = 8; HFHSD + P. faecium + GW2580 and HFHSD + GW2580 n = 7) ± s.e.m. Data points show measurement s from each individual mouse sample. Significant differences were assessed by one- or two-way ANOVA. Differential abundance analysis was performed using the DESeq2 v.1.36R package. Asterisk (*) represent statistical significance at *p < 0.05, **p < 0.01, ***p < 0.001 and ****p < 0.0001. Source data
Extended Data Fig. 4
Extended Data Fig. 4. Gating strategy for flow cytometry analysis.
After single-cell gating of different intestinal immune populations: (a) Innate lymphoid cells group 1 (ILC1) isolated from the small intestine epithelium were characterized as Lin-T-bet+ IFN-γ+ cells. Commercial BD PerCP-Cy™5.5 Mouse Lineage Antibody Cocktail was used for lineage containing: CD3ε, CD45R/B220, Ter119, Gr1,Ly6c, Cd11b. (b) Macrophages isolated from small intestine lamina propria were characterized as pro-inflammatory macrophages (M1): F4/80 + CD80+ iNOS+ cells and alternative activated macrophages (M2): F4/80 + CD206+ Arg1+ cells, (c) Intraepithelial lymphocytes (IELs) isolated from the small intestine epithelium were characterized as induced IELs: CD45 + CD3 + CD2 + CD5 + TCRαβ+ cells and natural IELs: CD45 + CD3 + CD2-CD5-TCRγδ+, (d) T regulatory cells (T reg) isolated from the small intestine lamina propria were characterized as: CD19-CD3 + CD4 + CD25+Foxp3+ cells.
Extended Data Fig. 5
Extended Data Fig. 5. Gating strategy for flow cytometry analysis and cell sorting.
(a) Bone marrow-derived macrophages (BMDMØ) were characterized as CD11c+CD11bhighMHC-II + CD115+ cells and polarization to M2 was determined by the expression of Arg-1, CD206 and/or CD163. (b) Sorted Innate lymphoid cells group 1 (ILC1) isolated from the small intestine were defined as CD45.2+Lin-CD127 + CD90.2 + NK1.1 + NKp46+ cells. The lineage cocktail included: CD3ε, CD8a, CD19, Ter119, Cd11c, TCRb, TCRgd, Gr1, Cd11b.

References

    1. World Health Organization. Obesity and overweight. Fact sheetshttps://www.who.int/news-room/fact-sheets/detail/obesity-and-overweight (accessed 24 January 2023).
    1. Zhou, H., Urso, C. & Jadeja, V. Saturated fatty acids in obesity-associated inflammation. J. Inflamm. Res.13, 1–14 (2020). - PMC - PubMed
    1. Amabebe, E. et al. Microbial dysbiosis-induced obesity: role of gut microbiota in homoeostasis of energy metabolism. Br. J. Nutr.123, 1127–1137 (2020). - PubMed
    1. Khan, S. et al. Emerging concepts in intestinal immune control of obesity-related metabolic disease. Nat. Commun.12, 2598 (2021). - PMC - PubMed
    1. Rohm, T. V. et al. Obesity in humans is characterized by gut inflammation as shown by pro-inflammatory intestinal macrophage accumulation. Front. Immunol.12, 668654 (2021). - PMC - PubMed

LinkOut - more resources