. 2025 Jun;26(6):947-962.
doi: 10.1038/s41590-025-02146-2. Epub 2025 May 6.

Immune-epithelial-stromal networks define the cellular ecosystem of the small intestine in celiac disease

Affiliations

Immune-epithelial-stromal networks define the cellular ecosystem of the small intestine in celiac disease

Michael E B FitzPatrick et al. Nat Immunol. 2025 Jun.

Abstract

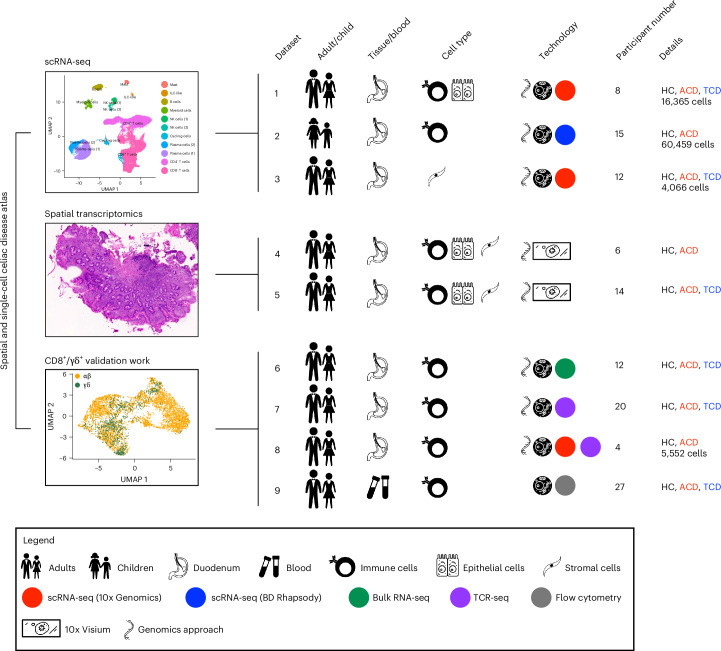
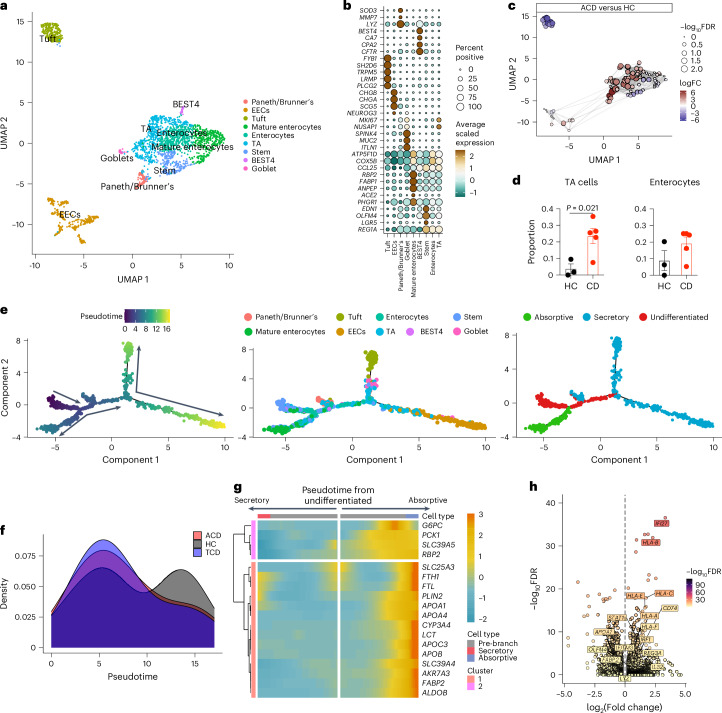
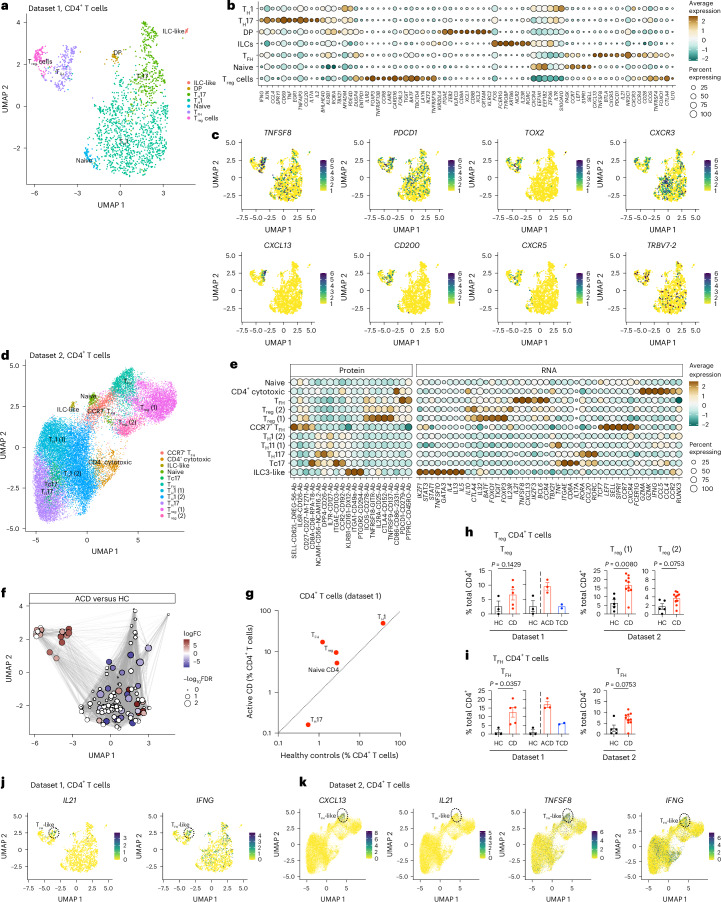
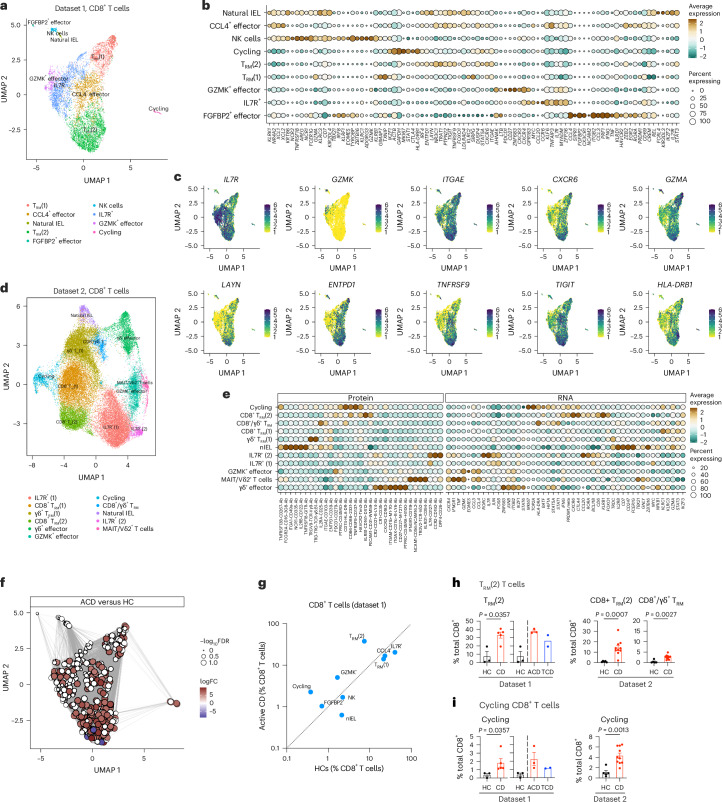
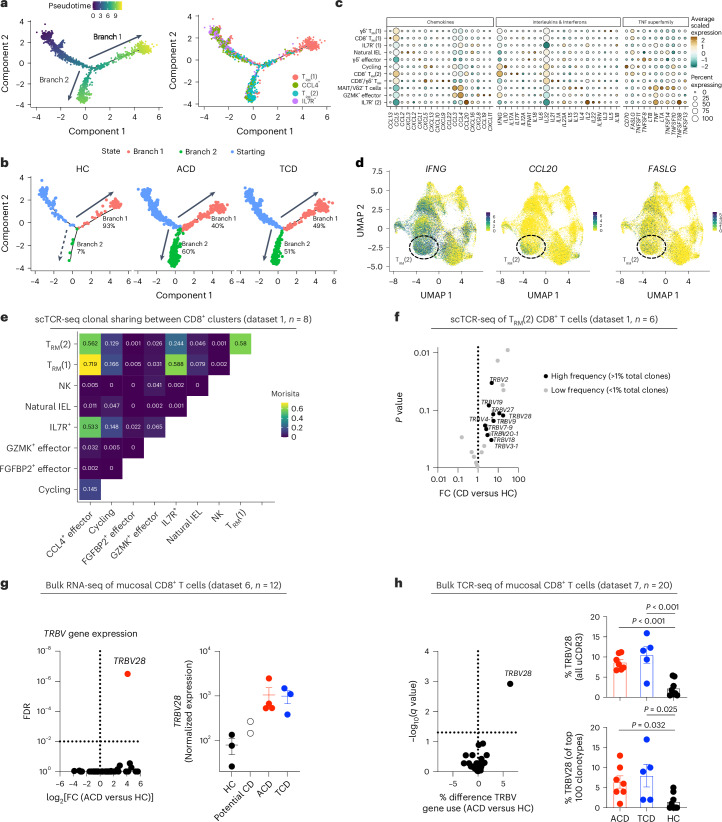
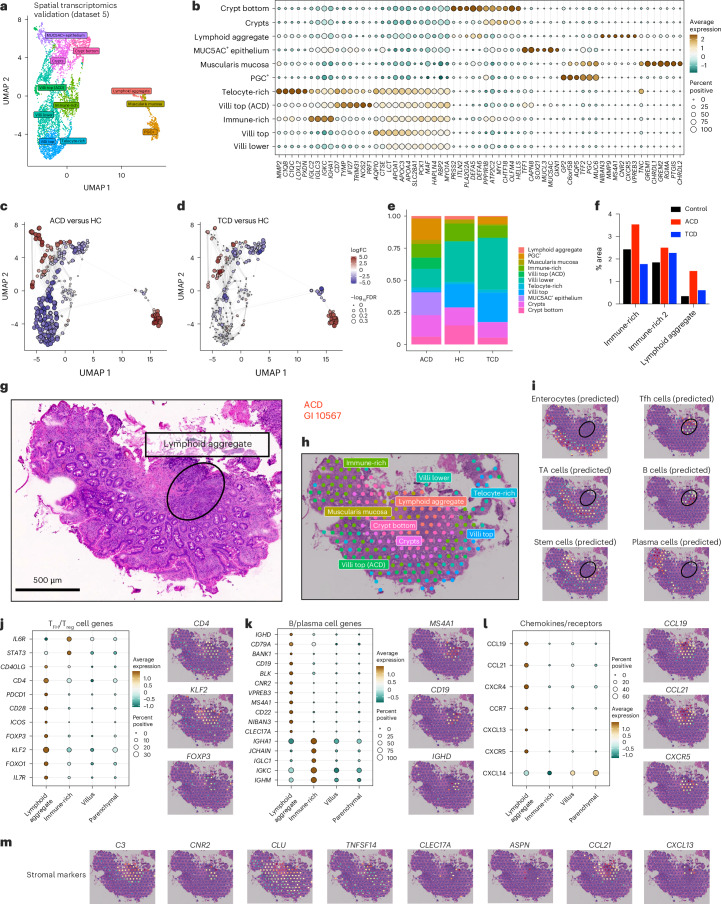
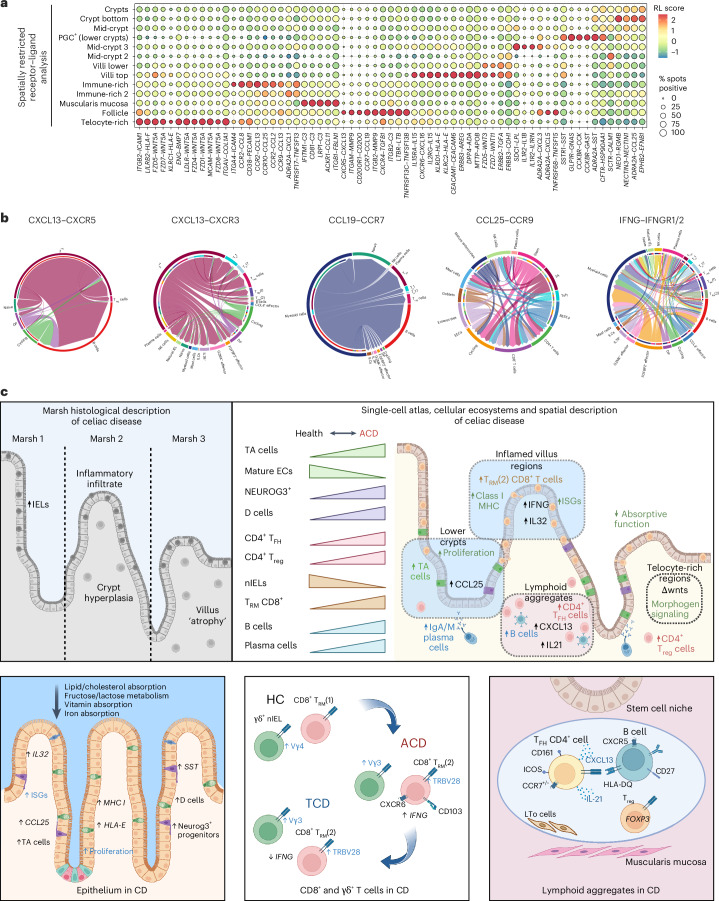
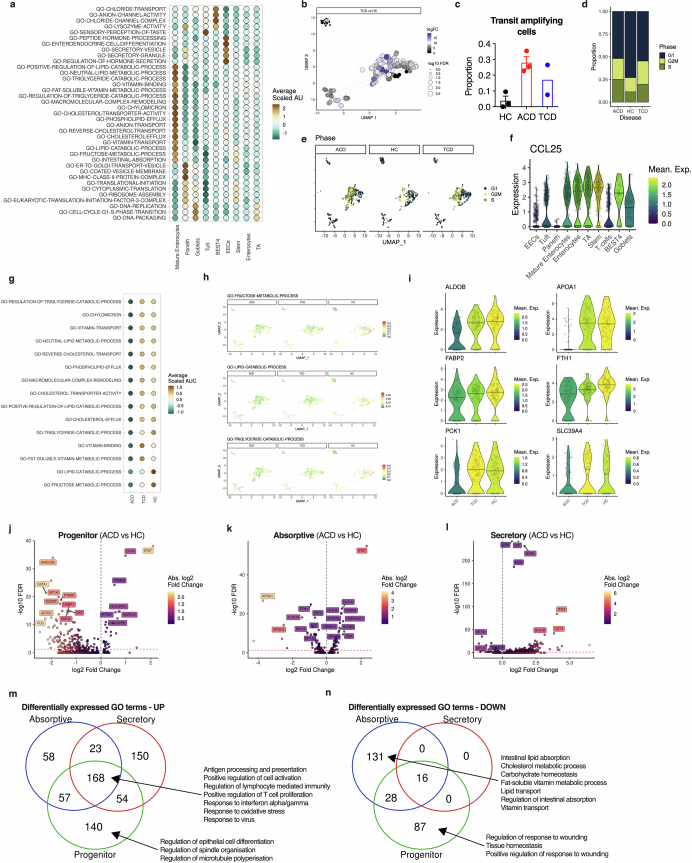
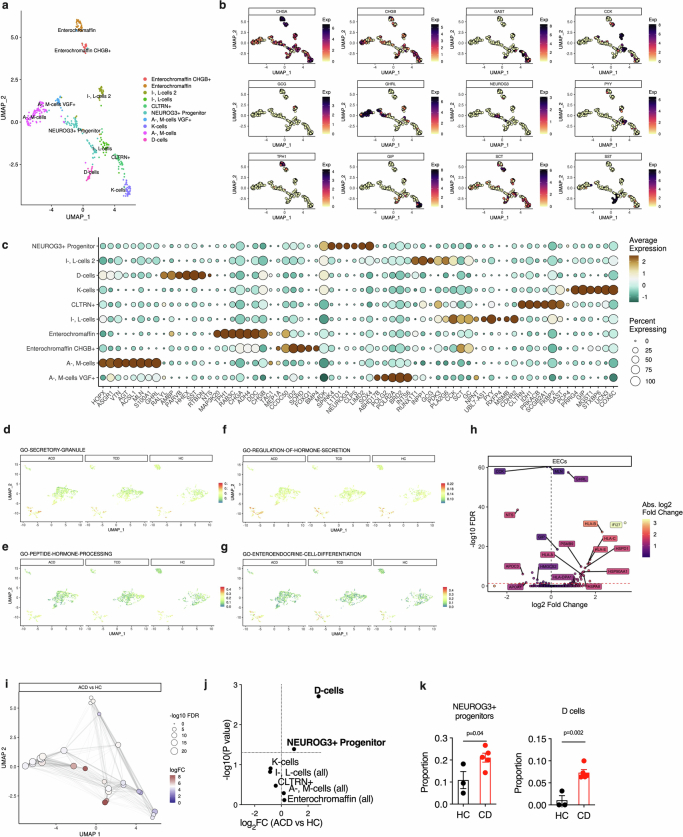
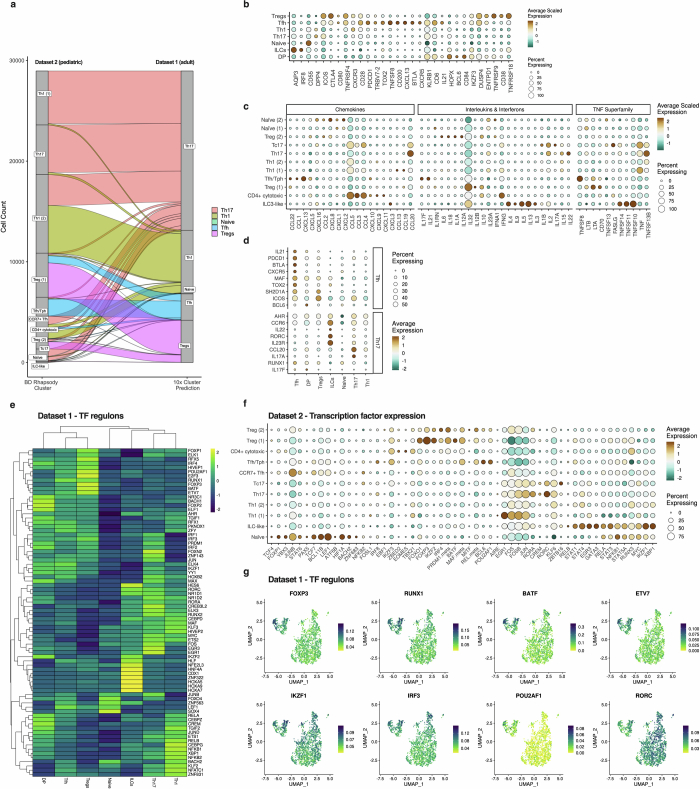
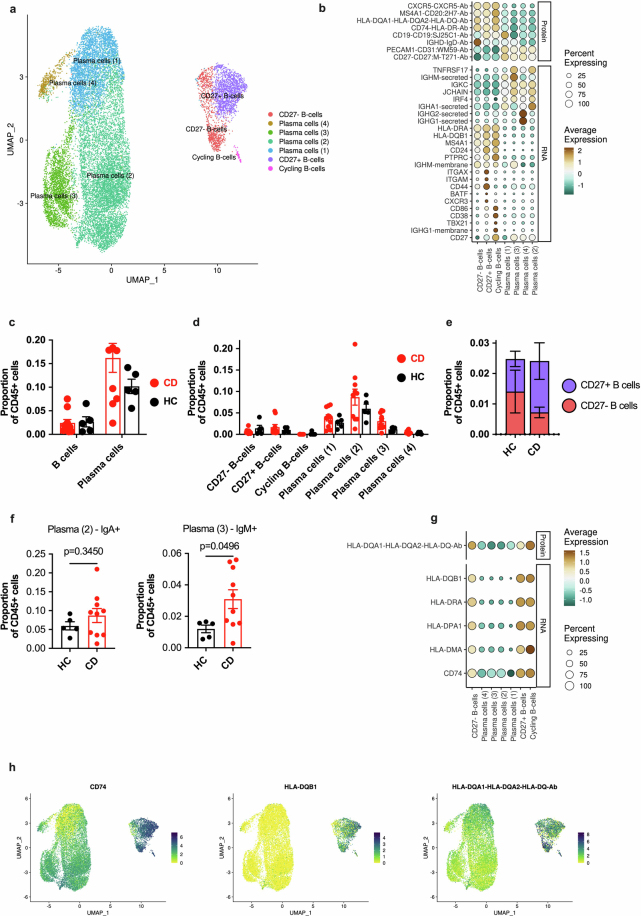
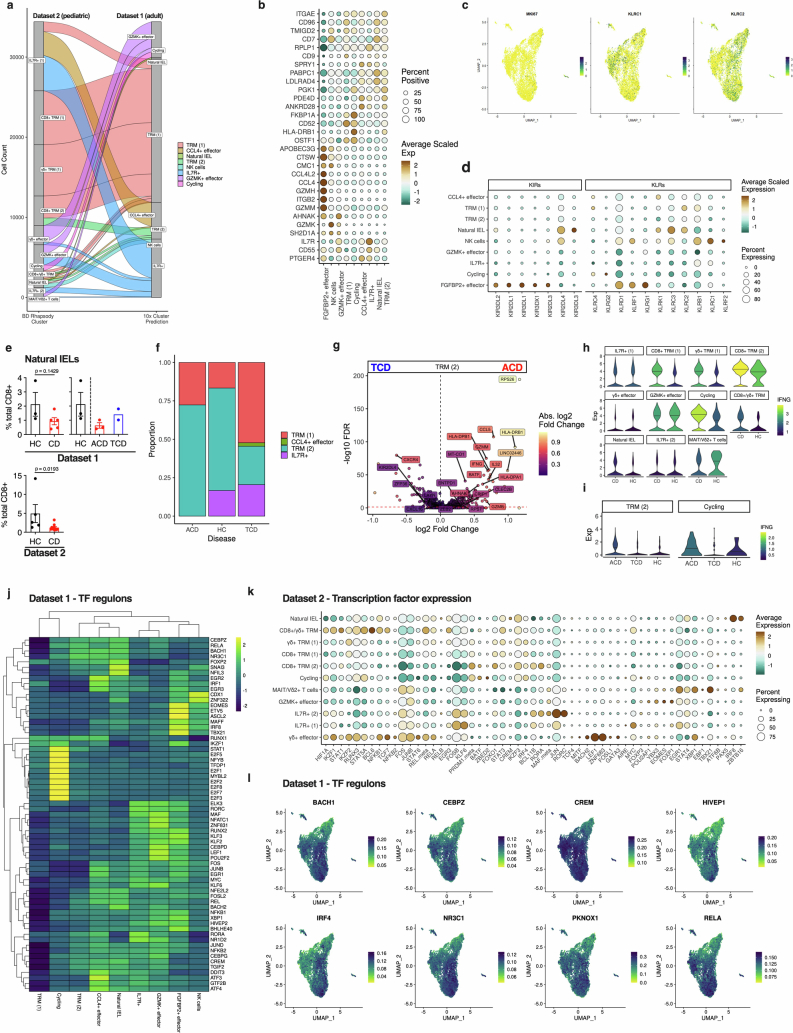
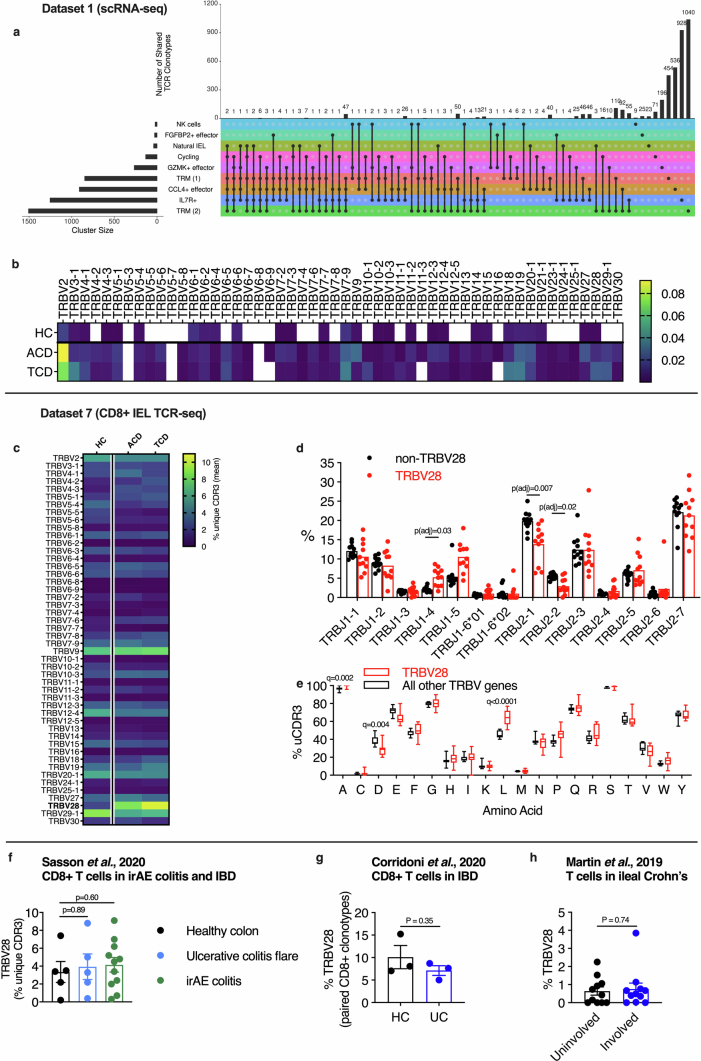
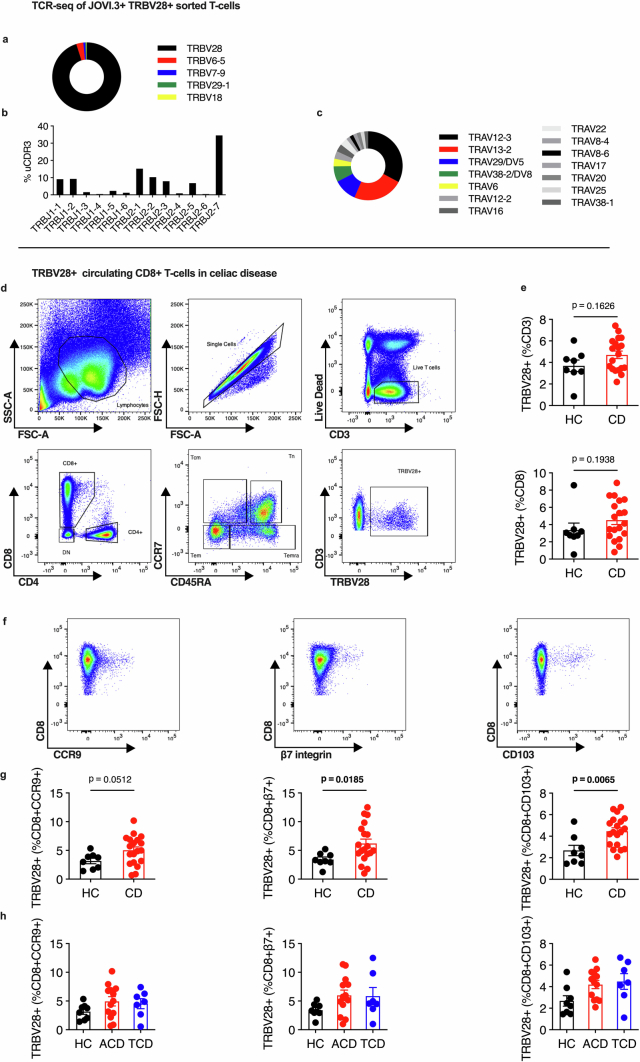
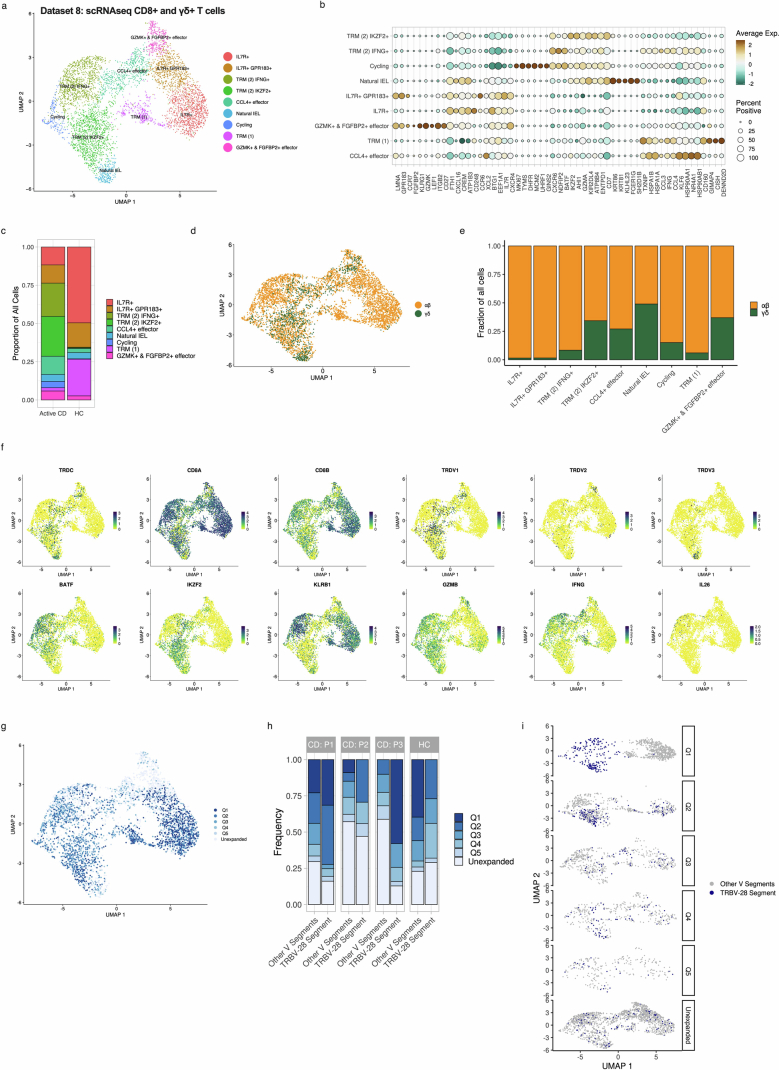
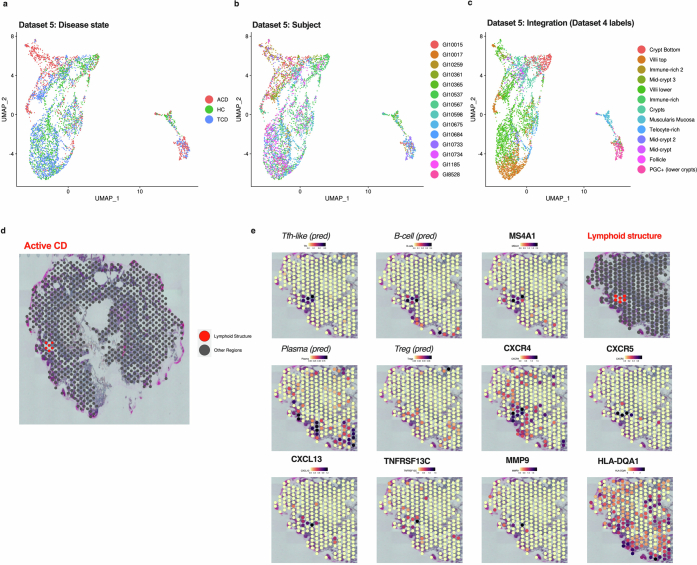
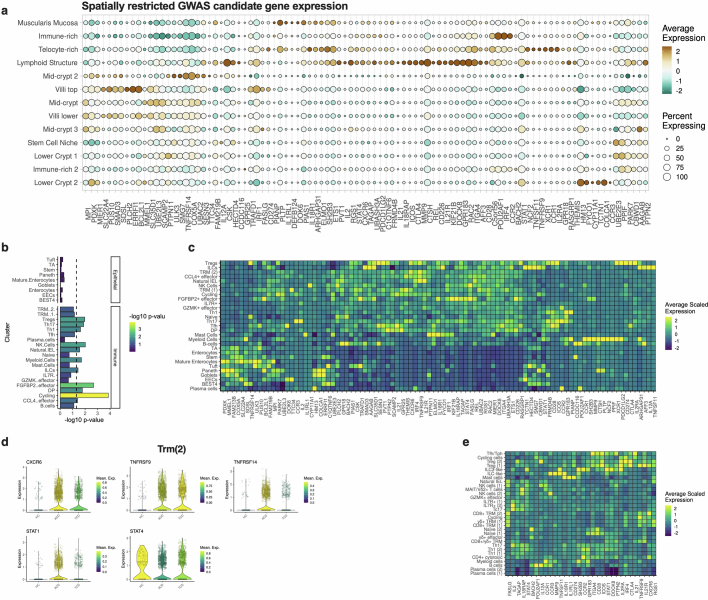
The immune-epithelial-stromal interactions underpinning intestinal damage in celiac disease (CD) are incompletely understood. To address this, we performed single-cell transcriptomics (RNA sequencing; 86,442 immune, parenchymal and epithelial cells; 35 participants) and spatial transcriptomics (20 participants) on CD intestinal biopsy samples. Here we show that in CD, epithelial populations shifted toward a progenitor state, with interferon-driven transcriptional responses, and perturbation of secretory and enteroendocrine populations. Mucosal T cells showed numeric and functional changes in regulatory and follicular helper-like CD4+ T cells, intraepithelial lymphocytes, CD8+ and γδ T cell subsets, with skewed T cell antigen receptor repertoires. Mucosal changes remained detectable despite treatment, representing a persistent immune-epithelial 'scar'. Spatial transcriptomics defined transcriptional niches beyond those captured in conventional histological scores, including CD-specific lymphoid aggregates containing T cell-B cell interactions. Receptor-ligand spatial analyses integrated with disease susceptibility gene expression defined networks of altered chemokine and morphogen signaling, and provide potential therapeutic targets for CD prevention and treatment.


Conflict of interest statement

Competing interests: M.E.B.F. consults for Takeda Pharmaceuticals. N.M.P. has consulted for Infinitopes. D.R. is an employee of Janssen Immunology. D. Aschenbrenner is an employee of Novartis Institute of BioMedical Research. S.A.T. is a scientific advisory board member of ForeSite Labs, OMass Therapeutics, Qiagen and Xaira Therapeutics, a cofounder and equity holder of TransitionBio and Ensocell Therapeutics, a non-executive director of 10x Genomics, and a part-time employee of GlaxoSmithKline. J.A.T. consults for GSK, Vesalius, Avammune, Azenta, Dasman Diabetes Institute and Immunocore. P.K. has consulted for AZ, Infinitopes and UCB, and received research funding from Immunocore, all on unrelated projects. The other authors declare no competing interests.

Figures

Fig. 1
Fig. 1. Study schematic.
Schematic of scRNA-seq, RNA-seq, TCR-seq, spatial transcriptomics, and flow cytometry experiments and datasets. Dataset 1: ECs and total mucosal CD45+ cells were isolated from intestinal biopsy samples before scRNA-seq library preparation using the 10x Genomics platform. Dataset 2: total mucosal CD45+ cells were isolated from intestinal biopsy samples before combined targeted scRNA-seq and multiplex surface antibody characterization using the BD Rhapsody platform. Dataset 3: scRNA-seq (10x Genomics) was performed on intestinal stromal and endothelial cells. Datasets 4 and 5: OCT-embedded frozen duodenal biopsy samples were sectioned and used for spatial transcriptomics (10x Visium). Datasets 6 and 7: mucosal CD8+ T cells were isolated before bulk RNA-seq and TCR-seq. Dataset 8: mucosal CD8+ and γδ+ T cells were isolated before scRNA-seq library preparation using the 10x Genomics platform. Dataset 9: flow cytometry of circulating CD8+ T cells. Study participant numbers and disease characteristics, as well as cell numbers after the quality-control pipeline, are indicated. ILC, innate lymphoid cell; HC, healthy controls; ACD, active celiac disease; TCD, treated celiac disease.
Fig. 2
Fig. 2. ECs in CD.
a, UMAP plot of small intestinal epithelial EPCAM+ cells in HCs (n = 3) and in participants with CD (n = 5). b, Bubble plot showing the expression of selected genes defining specific cluster identities. Scaled gene expression indicated by color; proportion of cells expressing the gene indicated by bubble size. c, Local neighborhood enrichment of EPCAM+ cells in ACD versus HCs. Color indicates enrichment (log fold change (FC)) of cells in ACD versus HCs in that UMAP neighborhood; size of dot indicates false discovery rate (FDR)-adjusted −log10 values. d, TA cells (left) and early enterocytes (right) in HCs and CD, as a proportion of total EPCAM+ cells. e, Pseudotime trajectory of gene expression of EPCAM+ ECs, colored by pseudotime axis (left), cluster identity (middle) and lineage (right). Arrows indicate putative direction of cell differentiation. f, Density of cells along pseudotime trajectory axis split by disease state: ACD (red), TCD (blue) and HCs (gray). g, Smoothed heat map showing expression of selected genes related to intestinal absorption along pseudotime trajectories relating to secretory (toward left) and absorptive (toward right) lineage. h, Volcano plot displaying differentially expressed gene transcripts between HCs and ACD in total ECs. d, Unpaired two-tailed t-test. Data are presented as mean values ± s.e.m.
Fig. 3
Fig. 3. CD4+ T cells in CD.
ac, Intestinal CD4+ T cells in health and CD in dataset 1 (adult—10x Genomics). a, UMAP plot of intestinal CD4+ T cells in health and CD (n = 8). b, Bubble plot showing the expression of selected genes defining specific cluster identities. Scaled gene expression indicated by color; proportion of cells expressing the gene indicated by bubble size. c, CD4+ T cell UMAP plots overlaid with expression of TNFSF8, PDCD1, TOX2, CXCR3, CXCL13, CD200, CXCR5 and TRBV7-2. Intestinal CD4+ T cells in health and CD in dataset 2 (pediatric—BD Rhapsody; df). d, UMAP plot of intestinal CD4+ T cells in health and CD (n = 15). e, Bubble plot showing the expression of selected genes and proteins defining specific cluster identities. Scaled gene/protein expression indicated by color; proportion of cells expressing the gene/protein indicated by bubble size. f, Local neighborhood enrichment of CD4+ cells in ACD versus HCs (dataset 1). Color indicates enrichment (log fold change) of cells in ACD versus HCs in that UMAP neighborhood; size of dot indicates −log10FDR. g, Scatterplot of mean proportion (± s.e.) of CD4+ T cell clusters in HCs (n = 3) versus ACD (n = 5) in dataset 1. Clusters above the line of unity are enriched in ACD. h,i, Treg (h) and TFH (i) CD4+ T cell populations in HCs and CD, as a proportion of total CD4+ T cells in dataset 1 (HCs n = 3, ACD n = 5) and dataset 2 (HCs n = 5, ACD n = 10). j, UMAP plot of CD4+ T cells in dataset 2, overlaid with IL21 and IFNG expression. k, UMAP plot of CD4+ T cells in dataset 1, overlaid with CXCL13, IL21, IFNG and TNFSF8 expression. h,i, Two-sided Mann–Whitney test. Data are presented as mean values ± s.e.m. Ab, antibody; Tc17, IL17+CD8+ T cells; DP, CD4+CD8+ double positive cells.
Fig. 4
Fig. 4. CD8+ T cells in CD.
ac, Dataset 1 intestinal CD8+ T cells in health and CD (adult—10x Genomics). a, UMAP plot of intestinal CD8+ T cells in health and CD (n = 8). b, Bubble plot showing the expression of selected genes defining specific cluster identities. Scaled gene expression indicated by color; proportion of cells expressing the gene indicated by bubble size. c, UMAP plots overlaid with expression of IL7R, GZMK, ITGAE, CXCR6, GZMA, LAYN, ENTPD1, TNFRSF9, TIGIT and HLA-DRB1. Dataset 2 intestinal CD8+ T cells in health and CD (pediatric—BD Rhapsody; df). d, UMAP plot of intestinal CD8+ T cells in health and CD (n = 15). e, Bubble plot showing the expression of selected genes and proteins defining specific cluster identities. Gene/protein expression indicated by color; proportion of cells expressing the gene/protein indicated by bubble size. f, Local neighborhood enrichment of CD8+ cells in ACD versus HCs (dataset 1). Color indicates enrichment (log fold change) of cells in ACD versus HCs in that UMAP neighborhood; size of dot indicates −log10FDR. g, Scatterplot of mean proportion (± s.e.) of CD8+ T cell clusters in HCs (n = 3) versus ACD (n = 5). Clusters above the line of unity are enriched in ACD. h,i, TRM(2) (h) and cycling (i) CD8+ T cell phenotype populations in HCs and CD, as a proportion of total CD8+ T cells in dataset 1 (HCs n = 3, ACD n = 5) and dataset 2 (HCs n = 5, ACD n = 10). h,i, Two-sided Mann–Whitney test. Data are presented as the mean values ± s.e.m. nIEL, natural intraepithelial lymphocyte.
Fig. 5
Fig. 5. CD8+ T cells in CD.
a, Pseudotime trajectory of gene expression of tissue-resident CD8+ T cell clusters (dataset 1—adult), colored by pseudotime axis (left) and cell cluster (right). Arrows indicate direction of differentiation. b, Pseudotime trajectory, split by disease state, and colored by differentiation branch. The proportion of CD8+ TRM cells differentiating down branches 1 and 2 in each disease state is indicated. c, Bubble plot of expression of chemokine, cytokine and TNF family member genes by CD8+ T cell clusters in dataset 2 (pediatric). Scaled gene expression indicated by color; proportion of cells expressing the gene indicated by bubble size. d, UMAP plots of CD8+ T cells in dataset 2 (pediatric), overlaid with IFNG, CCL20 and FASLG expression. e, TCR clonal overlap (Morisita–Horn) between CD8+ T cell clusters in dataset 1. f, Volcano plot of TRBV segment usage within the TCR repertoire of TRM(2) cells between HCs and CD. Black, high-frequency TRBV segments used by >1% of total clones; gray, low-frequency TRBV segments used by <1% of total clones. g, Volcano plot of TRBV segment gene expression (left) and normalized expression of TRBV28 (right) in bulk RNA-seq data from sorted intraepithelial CD8+ T cells (dataset 3; HCs n = 3, ACD n = 4, TCD n = 3, potential CD n = 2). h, Volcano plot of TRBV segment usage (left), and proportion of unique CDR3β clonotypes (right above) and proportion of top 100 most common clonotypes (right, below) using the TRBV28 V segment in bulk TCR-seq of CD8+ mucosal T cells in HCs and CD (dataset 4; HCs n = 8, ACD n = 7, TCD n = 5). f, Negative binomial model without multiple comparisons. g, Negative binomial model with Benjamini–Hochberg multiple testing. h, One-way analysis of variance with Holm–Sidak’s multiple-comparisons test.
Fig. 6
Fig. 6. Spatial transcriptomics of the intestinal mucosa reveals localized patterns of immune cell distribution.
a, UMAP overlay of all spatial transcriptomics tissue-covered spots with transcriptome-driven clustering analysis, colored by region. b, Bubble plot showing the expression of selected genes defining spatial regions. Scaled gene expression indicated by color; proportion of cells expressing the gene indicated by bubble size. c, Visualization of transcriptionally distinct spatial regions overlaid on representative HC tissue section. d, Proportion of intestinal mucosa formed in different regions in HCs (above) and ACD (below). Immune-rich and LA regions are highlighted. e, Local neighborhood enrichment of intestinal mucosal regions in ACD versus HCs. Color indicates enrichment (log fold change) of cells in ACD versus HCs in that UMAP neighborhood. f, Volcano plot of differential gene expression between HCs and ACD within villus tip spatial regions. g, The spatial relationships between different regions in ACD can be visualized using a network plot. Regions that are more likely to be adjacent to another region are connected by arrows colored by the percentage of adjacent spots. Region size is indicated by size and color of the region circle. h, Integrating scRNA-seq reference data localizes single-cell transcriptomes to spatial regions. These data are used to generate network plots visualizing colocalization of cell types together in ACD. Cell-type nodes close together and linked by connecting lines are more often located in the same spots. In ACD, mature enterocytes colocalize with TRM(2) CD8+ T cells (lower red box), while TFH-like CD4+ T cells localize with B cells, Treg cells and plasma cells (upper red box).
Fig. 7
Fig. 7. TFH–B cell interactions are highly localized in LAs in the celiac lesion.
a, UMAP overlay of all spatial transcriptomics tissue-covered spots with transcriptome-driven clustering analysis, colored by region. b, Bubble plot showing the expression of selected genes defining spatial regions. Scaled gene expression indicated by color; proportion of cells expressing the gene indicated by bubble size. c,d, Local neighborhood enrichment of intestinal mucosal regions in ACD versus HCs (c) and TCD versus HCs (d). Color indicates enrichment (log fold change) of cells in CD versus HCs in that UMAP neighborhood. e, Proportion of intestinal mucosa formed in different regions in HCs, ACD and TCD. f, Proportion of immune-rich and LA regions in HCs, ACD and TCD. g,h, Detailed examination of a representative LA in ACD (seen in 5/10 CD sections). g, Hematoxylin and eosin (H&E)-stained section of duodenal biopsy with LA circled. h, Spatial regions overlaid onto the section show the LA near the lower-crypt/stem-cell niche region, and near the muscularis mucosa. i, Predicted cell-type locations in regions overlaid onto the section. jl, Bubble plots of gene expression within LAs and other regions, paired with gene expression overlaid onto an ACD section with LA, including TFH/Treg cell gene signatures (j), B/plasma cell gene signatures (k), and chemokines and associated receptors (l). m, Stromal cell gene expression overlaid onto a representative ACD section with LA.
Fig. 8
Fig. 8. A spatially resolved model of mucosal immunological responses in CD.
a, Bubble plot of region-specific receptor–ligand expression within the duodenal mucosa. Scaled receptor–ligand (RL) expression indicated by color; proportion of regions expressing the receptor–ligand genes indicated by bubble size. b, Circos plots of selected receptor–ligand pair expression between cell types in CD (dataset 1). c, A proposed schematic for the spatially resolved cellular ecosystems within the duodenal mucosa in CD. LTo, lymphoid tissue organizer. Figure created with BioRender.com.
Extended Data Fig. 1
Extended Data Fig. 1. Epithelial cells in celiac disease.
(a) Bubble plot showing the expression of selected GO term gene sets defining specific cluster identities and functions. Gene set expression indicated by colour. (b) Local neighbourhood enrichment of EPCAM+ cells in treated CD vs healthy controls (HC). Colour indicates enrichment (log fold change) of cells in active CD vs HC in that UMAP neighbourhood, size of dot indicates –log10FDR. (c) Transit amplifying cells in HC (n = 3), active CD (n = 3), and treated CD n = 2), as a proportion of total EPCAM+ cells (mean ± SEM). (d) Proportion of EPCAM+ cells in predicted cell cycle states (G1, G2M, S), stratified by disease state. (e) UMAP overlay of predicted cell cycle states (G1, G2M, S), stratified by disease state. (f) Violin plot of CCL25 expression by epithelial cell type. (g) Expression of GO term gene sets associated with metabolic and absorptive function in mature enterocytes, stratified by disease state. (h) UMAP overlay of expression of selected GO term gene sets associated with metabolic and absorptive function, stratified by disease state. (i) Violin plots of expression of genes associated with absorptive function in mature enterocytes, stratified by disease state. (j–l) Volcano plots displaying differentially expressed gene transcripts between HC and active CD in the three cell lineages: epithelial progenitors (i), absorptive cells (j), and secretory cells (k). (m, n) Venn diagrams showing shared differentially expressed GO term gene sets between progenitor, absorptive, and secretory lineages, either upregulated (l) or downregulated (m) in active CD compared to HC.
Extended Data Fig. 2
Extended Data Fig. 2. Enteroendocrine cells in celiac disease.
(a) UMAP plot of intestinal enteroendocrine cells (EECs) in healthy controls (HC) and celiac disease (CD) (n = 8). (b) UMAP plots overlaid with expression of genes identifying enteroendocrine cell types. (c) Bubble plot showing the expression of selected genes defining specific cluster identities. Gene expression indicated by colour, proportion of cells expressing the gene indicated by bubble size. (d–g) UMAP overlay of expression of selected GO term gene sets associated with peptide hormone secretion and enteroendocrine differentiation, stratified by disease state. (h) Volcano plot displaying differentially expressed gene transcripts between HC and active CD in enteroendocrine cells. (i) Local neighbourhood enrichment of enteroendocrine cells in treated CD vs HC. Colour indicates enrichment (log fold change) of cells in active CD vs HC in that UMAP neighbourhood, size of dot indicates –log10FDR. (j) Volcano plot of enteroendocrine subset proportion (log2 fold change) between CD and HC. (k) NEUROG3+ progenitors and D cells in HC (n = 3) and CD (n = 5), as a proportion of total enteroendocrine cells (mean ± SEM). Unpaired two-tailed t-test.
Extended Data Fig. 3
Extended Data Fig. 3. CD4+ T cells.
(a) Sankey plot showing predicted analogous CD4+ T-cell clusters between Dataset 1 and Dataset 2 datasets. (b) Bubble plot showing the expression of selected genes associated with CD4+ T-cells clusters, including genes previously associated with gluten-specific CD4+ T-cells (Christophersen et al, 2019). Gene expression indicated by colour, proportion of cells expressing the gene indicated by bubble size. (c) Bubble plot of expression of chemokine, cytokine, and TNF family member genes by CD4+ T-cell clusters in Dataset 2 dataset. Gene expression indicated by colour, proportion of cells expressing the gene indicated by bubble size. (d) Bubble plot showing expression of canonical Tfh and Th17 gene signatures in CD4 + T cell clusters. (e) Heatmap of transcription factor (TF) regulon expression by CD4+ T-cell clusters in Dataset 1. (f) Transcription factor gene expression by CD4+ T-cell clusters in Dataset 2. (g) UMAP plots of CD4+ T-cells in Dataset 1, overlaid with expression of selected TF regulons.
Extended Data Fig. 4
Extended Data Fig. 4. B cell and plasma cells in celiac disease.
B cell and plasma cell clusters were examined in the Dataset 2 (pediatric) dataset (BD Rhapsody) in healthy controls (HC) (n = 5) and CD (n = 10). (a) UMAP plot of intestinal B and plasma cell clusters. (b) Bubble plot showing the expression of selected genes and surface proteins defining specific cluster identities. Gene/protein expression indicated by colour, proportion of cells expressing the gene indicated by bubble size. (c) Intestinal B cell and plasma cell frequencies in HC and CD, as a proportion of total CD45+ cells. (d) Intestinal B cell and plasma cell cluster frequencies in HC and CD, as a proportion of total CD45+ cells. (e) Proportion of intestinal CD27- and CD27 + B cells in HC and CD, as a proportion of total CD45+ cells. (f) Proportion of intestinal IgA and IgM plasma cells in HC and CD, as a proportion of total CD45+ cells. (g) Bubble plot showing the expression of genes and proteins related to MHC class II expression. (h) UMAP plots overlaid with the expression of genes CD74 and HLA-DQB1, and the surface protein expression of HLA-DQA1/A2. (c-f) Data presented as mean ± SEM. (f) Unpaired two-tailed t-test.
Extended Data Fig. 5
Extended Data Fig. 5. CD8+ T cells in celiac disease.
(a) Sankey plot showing predicted analogous CD8+ T-cell clusters between Dataset 1 and Dataset 2 datasets. (b) Bubble plot showing the expression of selected genes associated with CD8+ TRM cell subsets. Gene expression indicated by colour, proportion of cells expressing the gene indicated by bubble size. (c) UMAP plot of CD8+ T-cells in Dataset 1, overlaid with MKI67, KLRC1, and KLRC2 expression. (d) Bubble plot showing the expression of KIRs and NKRs associated with previously described CD8+ T-cell subsets in CD. (e) Natural IEL populations in HC (n = 3) and CD (n = 5), as a proportion of total CD8+ T-cells in Dataset 1 (above) and Dataset 2 (below) (mean ± SEM). (f) Stacked plot of predicted CD8+ T-cell cluster origin of cycling CD8+ T-cells, stratified by disease state. (g) Volcano plot displaying differentially expressed gene transcripts between active and treated CD in TRM(2) CD8+ cells. (h) Violin plot of IFNG expression in CD8+ clusters in Dataset 2, split by disease state. (i) Violin plot of IFNG expression in TRM(2) and cycling CD8+ clusters in Dataset 1, split by disease state. (j) Heatmap of transcription factor (TF) regulon expression by CD8+ T-cell clusters in Dataset 1. (k) Transcription factor gene expression by CD8+ T-cell clusters in Dataset 2. (l) UMAP plots of CD8+ T-cells in Dataset 1, overlaid with expression of selected TF regulons. (e) Unpaired two-tailed t-test.
Extended Data Fig. 6
Extended Data Fig. 6. CD8+ T cells and TCR repertoires in celiac disease.
(a, b) Single-cell TCR-seq of CD8+ T-cells in Dataset 1. (a) Upset plot of T-cell clonotype overlap between CD8+ T-cell clusters. (b) TRBV segment usage in TCR clonotypes in TRM(2) CD8+ T-cells. (c–e) TCR-seq of sorted mucosal CD8+ T-cells (n = 20; Dataset 4). (c) TRBV gene usage by unique CDR3 clonotypes in intestinal CD8+ T-cell TCR repertoires in health and celiac disease. (d) TRBJ gene usage by TRBV28 (red) and non-TRBV28 (black) clonotypes in intestinal CD8+ T-cell TCR repertoires in CD (n = 12) (mean ± SEM). (e) Amino acid usage within CDR3 sequences of TRBV28 (red) and non-TRBV28 (black) clonotypes in intestinal CD8+ T-cell TCR repertoires in CD (n = 12) (median, IQR, range). (f) Proportion of unique CDR3β clonotypes using the TRBV28 V-gene in health (n = 5), active ulcerative colitis (n = 5), and irAE colitis (n = 11) (mean ± SEM). Data from Sasson and colleagues. (g) Proportion of unique paired CD8+ clonotypes using the TRBV28 V-gene in health (n = 3) and active ulcerative colitis (n = 3) (mean ± SEM). Data from Corridoni and colleagues. (h) Proportion of unique paired T cell clonotypes using the TRBV28 V-gene in uninflamed (n = 11) and inflamed (n = 11) biopsies in ileal Crohn’s disease (mean ± SEM). Data from Martin and colleagues. (c, d, f) Two-way ANOVA with Holm-Sidak’s multiple comparisons test. (e) Multiple two-tailed t-tests with Benjamini, Krieger, and Yetutieli two-stage step up control of multiple comparisons with FDR < 0.01. (g,h) Mann-Whitney two-tailed test.
Extended Data Fig. 7
Extended Data Fig. 7. TRBV28 expression by circulating CD8+ T cells in celiac disease.
(a) TRBV gene usage (proportion of unique CDR3 clonotypes) of sorted CD3+ JOVI.3+ T-cells, determined by bulk TCR-seq. (b) TRBJ gene usage of TRBV28 clonotypes from sorted CD3+ JOVI.3+ T-cells. (c) TRAV gene usage (proportion of unique CDR3 clonotypes) of sorted CD3+ JOVI.3+ T-cells. Flow cytometry examining TRBV28 surface protein expression on circulating CD8 + T-cells in healthy controls (n = 8), active CD (n = 13), and treated CD (n = 7). (d) Representative flow cytometry gating strategy. (e) TRBV28 expression by total CD3+ T-cells (left) and total CD8+ T-cells (right) in peripheral blood in health and CD. (f) Representative plots of staining for CCR9, β7-integrin, and CD103. (g, h) TRBV28 expression by CCR9+ (left), β7-integrin+ (middle), and CD103+ (right) CD8+ T-cells in peripheral blood, categorised by health and CD (g), and by health, active and treated CD (h). (e,g) Mann-Whitney two-tailed test. (e,g,h) Mean ± SEM shown.
Extended Data Fig. 8
Extended Data Fig. 8. Single-cell analysis of mucosal αβ CD8+ and γδ T cells in celiac disease.
Sorted intestinal γδ+ and αβ + CD8+ T-cells in CD. (a) UMAP plot of intestinal CD4+ T-cells in health and CD (n = 4). (b) Bubble plot showing the expression of selected genes defining specific cluster identities. Scaled gene expression indicated by colour, proportion of cells expressing the gene indicated by bubble size. (c) Proportion of transcriptional clusters in HC and CD. (d) UMAP overlay and (e) stacked plots showing the proportion of γδ + T cells in each transcriptional cluster. (f) UMAP plot overlaid with the expression of genes of interest. (g) UMAP plot overlaid with the clonal expansion of TCR clones. Clonal expansion expressed as quintiles, with Q1 showing the most expanded clones. (h) Frequency of quintiles of clonal expansion in TCR sequences expressing TRBV28. (i) UMAP plot overlaid with TRBV28-expressing CD8 + TCR clonotypes, split by quintiles of clonal expansion.
Extended Data Fig. 9
Extended Data Fig. 9. Spatial transcriptomics.
(a–c) Dataset 5 spatial transcriptomics descriptive data and integration with Dataset 4. (a) UMAP overlaid with disease state. (b) UMAP overlaid with study subject ID. (c) UMAP overlaid with Dataset 4 region labels. (d, e) Cell type predictions and spatially restricted gene expression within lymphoid aggregates within the duodenal mucosa in CD. Lymphoid aggregate regions are highly localised in intestinal biopsies from CD subjects (b). Cell type predictions (c) indicate Tfh-like CD4+ T-cells, as well as B cells, are present in these regions, with plasma cells and Tregs surrounding these regions. This is supported by the expression of MS4A1 (CD20), CXCR4, CXCR5 and CXCL13.
Extended Data Fig. 10
Extended Data Fig. 10. CD-related GWAS candidate genes show spatial region and cell-type specific expression.
(a) Bubble plot of CD-associated GWAS candidate gene expression within the duodenal mucosa. Scaled gene expression indicated by colour, proportion of regions expressing the genes indicated by bubble size. (Genes identified from van der Graff et al. 2021, with at least one line of supporting evidence for direct gene association with CD). (b) Barplot of significance (–log10(FDR)) of CD-specific GWAS signal enrichment in scRNA-seq cell clusters in immune and epithelial subpopulations in cells from healthy and UC donors (n = 8). SNPsea empirical distribution P value with multiple testing correction (Benjamini–Hochberg). (c) Heatmap of CD-associated GWAS candidate gene scaled expression within immune and epithelial cell populations identified in Dataset 1 scRNA-seq dataset. (d) Violin plots of selected GWAS candidate gene expression in TRM(2) CD8+ T-cells in health and CD. (e) Heatmap of CD-associated GWAS candidate gene scaled expression within immune cell population identified in Dataset 2 scRNA-seq dataset.

Similar articles

References

    1. Lindfors, K. et al. Coeliac disease. Nat. Rev. Dis. Primers5, 3 (2019). - PubMed
    1. Kivelä, L. et al. Current and emerging therapies for coeliac disease. Nat. Rev. Gastroenterol. Hepatol.18, 181–195 (2021). - PubMed
    1. Sollid, L. M. The roles of MHC class II genes and post-translational modification in celiac disease. Immunogenetics10.1007/s00251-017-0985-7 (2017). - PubMed
    1. Graaf, Avander et al. Systematic prioritization of candidate genes in disease loci identifies TRAFD1 as a master regulator of IFNγ signaling in celiac disease. Front. Genet.11, 562434 (2021). - PMC - PubMed
    1. Bouziat, R. et al. Reovirus infection triggers inflammatory responses to dietary antigens and development of celiac disease. Science356, 44–50 (2017). - PMC - PubMed