

Determining the effects of social-environmental factors on the incidence and mortality of lung cancer in China based on remote sensing and GIS technology during 2007-2016
- PMID: 40329282
- PMCID: PMC12054078
- DOI: 10.1186/s12889-025-22591-w
Determining the effects of social-environmental factors on the incidence and mortality of lung cancer in China based on remote sensing and GIS technology during 2007-2016
Abstract
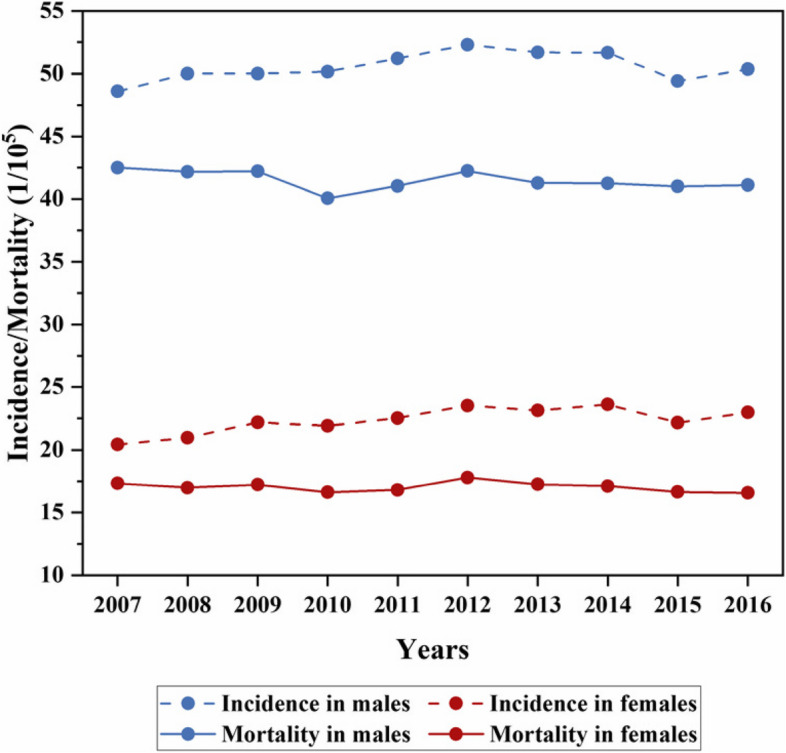
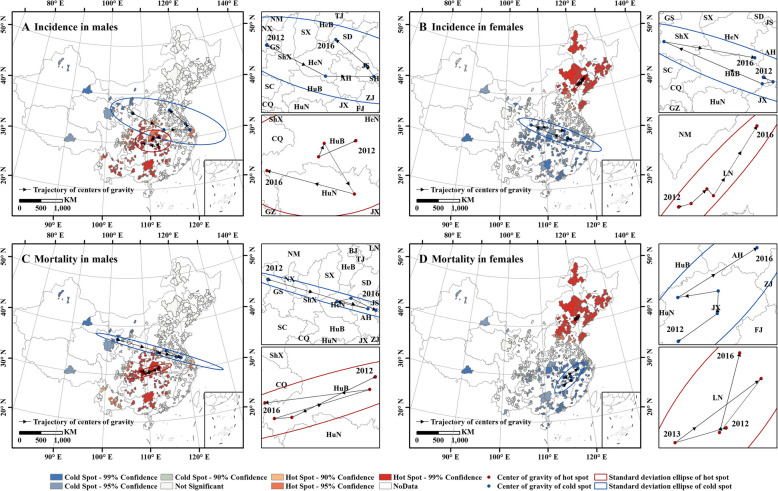
Background: Lung cancer is the leading cause of cancer-related death in China. However, its relationship with social-environmental factors has not been revealed comprehensively. We are the first group to determine cold and hot spots associated with the incidence and mortality of lung cancer (IMLC) in both females and males and their spatiotemporal changes and to explore the social‒environmental burden of lung cancer in China between 2007 and 2016.
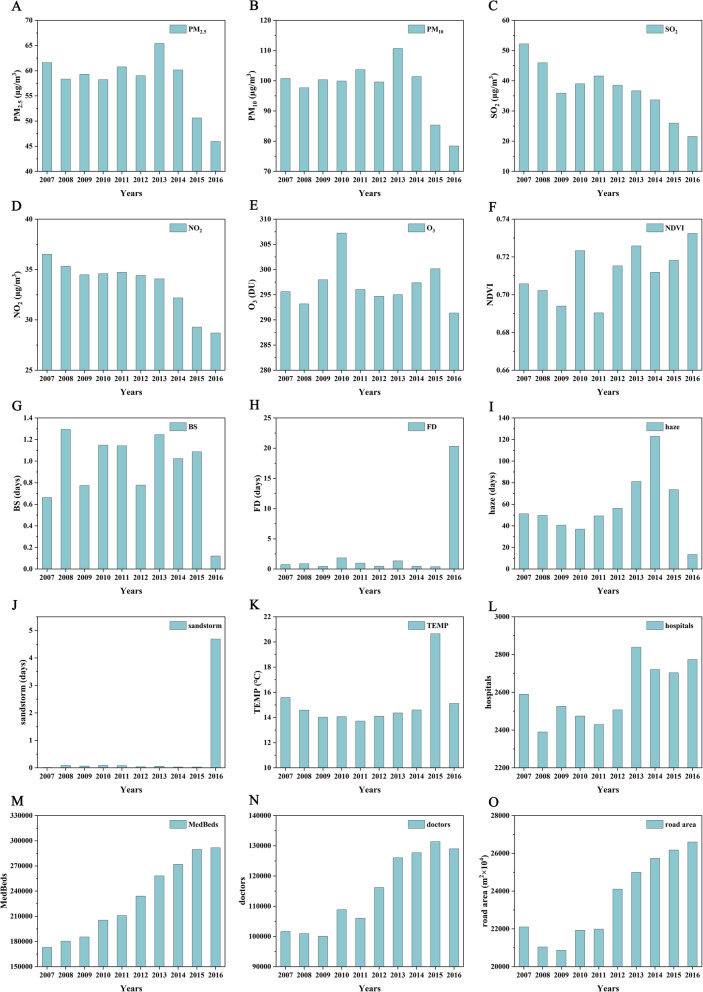
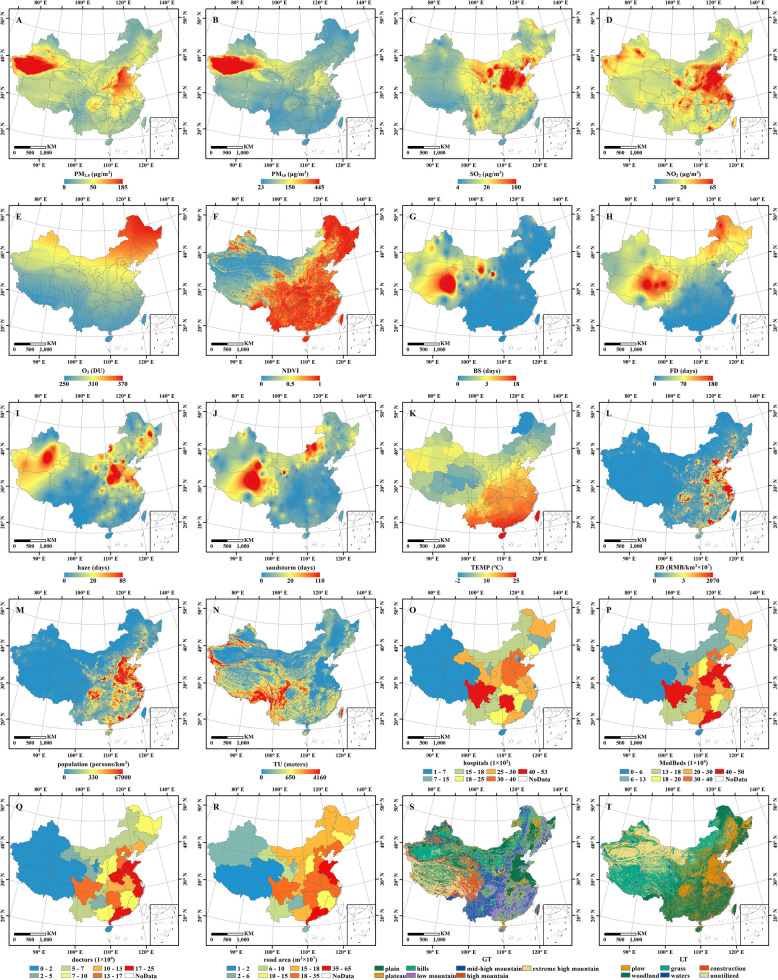
Methods: The explanatory powers of various social-environmental factors for the IMLC were evaluated through correlation analysis and the Geodetector tool. Spatial analysis models were applied to determine the relationships between the IMLC and social-environmental factors.
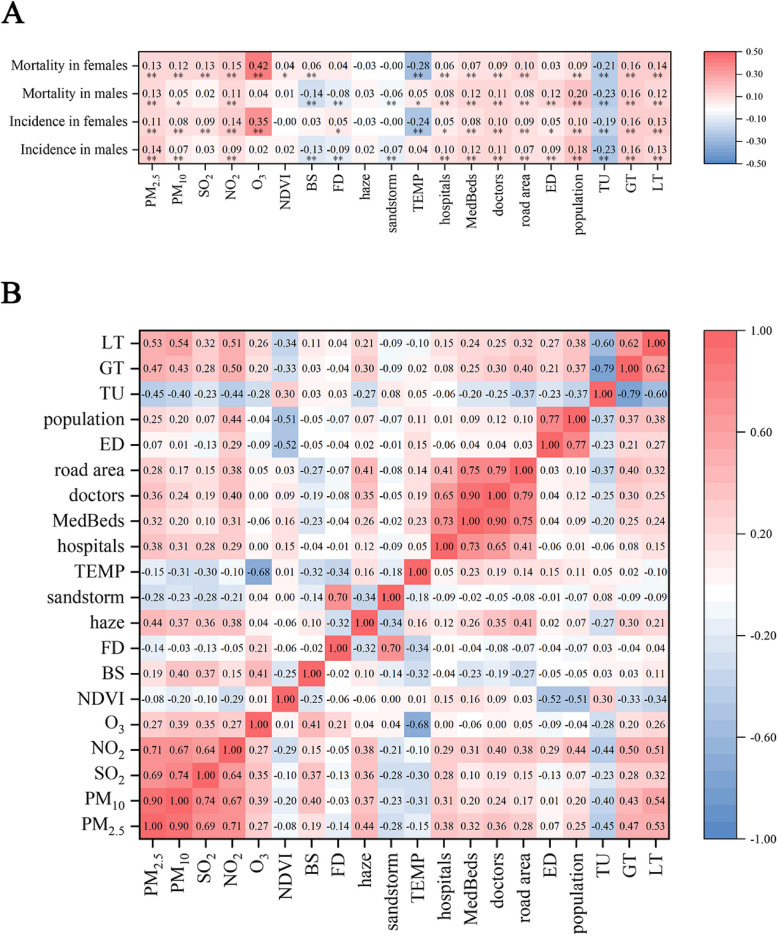
Results: The results are as follows: (1) The distribution of the IMLC exhibited significant spatial heterogeneity; the Global Moran's index values for incidence ranged from 0.04-0.2 and 0.09-0.33 in males and females, respectively, and the values for mortality ranged from 0.01-0.12 and 0.11-0.32 in males and females, respectively. (2) The IMLC was spatially clustered with an overall positive autocorrelation. Male population-related hot spots were observed in the central-southern region of China, and cold spots were observed in western China. Female population-related hot spots were observed primarily in northeastern China. The cold spots occurred primarily in southern and some western regions of China. (3) The effects of social-environmental factors on the IMLC showed significant spatial and temporal variability: in males, the interaction between terrain undulation and road area exhibited the highest explanatory power for the incidence and mortality, with a value of 0.22 for both; in females, the interaction between O3 and road area and the interaction between O3 and the number of medical beds exhibited the highest explanatory powers for the incidence and mortality, reaching 0.27 and 0.34, respectively. (4) The optimal model capturing the relationships between the IMLC and social-environmental factors was the GTWR model, which relies on reclassified data. The best R2 value is 0.456.
Conclusions: The influence of each social‒environmental factor on the IMLC showed significant spatiotemporal variability, providing a systematic basis for governments to implement better targeted control of lung cancer.
Keywords: Cold and hot spots; GTWR; GWR; Lung cancer; OLS; Social–environmental factors; Spatial autocorrelation; Spatiotemporal moving trajectory; Standard deviation ellipse.
© 2025. The Author(s).
Conflict of interest statement
Declarations. Ethics approval and consent to participate: Not applicable. Consent for publication: Not applicable. Competing interests: The authors declare no competing interests.
Figures


References
-
- Naghavi M, Abajobir AA, Abbafati C, Abbas KM, Abd-Allah F, Abera SF, Aboyans V, Adetokunboh O, Arnlöv J, Afshin A, et al. Global, regional, and national age-sex specific mortality for 264 causes of death, 1980–2016: a systematic analysis for the Global Burden of Disease Study 2016. Lancet. 2017;390(10100):1151–210. - DOI - PMC - PubMed
-
- Zheng RS, Chen R, Han BF, Wang SM, Li L, Sun KX, Zeng HM, Wei WW, He J. Cancer incidence and mortality in China, 2022. Zhonghua Zhong Liu Za Zhi. 2024;46(3):221–31. - PubMed
MeSH terms
Grants and funding
LinkOut - more resources
Full Text Sources
Medical
