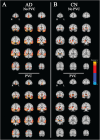
Assessment of the relationship between synaptic density and metabotropic glutamate receptors in early Alzheimer's disease: a multi-tracer PET study
- PMID: 40329311
- PMCID: PMC12054321
- DOI: 10.1186/s13195-025-01739-1
Assessment of the relationship between synaptic density and metabotropic glutamate receptors in early Alzheimer's disease: a multi-tracer PET study
Abstract
Background: The pathological effects of amyloid β oligomers (Aβo) may be mediated through the metabotropic glutamate receptor subtype 5 (mGluR5), leading to synaptic loss in Alzheimer's disease (AD). Positron emission tomography (PET) studies of mGluR5 using [18F]FPEB indicate a reduction of receptor binding that is focused in the medial temporal lobe in AD. Synaptic loss due to AD measured through synaptic vesicle glycoprotein 2A (SV2A) quantification with [11C]UCB-J PET is also focused in the medial temporal lobe, but with clear widespread reductions is commonly AD-affected neocortical regions. In this study, we used [18F]FPEB and [11C]UCB-J PET to investigate the relationship between mGluR5 and synaptic density in early AD.
Methods: Fifteen amyloid positive participants with early AD and 12 amyloid negative, cognitively normal (CN) participants underwent PET scans with both [18F]FPEB to measure mGluR5 and [11C]UCB-J to measure synaptic density. Parametric distribution volume ratio (DVR) images using equilibrium methods were generated from dynamic images. For [18F]FPEB PET, DVR was calculated using equilibrium methods and a cerebellum reference region. For [11C]UCB-J PET, DVR was calculated with a simplified reference tissue model - 2 and a whole cerebellum reference region.
Results: A strong positive correlation between mGluR5 and synaptic density was present in the hippocampus for participants with AD (r = 0.81, p < 0.001) and in the CN group (r = 0.74, p = 0.005). In the entorhinal cortex, there was a strong positive correlation between mGluR5 and synaptic density in the AD group (r = 0.85, p < 0.001), but a weaker non-significant correlation in the CN group (r = 0.36, p = 0.245). Exploratory analyses indicated more widespread significant positive correlations between synaptic density and mGluR5 within regions, as well as significant positive correlations between synaptic density in the temporal lobe and mGluR5 across a broader set of regions commonly affected by AD.
Conclusions: Our findings suggest that mGluR5 reduction in AD is closely linked to synaptic loss. Longitudinal studies are needed to clarify causality, deepen understanding of AD pathogenesis, and aid in developing novel biomarkers and treatments.
Keywords: Alzheimer’s disease; MGluR5 binding; PET; SV2A; Synaptic density; [11C]UCB-J; [18F]FPEB.
© 2025. The Author(s).
Conflict of interest statement
Declarations. Ethics approval and consent to participate: The study protocol was approved by the Yale University Human Investigation Committee and Radiation Safety Committee. All participants provided written informed consent prior to participating in the study. Consent for publication: Not applicable. Competing interests: A.P.M., R.E.C., and C.H.vD. report grants from the National Institutes of Health for the conduct of the study. A.P.M. reports grants for clinical trials from Eli Lilly and Janssen Pharmaceuticals outside the submitted work. Y.H. reports research grants from UCB and Eli Lilly outside the submitted work. Y.H., N.B.N., and R.E.C. have a patent for a newer version of the tracer. R.E.C. is a consultant for Rodin Therapeutics and has received research funding from UCB. R.E.C. reports having received grants from AstraZeneca, Astellas, Eli Lilly, Pfizer, Taisho, and UCB outside the submitted work. C.H.vD. reports consulting fees from Kyowa Kirin, Roche, Merck, Eli Lilly, and Janssen and grants for clinical trials from Biogen, Novartis, Eli Lilly, Merck, Eisai, Janssen, Roche, Genentech, Toyama, and Biohaven outside the submitted work. R.S.O. reports grants for clinical trials from Cognition Therapeutics and Bristol-Myers Squibb outside of the submitted work.
Figures


Update of
-
Assessment of the relationship between synaptic density and metabotropic glutamate receptors in early Alzheimer's disease: a multi-tracer PET study.bioRxiv [Preprint]. 2024 Sep 24:2024.09.21.614277. doi: 10.1101/2024.09.21.614277. bioRxiv. 2024. Update in: Alzheimers Res Ther. 2025 May 6;17(1):98. doi: 10.1186/s13195-025-01739-1. PMID: 39386453 Free PMC article. Updated. Preprint.
References
MeSH terms
Substances
Grants and funding
LinkOut - more resources
Full Text Sources
Medical

