

Evaluating the MPM III and SAPS III prognostic models in a war-affected, resource-limited setting: a prospective study from the Gaza Strip
- PMID: 40329400
- PMCID: PMC12054265
- DOI: 10.1186/s12913-025-12833-3
Evaluating the MPM III and SAPS III prognostic models in a war-affected, resource-limited setting: a prospective study from the Gaza Strip
Abstract
Background: Validation studies of prognostic models used in critical care have yet to be conducted in Palestine. The intense conflict in the Gaza Strip presents an opportunity to evaluate the performance of local ICUs and validate the performance of the MPM and SAPS models within a resource-limited and highly stressed healthcare system.
Methods: A prospective study conducted from October to December 2024 included all patients admitted to ICUs in three of the four critical care units operating in the Gaza Strip. Sociodemographic, clinical, physiological, and laboratory parameters were collected, along with information regarding the clinical course and ICU outcomes. The MPM-III and SAPS-III scores were calculated, and their discrimination and calibration were assessed using AUROC and the Hosmer-Lemeshow test, respectively. Furthermore, the difference between the predicted and actual mortality rates was visualized, and standardized mortality rates (SMR) were calculated. Except for the Hosmer-Lemeshow test, a p-value of less than 0.05 was deemed statistically significant. All statistical analyses were conducted using R Studio.
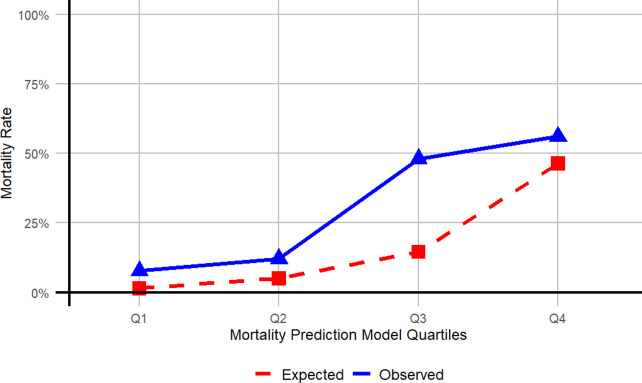
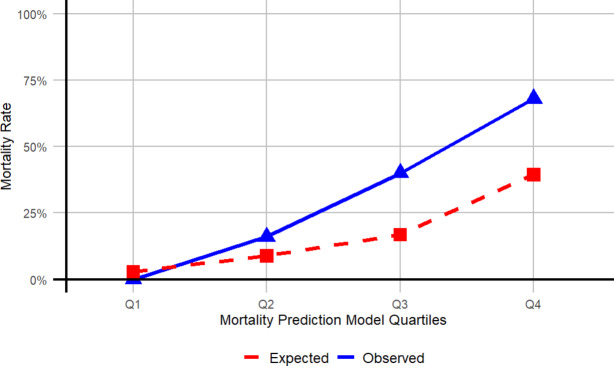
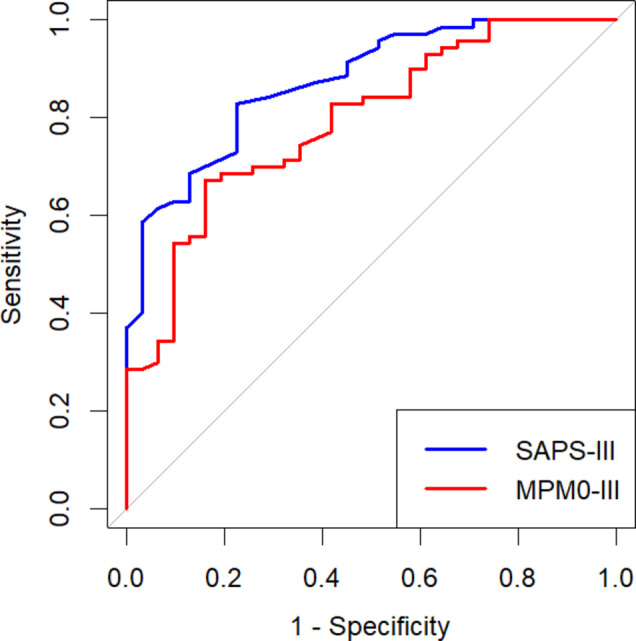
Results: The cohort included 101 patients, of whom 72.27% were surgical cases and 58.41% were admitted from the ER. The ICU mortality rate was 30.69%. The median duration of ICU admission was four days [IQR 2-9] and was significantly longer for surgical cases than for medical cases. Physiological and laboratory parameters, along with interventions associated with higher mortality, included a lower GCS, burns, elevated leukocyte and platelet counts, lower PPO2, dysrhythmias, intracranial mass effect, and the need for mechanical ventilation or central venous catheterization. The predicted mortality rates were 16.63% for MPM0-III and 16.82% for SAPS-III. SMRs indicated that both models underestimated ICU mortality (SMR, MPM0-III 1.85; SAPS-III 1.83), with the discrepancy more likely to occur in high-risk patients. ROC curves demonstrated acceptable to good discriminatory power for both models (AUROC, MPM0-III 0.79 (95% CI 0.7-0.88); SAPS-III 0.87 (95% CI 0.80-0.94)). The Hosmer-Lemeshow test yielded statistically insignificant results for both models, indicating good calibration.
Conclusion: The outcomes of critical care units in the Gaza Strip during the studied period of the war were comparable to those of other hospitals in the West Bank and other LMICs without active conflicts. The MPM-III and SAPS-III demonstrated good discrimination and calibration, making them valid tools for enhancing ICU performance and improving resource utilization in the Gaza Strip.
Keywords: Critical care; Gaza Strip; ICU scoring system; Low and middle-income countries; Model performance; Resource-limited settings.
© 2025. The Author(s).
Conflict of interest statement
Declarations. Ethics approval and consent to participate: Ethical approval was obtained from the Institutional Review Board (IRB) at the Islamic University of Gaza (IUG). The research was conducted in accordance with the Declaration of Helsinki. Informed written consent was given by patients or, in unconscious or confused patients, by the next of kin. No identifying information was collected, and anonymity was guaranteed. Consent for publication: Not applicable. Competing interests: The authors declare no competing interests.
Figures
References
MeSH terms
LinkOut - more resources
Full Text Sources
Medical
