. 2025 Jun 17;124(12):2005-2019.
doi: 10.1016/j.bpj.2025.04.031. Epub 2025 May 5.

Effect of RNA on the supramolecular architecture of α-synuclein fibrils

Affiliations

Effect of RNA on the supramolecular architecture of α-synuclein fibrils

Antonia Intze et al. Biophys J. .

Abstract

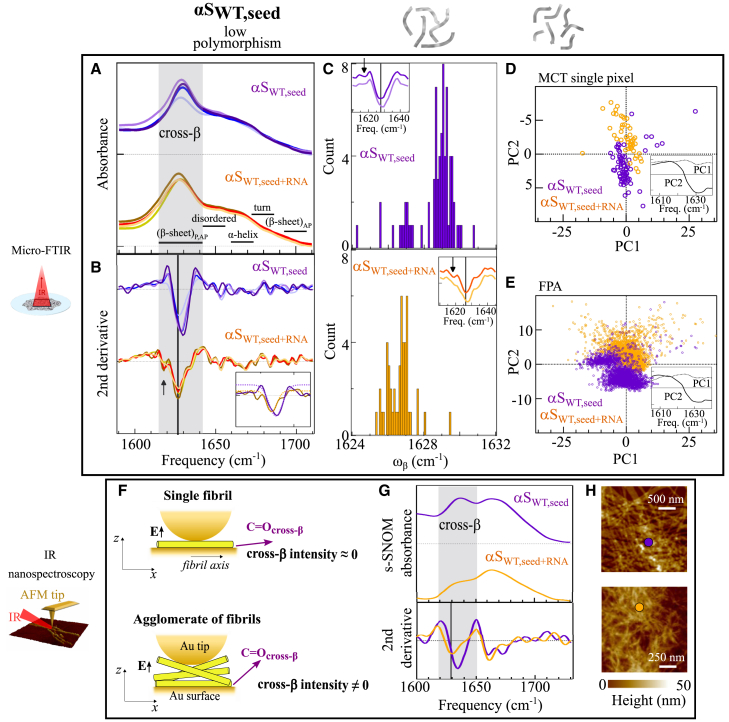
Structural changes associated with protein aggregation are challenging to study, requiring the combination of experimental techniques providing insights at the molecular level across diverse scales, ranging from nanometers to microns. Understanding these changes is even more complex when aggregation occurs in the presence of molecular cofactors such as nucleic acids and when the resulting aggregates are highly polymorphic. Infrared (IR) spectroscopy is a powerful tool for studying protein aggregates since it combines the label-free sensitivity to the cross-β architecture, an inherent feature of protein supramolecular aggregates, with the possibility to reach nanoscale sensitivity by leveraging atomic force microscopy (AFM)-assisted detection. Here, we present a combined approach that detects IR spectral markers of aggregation using various IR spectroscopy techniques, covering micro-to-nanoscale ranges, to study the effect of RNA on the supramolecular architecture of α-synuclein amyloid aggregates. We show a clear impact of RNA consistent with enhanced intermolecular forces, likely via a stronger hydrogen-bonded network stabilizing the cross-β architecture. AFM-assisted IR spectroscopy was crucial to assess that the more ordered the aggregates are, the stronger the structural impact of RNA. In addition, an RNA-induced reduction of the degree of polymorphism within the aggregate population is obtained.


Conflict of interest statement

Declaration of interests The authors declare no competing interests.

Figures

Figure 1
Figure 1
Effect of RNA on the fibril formation kinetics and morphology of αS fibrils. (A) Left: AFM image of αS fibrils with a schematic representation of the two protofibrils that constitute the fibril (70). The β-strands adopt a parallel and in-register arrangement and are perpendicular to the fibril axis (49). Right: schematics of the interstrand H-bond between the carbonyl and the amine groups in the peptide backbone, called cross-β architecture, detected by IR. (B) Amide-I band deconvolution of αSWT fibrils (top) and oligomers (bottom) using five Lorentzian components centered at 1625, 1640, 1652, 1670, and 1690 cm1. Each Lorentzian component corresponds to a specific protein secondary structure based on its frequency position (41). (C) Experimental data from averaged time-resolved Proteostat™ fluorescence replicates of αS103 in the absence (top) and presence (bottom) of RNA with standard deviations. (D) Maximum percentage values of the FTIR (β-sheet)P,AP component for the αS103 (top) and αS103+RNA (bottom) samples. See Figs. S2 and S3 for representative FTIR spectra and trend of the amide-I band deconvolution components. The data in (B) and (D) were fitted into a sigmoidal curve using the Hill function. Best-fit aggregation rates for fluorescence (and FTIR) are 1.3 ± 0.1 h1 (1.5 ± 0.4 h1) for αS103 and 2.0 ± 0.2 h1 (2.5 ± 1.3 h1) for αS103+RNA samples. (E and F) CD and micro-FTIR absorption spectra (200 × 200 μm2 sample area) of αSWT (continuous line) and αSWT+RNA (dashed line) at different sampling times. The micro-FTIR spectra are normalized at 1660 cm1. (G) Contact-mode AFM topography maps of αSWT (top) and αSWT+RNA (bottom) fibrils. Scale bar, 200 nm. (H and I) Histograms of the height distribution of αSWT (H) and αSWT+RNA (I) fibrils (bin size is 1 nm). In the inset, the trajectory of fibrils with different lengths (superimposed black lines in the AFM images of (G)), where the tangents at the initial end are aligned.
Figure 2
Figure 2
Effect of RNA on the supramolecular architecture of the less polymorphic αSWT,seed fibrils. (A and B) Micro-FTIR absorption spectra (15 × 15 μm2) with the assignment of the secondary structure components (A) and corresponding second-order derivative curves (B) for the αSWT,seed (purple line) and αSWT+RNA,seed (orange line). The inset of (B) shows representative second-order derivatives with Gaussian fits of the (β-sheet)P,AP component. The Gaussian fits have a central frequency at 1629.3 and 1626.7 cm1 and a FWHM of 5.4 and 4.3 cm1 for the αSWT,seed and αSWT+RNA,seed curves, respectively. (C) Histogram of the ωβ distribution of αSWT,seed (top) and αSWT+RNA,seed (bottom) fibrils measured in 15 × 15 μm2 areas (bin size is 0.1 cm1). Number of analyzed spectra is 73 (top) and 48 (bottom). In the insets, we show the average second-order derivatives from the low-frequency (<1626.5 cm1, purple and red line) and high-frequency (>1626.5 cm1, light purple and orange line) populations of the histograms. Arrows indicate the 1620 cm1 contribution. (D and E) PCA scores plots showing a clear separation between the ωβ of αSWT,seed and αSWT+RNA,seed fibrils measured in 15 × 15 μm2 areas with an MCT detector (D) and 2.7 × 2.7 μm2 areas with an FPA detector (E). In the insets, the loadings plots show the PC1 and PC2 coordinates, which indicate the first and second principal components. PC1 and PC2 variance is 56% and 32% for FPA and 60% and 28% for MCT, respectively. (F) Sketch of the relative angle between the electric field in the tip-gold nanogap and the C=O cross-β dipole moment for a simplified case of an individual rod-like amyloid fibril (top) and an agglomerate of fibrils (bottom). (G) s-SNOM absorbance spectra (top) and corresponding second-order derivative curves (bottom) of αSWT,seed (purple line) and αSWT+RNA,seed (orange line) fibril agglomerates. Spectra are the average of measurements at four different locations of the fibril agglomerates. (H) AFM topography maps of the αSWT,seed (top) and αSWT+RNA,seed (bottom) fibril agglomerates where the s-SNOM spectra were acquired.
Figure 3
Figure 3
Effect of RNA on the morphology and supramolecular architecture of the highly polymorphic αS103 aggregates. (A) Histogram of the ωβ distribution of αS103 (top) and αS103+RNA (bottom) fibrils measured in 15 × 15 μm2 areas (bin size is 0.1 cm1). Number of analyzed spectra is 79 (top) and 82 (bottom). (B) PCA scores plot showing very little separation between the ωβ of αS103 and αS103+RNA fibrils. In the inset, the loading plot shows the PC1 and PC2 coordinates, which indicate the first and second principal components. PC1 and PC2 variance is 51 and 42%, respectively. (C and D) AFM topography maps of αS103 (C) and αS103+RNA (D) agglomerate of amorphous aggregates and fibrils. (E) Second-order derivatives of AFM-IR spectra acquired on αS103 (left) and αS103+RNA (right) amorphous aggregates and fibrils. The dashed lines are the Gaussian fits of the cross-β negative peak. (F) Plot of the ωβ of the Gaussian fit versus the Gaussian FWHM for the αS103 and αS103+RNA amorphous aggregates and fibrils in (E). Circle markers show the average values corresponding to the αS103 and αS103+RNA samples. Horizontal and vertical error bars represent the standard deviation of the FWHM and ωcross-β, respectively. The average ωcross-β values for αS103 and αS103+RNA are 1633 ± 1 cm1 and 1631 ± 1 cm1, respectively. Meanwhile, the average FWHM values are 7 ± 2 cm1 and 5 ± 2 cm1, respectively. The total number of analyzed AFM-IR spectra is 11 for the αS103 and 12 for the αS103+RNA samples.
Figure 4
Figure 4
RNA has different structural effects on αS103 aggregates with distinct conformations. (A and C) Second-order derivatives of AFM-IR spectra acquired on αS103 and αS103+RNA amorphous aggregates (A) and ordered fibrils (C). (B and D) AFM topography maps of αS103 and αS103+RNA amorphous aggregates (B) and fibrils (D) . Filled circle markers on the AFM maps indicate the location where the AFM-IR spectra were acquired.
Figure 5
Figure 5
RNA favors the formation of stronger H-bonding among the β-sheets in the αS fibril structure. (A) Energy landscape of protein folding and aggregation. (B and C) Distribution of the low-energy levels related to fibril formation (top) and general chemical structure of β-strands (bottom), inside the αS (B) and αS+RNA (C) fibril, interacting by H-bonds. In the presence of RNA, the H-bond network is stronger (represented by thick dashed lines).

References

    1. Louros N., Schymkowitz J., Rousseau F. Mechanisms and pathology of protein misfolding and aggregation. Nat. Rev. Mol. Cell Biol. 2023;24:912–933. - PubMed
    1. Yavich L., Tanila H., et al. Jäkälä P. Role of α-synuclein in presynaptic dopamine recruitment. J. Neurosci. 2004;24:11165–11170. - PMC - PubMed
    1. Vekrellis K., Xilouri M., et al. Stefanis L. Pathological roles of α-synuclein in neurological disorders. Lancet Neurol. 2011;10:1015–1025. - PubMed
    1. Lashuel H.A., Overk C.R., et al. Masliah E. The many faces of α-synuclein: from structure and toxicity to therapeutic target. Nat. Rev. Neurosci. 2013;14:38–48. - PMC - PubMed
    1. Galvin J.E., Lee V.M., Trojanowski J.Q. Synucleinopathies: clinical and pathological implications. Arch. Neurol. 2001;58:186–190. - PubMed

LinkOut - more resources