. 2025 Apr 22:16:1570378.
doi: 10.3389/fimmu.2025.1570378. eCollection 2025.

Multi-omics identification of a polyamine metabolism related signature for hepatocellular carcinoma and revealing tumor microenvironment characteristics

Affiliations

Multi-omics identification of a polyamine metabolism related signature for hepatocellular carcinoma and revealing tumor microenvironment characteristics

Yuexi Yu et al. Front Immunol. .

Abstract

Background: Accumulating evidence indicates that elevated polyamine levels are closely linked to tumor initiation and progression. However, the precise role of polyamine metabolism in hepatocellular carcinoma (HCC) remains poorly understood.

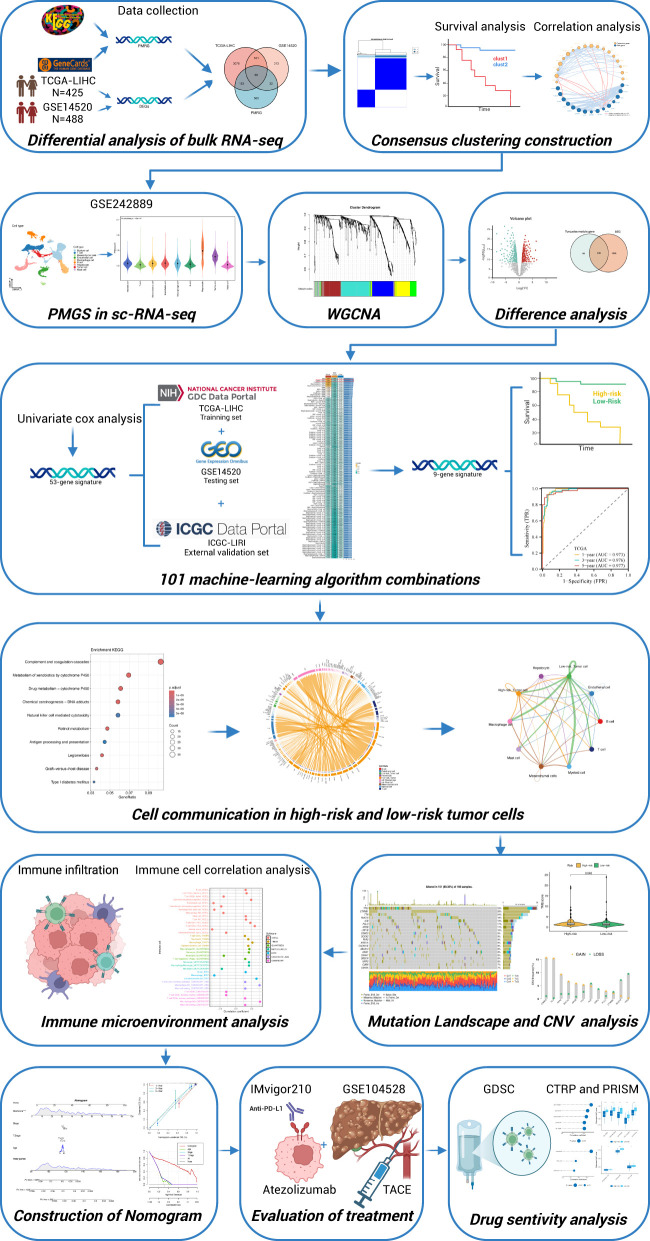
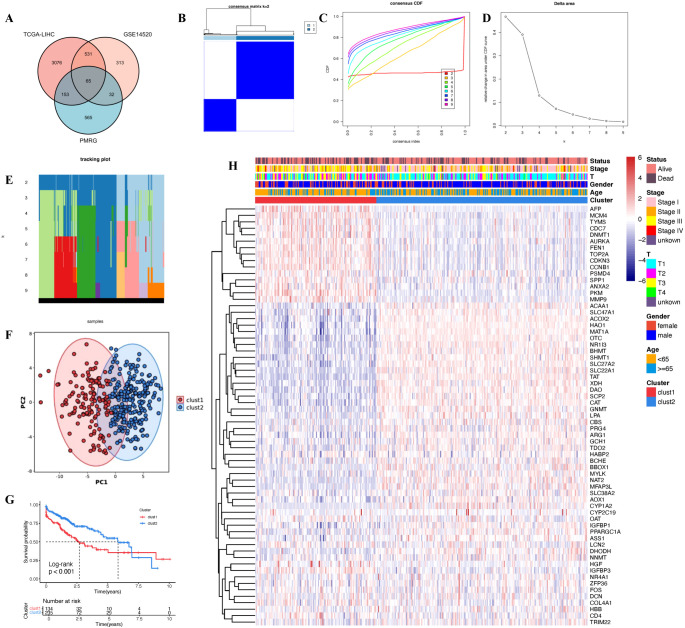
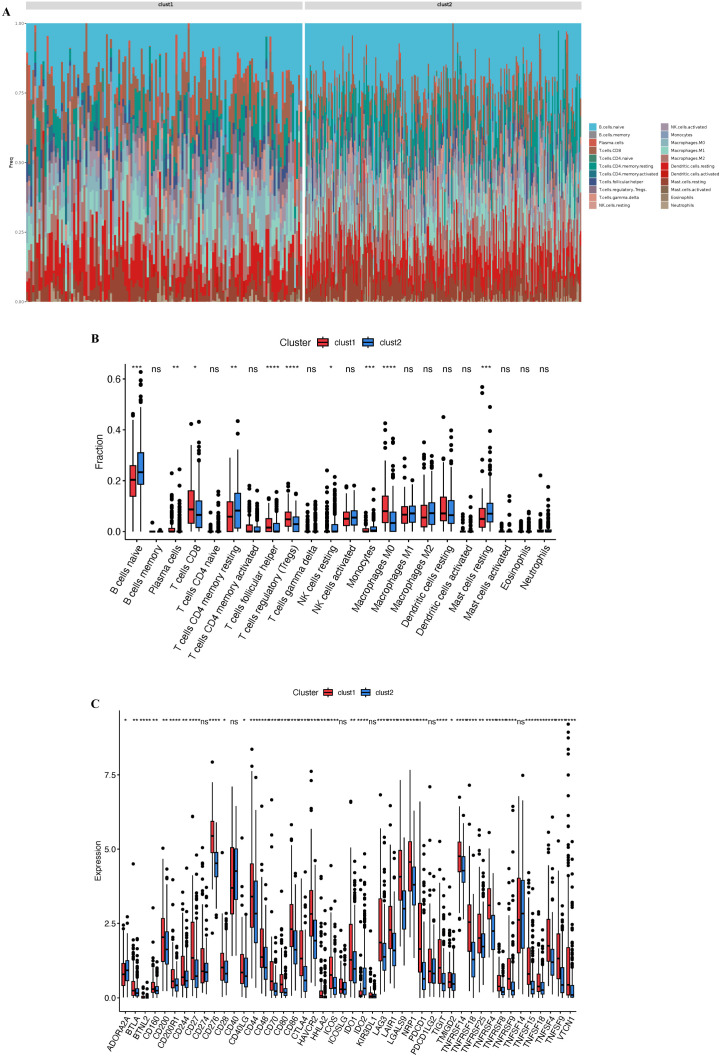
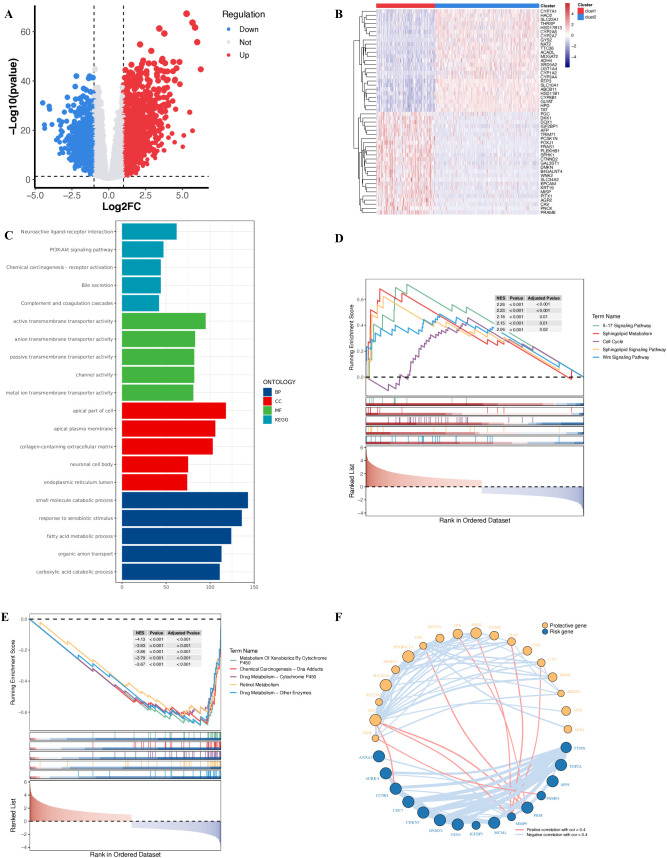
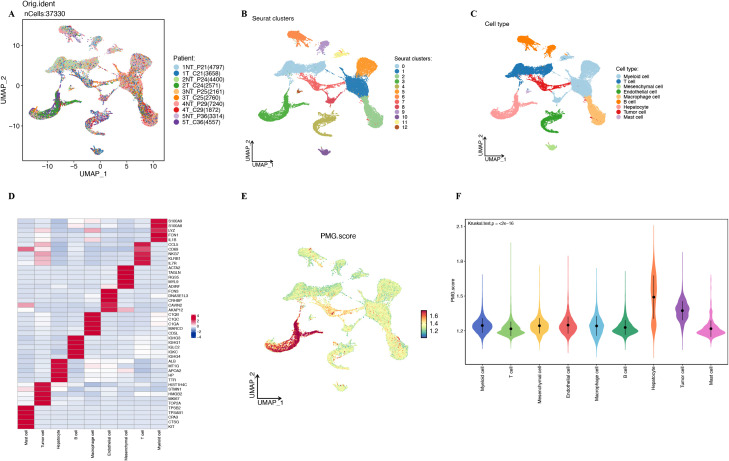
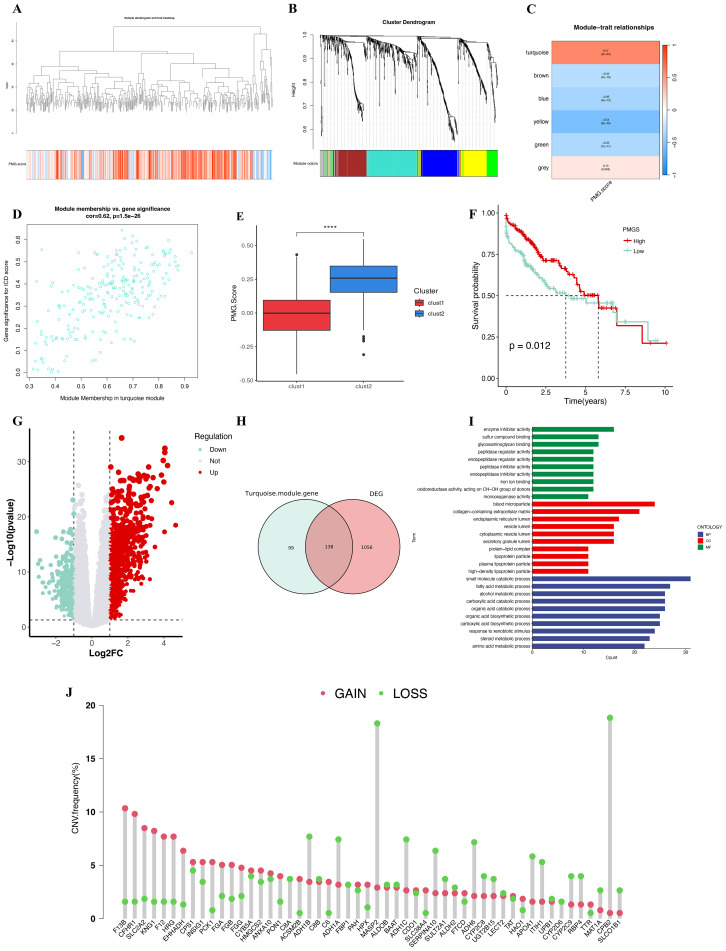
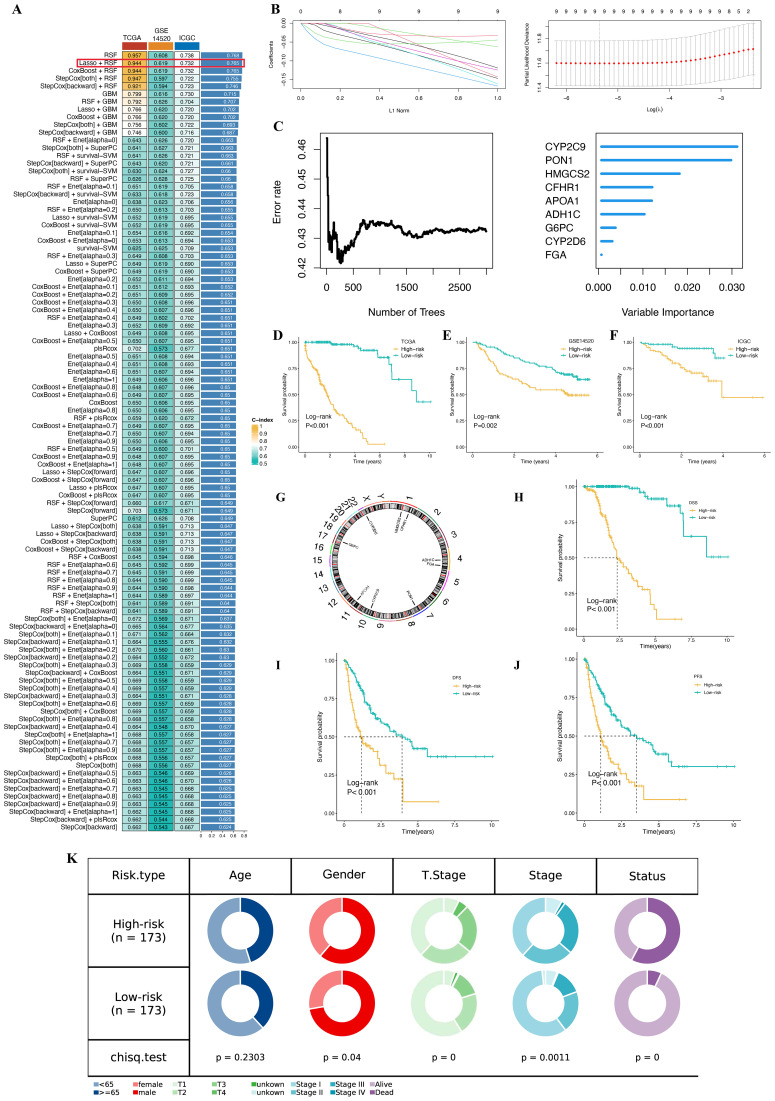
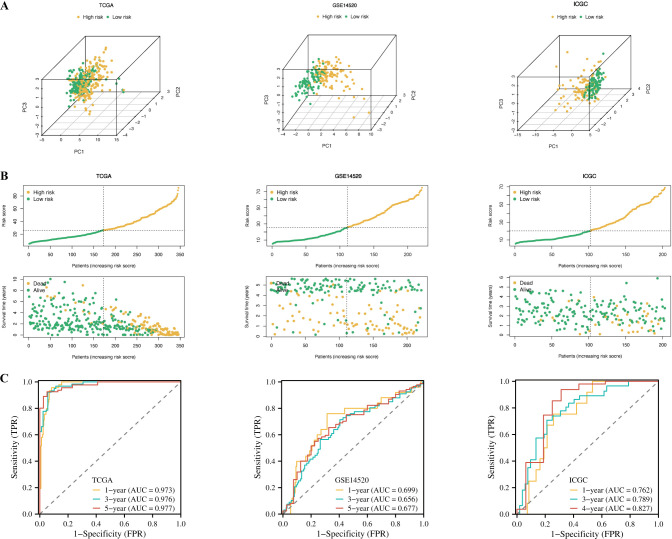
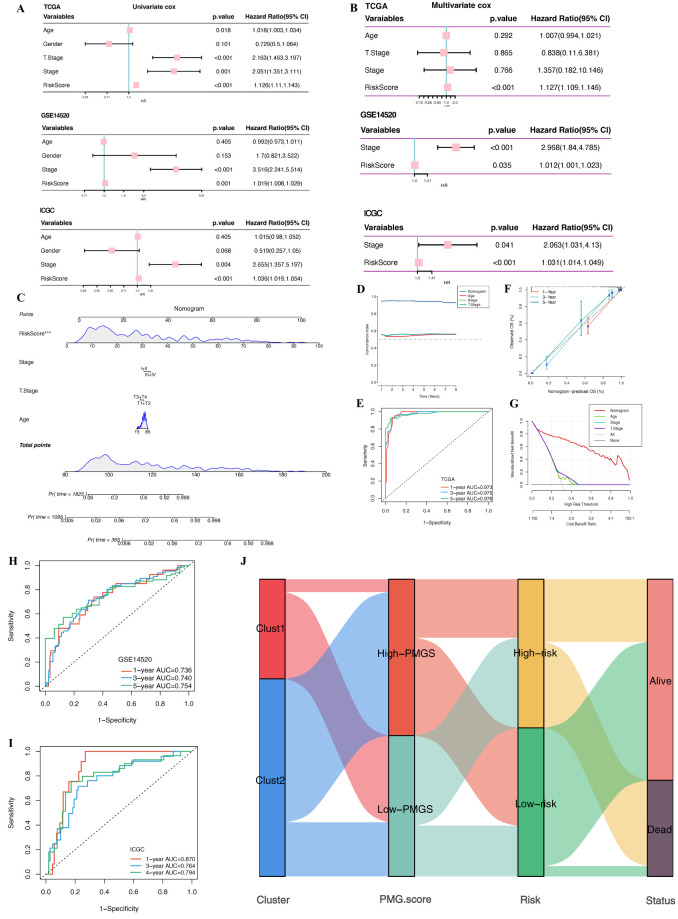
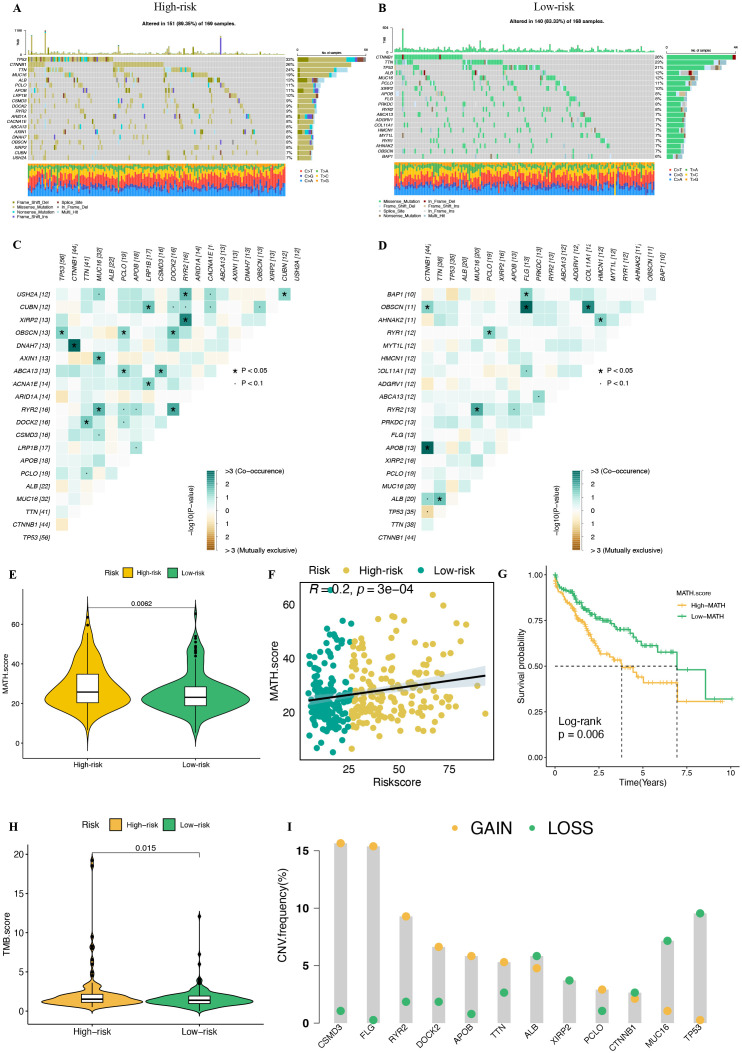
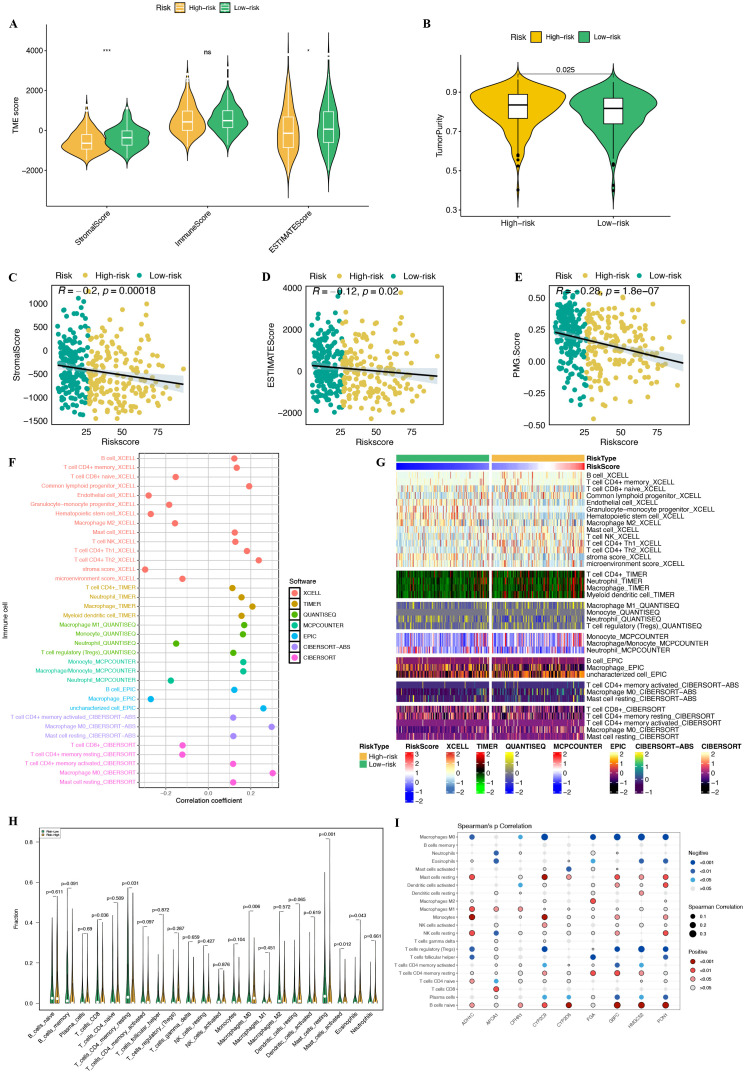
Methods: We conducted differential expression analysis on bulk RNA sequencing data from The Cancer Genome Atlas (TCGA) and Gene Expression Omnibus (GEO) to identify 65 polyamine metabolism-related genes. By employing unsupervised consensus clustering, AddModuleScore, single-sample gene set enrichment analysis (ssGSEA), and weighted gene co-expression network analysis (WGCNA), we identified polyamine metabolism-related genes at both the bulk RNA-seq and single-cell RNA-seq (scRNA-seq) levels. Utilizing 101 machine learning algorithms, we constructed a polyamine metabolism-related signature (PMRS) and validated its predictive power across training, testing, and external validation cohorts. Additionally, we developed a prognostic nomogram model by integrating PMRS with clinical variables. To explore immune treatment sensitivity, we assessed tumor mutation burden (TMB), tumor immune dysfunction and exclusion (TIDE) score, mutation frequency, and immune checkpoint genes expression. Immune cell infiltration was analyzed using the CIBERSORT algorithm. Finally, RT-qPCR experiments were conducted to validate the expression of key genes.

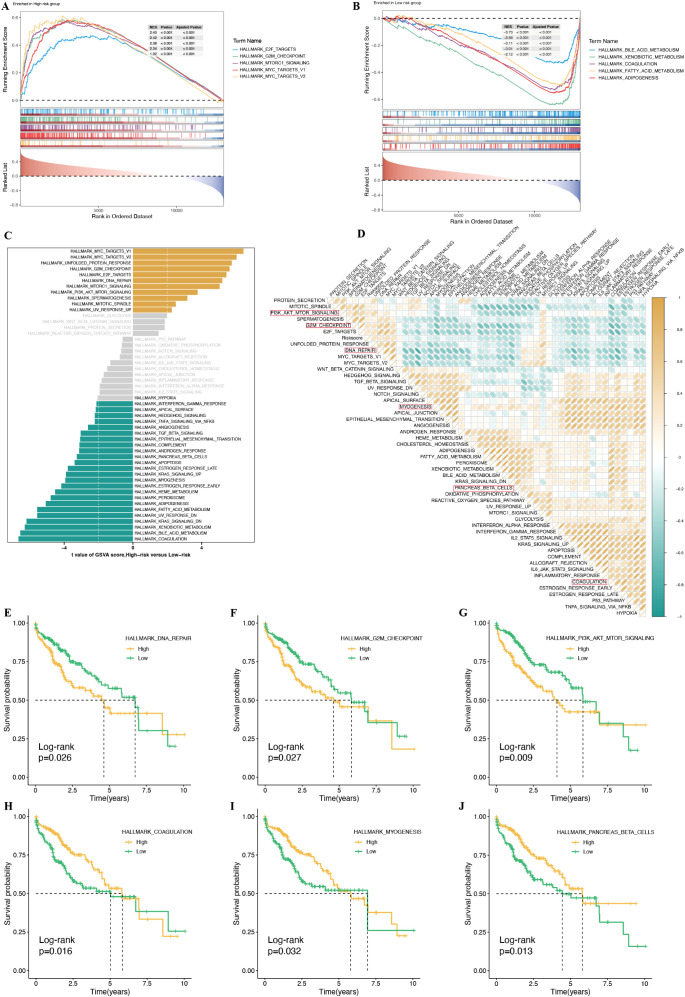
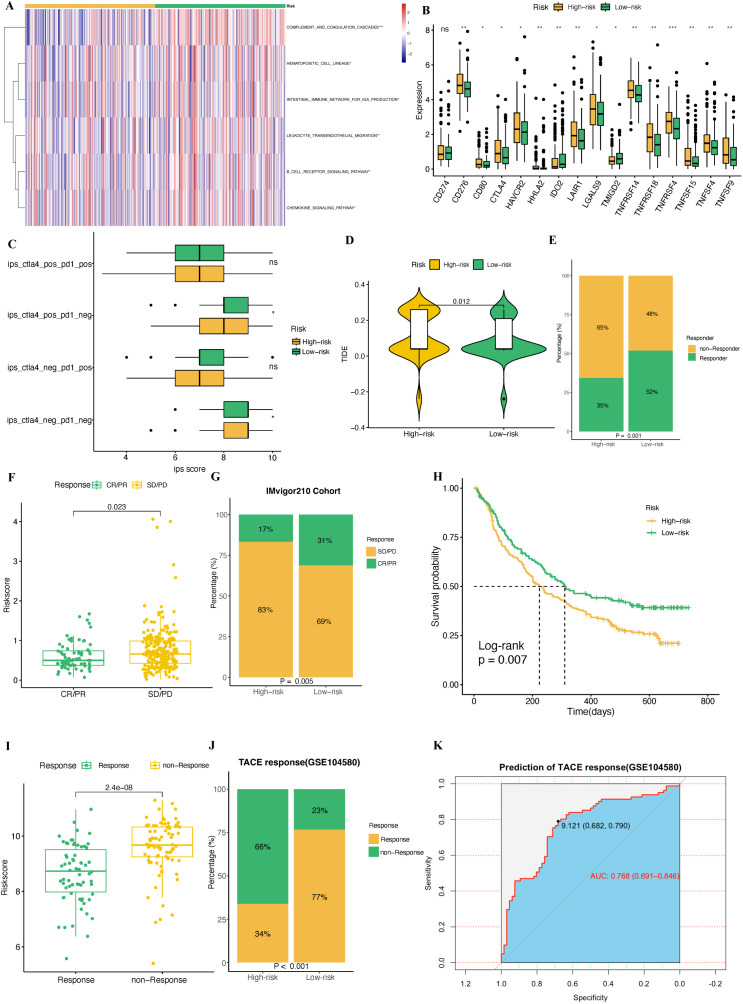
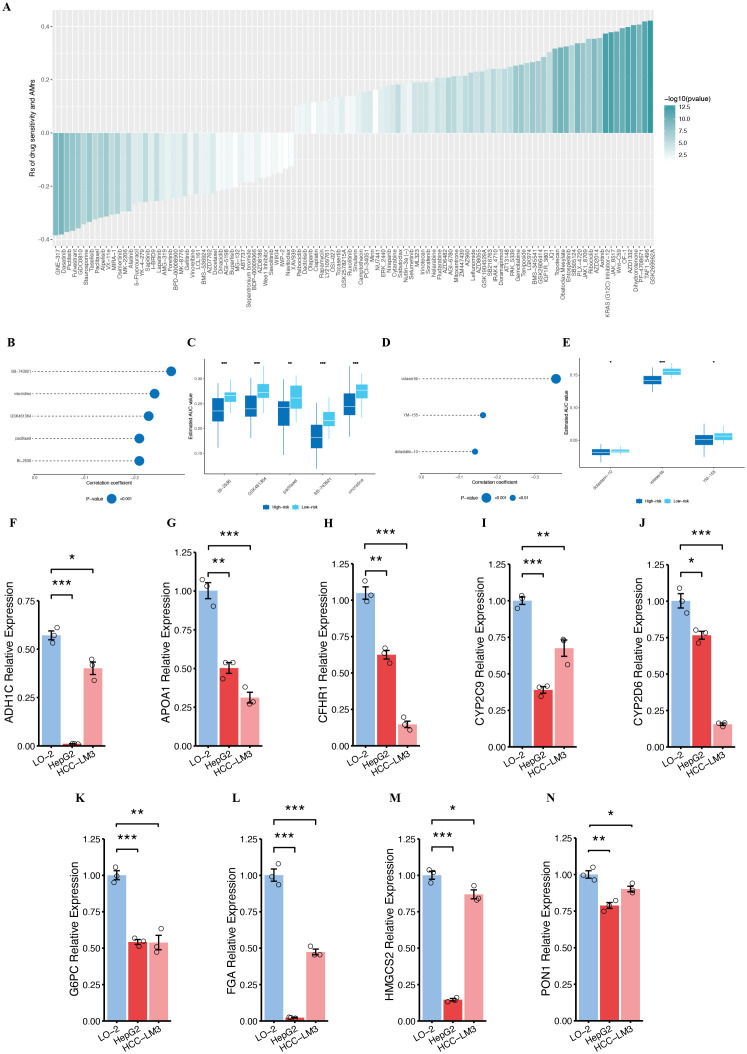
Results: Using 101 machine learning algorithms, we established a polyamine metabolism-related signature comprising 9 genes, which exhibited strong prognostic value for HCC patients. Further analysis revealed significant differences in clinical features, biological functions, mutation profiles, and immune cell infiltration between high-risk and low-risk groups. Notably, TIDE analysis and immune phenotype scoring (IPS) demonstrated distinct immune treatment sensitivities between the two risk groups. RT-qPCR validation confirmed that these 9 genes were highly expressed in normal cells but significantly downregulated in tumor cells.

Conclusions: Our study developed a polyamine metabolism-based prognostic risk signature for HCC, which may provide valuable insights for personalized treatment strategies in HCC patients.

Keywords: hepatocellular carcinoma; immune therapy; machine learning; multi-omics analysis; polyamine metabolism; single-cell RNA sequencing.


Conflict of interest statement

The authors declare that the research was conducted in the absence of any commercial or financial relationships that could be construed as a potential conflict of interest.

Figures

Figure 1
Figure 1
Flowchart of this study.
Figure 2
Figure 2
Consensus clustering construction. (A) Venn plot showing the intersecting genes between PMRG and DEGs in bulk RNA-seq. (B) Consistency matrix heatmap. (C) Cumulative distribution function. (D) Delta area plot. (E) Tracking plot. (F) PCA plot. (G) Kaplan-Meier survival analysis. (H) Clinical feature heatmap.
Figure 3
Figure 3
Assessment of immune cell infiltration and checkpoint in HCC. (A) Composition and relative abundance of 22 immune cell types in TCGA-LIHC samples. (B) Box plot illustrating the differential analysis of immune cell infiltration associated with clust1 and clust2. (C) Differences in the expression of immune checkpoint genes between the clust1 and clust2. NS, not statistically significant; *p < 0.05;**p < 0.01; ***p < 0.001;****p < 0.0001.
Figure 4
Figure 4
Differential expression and enrichment analysis between the clust1 and clust2 subtypes. (A) Volcano plot of differentially expressed genes between the clust1 and clust2 subtypes. (B) The top 50 differentially expressed genes in the clust1 and clust2 subtypes. (C) A bar chart displaying the functional enrichment analysis outcomes for both the clust1 and clust2 subtypes. (D, E) GSEA enrichment analysis based on KEGG pathways. (F) The results of the univariate cox regression analysis of PMRG and the correlations among 65 genes.
Figure 5
Figure 5
Polyamine metabolism characteristic in the single cell transcriptome. (A) The UMAP plot of ten samples from the GSE242889 dataset, colored to indicate the sample names. (B, C) The results of cell clustering and annotation for the GSE242889 dataset. (D) Heatmap showing the top 5 marker genes in each cell cluster. (E) The activity score of PMG score in each cell. (F) The distribution of the PMG score in different cell types.
Figure 6
Figure 6
Identification of the immunogenic polyamine metabolism-related genes (PMRG). (A) Dendrogram showing the hierarchical clustering of TCGA-LIHC samples. The bottom heatmap represents each sample’s PMG score, calculated by ssGSEA algorithm. (B) Cluster dendrogram of the WGCNA analysis. (C) Module-trait heatmap showing that the turquoise module was closely related to the polyamine metabolism trait. (D) Scatter plot showing the relationship between gene significance (GS) and module membership (MM) in the turquoise module. (E) The box plot displays the difference in PMG score between the clust1 and clust2 subtypes. (F) Kaplan-Meier survival analysis of overall survival (OS) in the TCGA-LIHC cohort, comparing high and low PMG scores (PMGS). (G) A volcano plot showing the results of differential analysis between high PMG score (PMGS) and low PMG score (PMGS) samples in the TCGA-LIHC cohort. (H) A Venn diagram illustrating the overlapping genes between the turquoise module and DEGs associated with high PMGS, as well as those associated with low PMGS in bulk RNA-seq analysis. (I) GO enrichment of the overlapping genes. (J) Copy number variation (CNV) frequency of PMRG presented in Supplementary Table S13 .
Figure 7
Figure 7
Machine learning and PMRS model development and validation. (A). A total of 101 kinds of prediction models via a tenfold cross-validation framework and further calculated the C index of each model across all validation datasets. (B) Visualization of LASSO regression in the TCGA-LIHC cohort. (C) Analysis of the number of trees required to achieve minimal error in the model and the significance of the nine genes using the Random Survival Forest (RSF) algorithm. (D, F) Kaplan-Meier survival curves showing overall survival (OS) based on the PMRS in the TCGA training set, GSE14520 testing set, and ICGC external validation set. (G) Chromosomal distribution of the nine genes included in the PMRS. (H–J) Kaplan–Meier survival curves for DSS, DFS, and PFS based on the PMRS in the TCGA-LIHC cohort. (K) Pie plot of the difference in clinical characteristics between high- and low-risk groups.
Figure 8
Figure 8
Evaluation of the PMRS model. (A) Principal component analysis (PCA) plot based on the PMRS in the TCGA, GSE14520, and ICGC cohorts. (B) Distribution of PMRS according to survival status and time in the TCGA, GSE14520, and ICGC cohorts. (C) Evaluating the predictive accuracy of the PMRS for OS in the TCGA-LIHC, GSE14520, and ICGC cohorts using ROC curves.
Figure 9
Figure 9
The correlation of PMRS with single-cell characteristics. (A) Expression of CYP2C9, HMGCS2, APOA1, CFHR1, FGA, PON1, ADH1C, G6PC, and CYP2D6 across various cell types as determined by single-cell RNA-seq analysis. (B) KEGG analysis of the DEGs between the high and low-risk cells. (C, D) The ligand-receptor interactions sent from high-risk tumor cells and low-risk tumor cells. (E, F) Circos plots illustrating the CXCL and MIF signaling pathway networks, along with heatmaps depicting the involvement of different cell types in these pathway networks.
Figure 10
Figure 10
Construction and evaluation of the nomogram based on PMRS. (A, B) Univariate Cox and Multivariate Cox analysis of TCGA-LIHC,GSE14520 and ICGC cohorts. (C) Nomogram for predicting the 1-, 3-, and 5-year survival rates based on the PMRS. (D) The comparison of the C index between the nomogram and other clinical characteristics. (E) ROC curves illustrating the predictive performance of the nomogram for 1-, 3-, and 5-year OS in the TCGA-LIHC cohort. (F) Calibration curve of the nomogram for 1, 3, and 5-year OS. (G) Decision curve analysis (DCA) showing the net benefit by applying the nomogram and other clinical characteristics. (H) ROC curves illustrating the predictive performance of the nomogram for 1-, 3-, and 5-year OS in the GSE14520 cohort. (I) ROC curves illustrating the predictive performance of the nomogram for 1-, 3-, and 4-year OS in the ICGC cohort. (J) Alluvial diagram depicting the interrelationship between clust subtypes, PMGS, risk groups, and survival status in TCGA-LIHC patients.
Figure 11
Figure 11
Transcriptome features of HCC patients with different PMRS. (A, B) GO terms enriched in the high-risk and low-risk groups based on GSEA analysis. (C) Differences in hallmark pathway activities between the high-risk and low-risk groups, as scored by GSVA. (D) Correlation between the risk score and hallmark pathway activities, as scored by GSVA. (E–J) Kaplan–Meier survival plots showing significant correlations between OS and GSVA scores for HALLMARK DNA REPAIR (E), HALLMARK G2M CHECKPOINT (F), HALLMARK PI3K AKT MTOR SIGNALING (G), HALLMARK COAGULATION (H), HALLMARK MYOGENESIS (I), and HALLMARK PANCREAS BETA CELLS (J).
Figure 12
Figure 12
Distinct mutation landscapes between the high-risk and low-risk groups. (A, B) Waterfall plots of the top 20 genes by mutation frequency in the high-risk and low-risk groups. (C, D) Co-mutation and mutually exclusive mutation maps of the top 20 genes in the high and low risk groups. (E) The violin plot shows the difference in mutation allele tumor heterogeneity (MATH) scores between the high-risk and low-risk groups. (F) Spearman correlation analysis between MATH score and riskscore. (G) The Kaplan-Meier survival curve shows the OS differences between high and low MATH score groups. (H) Distribution of tumor mutational burden (TMB) in the high-risk and low-risk groups. (I) Distribution of CNV frequencies among DEGs between the high-risk and low-risk groups. * P <0.05.
Figure 13
Figure 13
The immune landscape associated with PMRS in HCC. (A, B) The StromalScore, ImmuneScore, ESTIMATEScore, and TumorPurity were used to quantify the differences in immune status between the high-risk and low-risk groups. (C-E) Spearman correlation analysis between StromalScore, ESTIMATEScore, PMG score (PMGS), and riskscore. (F, G) Different immune cell infiltration patterns between the high-risk and low-risk groups. (H) Abundance of each TME-infiltrated cell type between the high-risk and low-risk groups, quantified using the CIBERSORT algorithm. (I) The association between TME-infiltrated cells and genes included in the PMRS. NS, not statistically significant; *p < 0.05; **p < 0.01; ***p < 0.001.
Figure 14
Figure 14
Immunotherapy sensitivity analysis between the high-risk and low-risk groups. (A) Immune-related pathways’ activity showing a significant difference between high- and low-risk groups. (B) The expression of immune checkpoints in high- and low-risk groups. (C) IPS score comparison between the high-risk and low-risk groups. (D) Comparison of TIDE scores between the high-risk and low-risk groups. (E) Comparison of non-Responders and Responders to immunotherapy based on the TIDE analysis between the high and low risk groups. (F) A boxplot depicting the difference in riskscore between patients with CR/PR and those with SD/PD in the IMvigor210 cohort. (G) The proportion of CR/PR or SD/PD patients, who received immunotherapy, in high- and low-risk groups of the IMvigor210 cohort. (H) The Kaplan-Meier survival curve shows the difference in OS between high-risk and low-risk groups in the IMvigor210 cohort. (I) A boxplot depicting the difference in risk scores between patients with TACE response and those with TACE non-response in the GSE104580 cohort. (J) The proportion of TACE response and TACE non-response patients in the high-risk and low-risk groups of the GSE104580 cohort. (K) ROC curve to predict TACE treatment response using the riskscore.
Figure 15
Figure 15
Association between the PMRS and drug sensitivity and validation of the genes. (A) Analyzing the association between IC50 values and the riskscores in patients with HCC. (B-E) Analysis of correlation and differences in sensitivity to drugs among potential medications derived from the CTRP and PRISM datasets. (F-N) Validation of the expression of ADH1C (F), APOA1 (G), CFHR1 (H), CYP2C9 (I), CYP2D6 (J), G6PC (K), FGA (L), HMGCS2 (M), PON1 (N), NS, not statistically significant; *P < 0.05; **P < 0.01; ***P < 0.001.

Similar articles

Cited by

References

    1. Llovet JM, Castet F, Heikenwalder M, Maini MK, Mazzaferro V, Pinato DJ, et al. . Immunotherapies for hepatocellular carcinoma. Nat Rev Clin Oncol. (2022) 19:151–72. doi: 10.1038/s41571-021-00573-2 - DOI - PubMed
    1. Toh MR, Wong EYT, Wong SH, Ng AWT, Loo LH, Chow PK, et al. . Global epidemiology and genetics of hepatocellular carcinoma. Gastroenterology. (2023) 164:766–82. doi: 10.1053/j.gastro.2023.01.033 - DOI - PubMed
    1. Kim E, Viatour P. Hepatocellular carcinoma: old friends and new tricks. Exp Mol Med. (2020) 52:1898–907. doi: 10.1038/s12276-020-00527-1 - DOI - PMC - PubMed
    1. Galle PR, Finn RS, Qin S, Ikeda M, Zhu AX, Kim TY, et al. . Patient-reported outcomes with atezolizumab plus bevacizumab versus sorafenib in patients with unresectable hepatocellular carcinoma (IMbrave150): an open-label, randomised, phase 3 trial. Lancet Oncol. (2021) 22:991–1001. doi: 10.1016/S1470-2045(21)00151-0 - DOI - PubMed
    1. Liu Z, Liu X, Liang J, Liu Y, Hou X, Zhang M, et al. . Immunotherapy for hepatocellular carcinoma: current status and future prospects. Front Immunol. (2021) 12:765101. doi: 10.3389/fimmu.2021.765101 - DOI - PMC - PubMed

MeSH terms

LinkOut - more resources