

Tibial tubercle torsion is associated with patellar height when measured by computed tomography
- PMID: 40330812
- PMCID: PMC12053445
- DOI: 10.1002/jeo2.70258
Tibial tubercle torsion is associated with patellar height when measured by computed tomography
Abstract
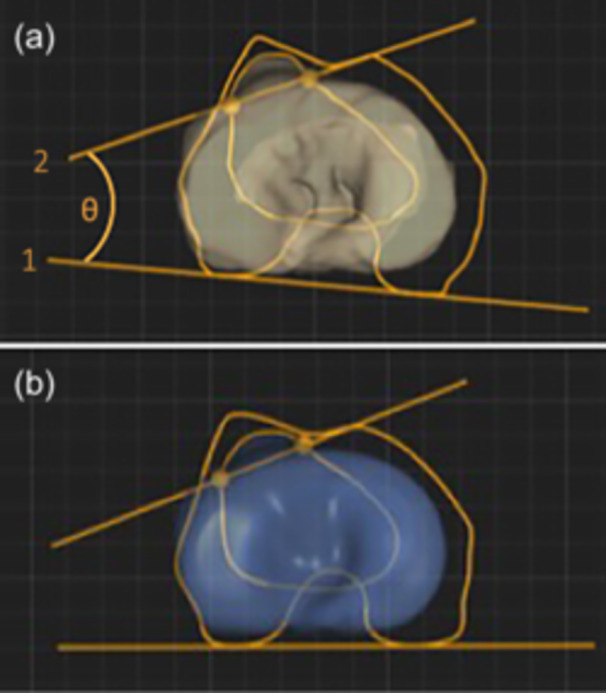
Purpose: To establish an average tibial tubercle (TT) torsion angle from computed tomography (CT) scans of patients without known patellofemoral instability and investigate whether TT torsion angles would differ based on demographics, tibial tubercle-trochlear groove (TT-TG) distance and patellar height.
Methods: The Stryker Orthopaedics Modeling and Analytics (SOMA) database was queried for patients with CT scans and available measures related to patella and TT position. The mean TT torsion angle was compared in patients with an increased and normal TT-TG distance (≥20 vs. <20 mm) and patellar height (Insall-Salvati [IS] index ≥1.3 vs. <1.3). Measurements of sulcus angle, patellar inclination angle, congruence angle, trochlear groove depth and long limb axis alignment were assessed.
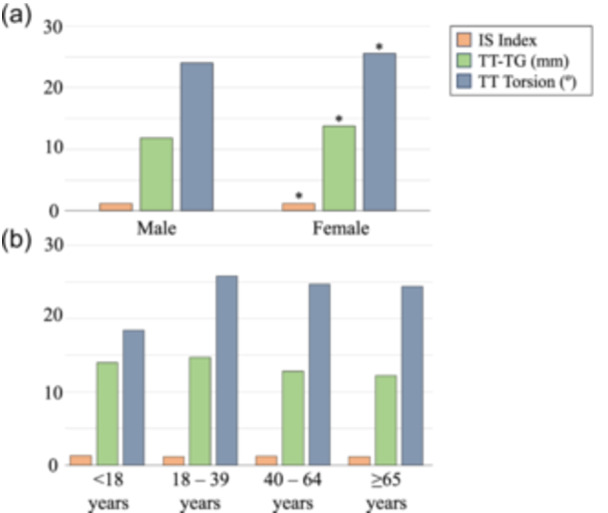
Results: A total of 886 knees from 499 patients within the SOMA database were included, with a mean age of 59.4 ± 16.5 years and 238 (48%) females. The mean TT torsion angle for all patients was 24.7 ± 5.2°. Females had a significantly higher mean IS index (1.24 vs. 1.18), TT-TG distance (13.8 mm vs. 11.8 mm) and TT torsion angle (25.5° vs. 24.0°) compared to males. The mean TT torsion angle for patients with a TT-TG distance ≥20 mm and <20 mm was 24.7° in both groups (p = n.s.). There was a significantly greater TT torsion angle in patients with an IS index ≥1.3 (26.6°) compared to those with an IS index <1.3 (24.0°) (p < 0.001). A weak and positive correlation was found between TT torsion angle and IS index (r = 0.242, p < 0.001), but not with other measurements.
Conclusion: The mean TT torsion angle for patients without known patellofemoral instability was 24.7° and increased TT torsion angles were associated with increased patellar height. An association between TT torsion and TT-TG was not found. Findings of the current study describe the relationship between morphologic assessments of the patellofemoral joint using CT.
Level of evidence: Level IV, cohort study.
Keywords: CT; Insall‐Salvati index; TTTG; patellar height; patellar instability; tibial tubercle torsion.
© 2025 The Author(s). Journal of Experimental Orthopaedics published by John Wiley & Sons Ltd on behalf of European Society of Sports Traumatology, Knee Surgery and Arthroscopy.
Conflict of interest statement
Matthieu Ollivier is a Newclip educational consultant and receives royalties from Stryker. Sally LiArno and Faizan Ahmad are employees of Stryker. The remaining authors declare no conflicts of interest.
Figures
Similar articles
-
Patellar Instability.2023 Sep 4. In: StatPearls [Internet]. Treasure Island (FL): StatPearls Publishing; 2025 Jan–. 2023 Sep 4. In: StatPearls [Internet]. Treasure Island (FL): StatPearls Publishing; 2025 Jan–. PMID: 29494034 Free Books & Documents.
-
Ratio of Tibial Tubercle-Trochlear Groove Distance to Patellar Width as a Predictor of Patellar Dislocation: Analysis of Individualized Tibial Tubercle Lateralization Parameters.Orthop J Sports Med. 2024 Oct 8;12(10):23259671241276446. doi: 10.1177/23259671241276446. eCollection 2024 Oct. Orthop J Sports Med. 2024. PMID: 39385968 Free PMC article.
-
Sulcus depth, congruence angle, Wiberg index, TT-TG distance, and CDI are strong predictors of recurrent patellar dislocation.Knee Surg Sports Traumatol Arthrosc. 2023 Jul;31(7):2906-2916. doi: 10.1007/s00167-022-07245-3. Epub 2022 Dec 4. Knee Surg Sports Traumatol Arthrosc. 2023. PMID: 36463567
-
Radiologic Measurements in the Assessment of Patellar Instability: A Systematic Review and Meta-analysis.Orthop J Sports Med. 2021 May 20;9(5):2325967121993179. doi: 10.1177/2325967121993179. eCollection 2021 May. Orthop J Sports Med. 2021. PMID: 34095324 Free PMC article. Review.
-
Current evidence advocates use of a new pathologic tibial tubercle-posterior cruciate ligament distance threshold in patients with patellar instability.Knee Surg Sports Traumatol Arthrosc. 2018 Sep;26(9):2733-2742. doi: 10.1007/s00167-017-4716-2. Epub 2017 Sep 16. Knee Surg Sports Traumatol Arthrosc. 2018. PMID: 28918500
References
-
- Ackermann J, Hasler J, Graf DN, Fucentese SF, Vlachopoulos L. The effect of native knee rotation on the tibial‐tubercle‐trochlear‐groove distance in patients with patellar instability: an analysis of MRI and CT measurements. Arch Orthop Trauma Surg. 2022;142:3149–3155. - PubMed
-
- Bremond N, Prima R, Rabattu PY, Accadbled F, Chotel F, Konkel M, et al. Isolated MPFL reconstruction with soft tissue femoral fixation technique in 54 skeletally immature patients: clinical outcomes at 2 years follow‐up. A French multicenter retrospective study. Orthop Traumatol Surg Res. 2023;109:103530. - PubMed
-
- Camp CL, Stuart MJ, Krych AJ, Levy BA, Bond JR, Collins MS, et al. CT and MRI measurements of tibial tubercle‐trochlear groove distances are not equivalent in patients with patellar instability. Am J Sports Med. 2013;41:1835–1840. - PubMed
-
- Chassaing V, Zeitoun JM, Camara M, Blin JL, Marque S, Chancelier MD. Tibial tubercle torsion, a new factor of patellar instability. Orthop Traumatol Surg Res. 2017;103:1173–1178. - PubMed
-
- Chassaing V, Vendeuvre T, Blin JL, Decrette E, Zeitoun JM, Courilleau N, et al. How tibial tubercle torsion impacts patellar stability: a biomechanics study. Orthop Traumatol Surg Res. 2020;106:495–501. - PubMed
LinkOut - more resources
Full Text Sources
Research Materials
Miscellaneous
