. 2025 Apr 8;28(5):112377.
doi: 10.1016/j.isci.2025.112377. eCollection 2025 May 16.

Identification of a specific set of genes predicting obesity before phenotype appearance

Affiliations

Identification of a specific set of genes predicting obesity before phenotype appearance

Céline Jousse et al. iScience. .

Abstract

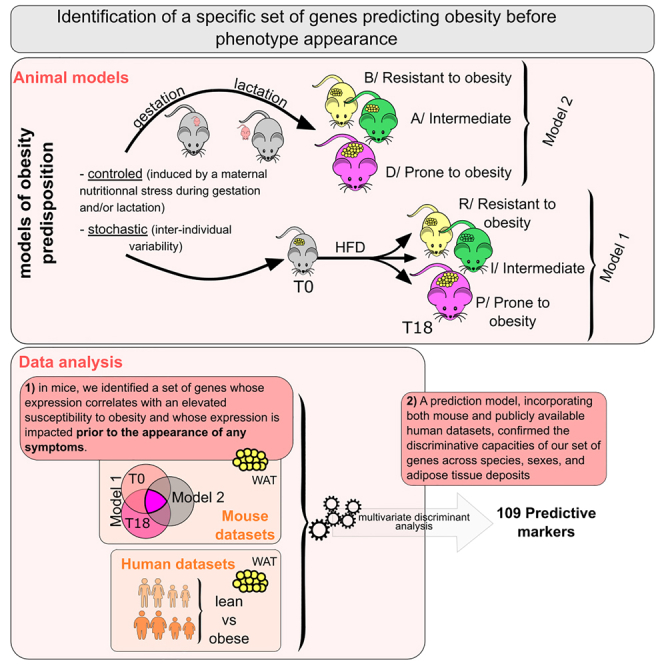
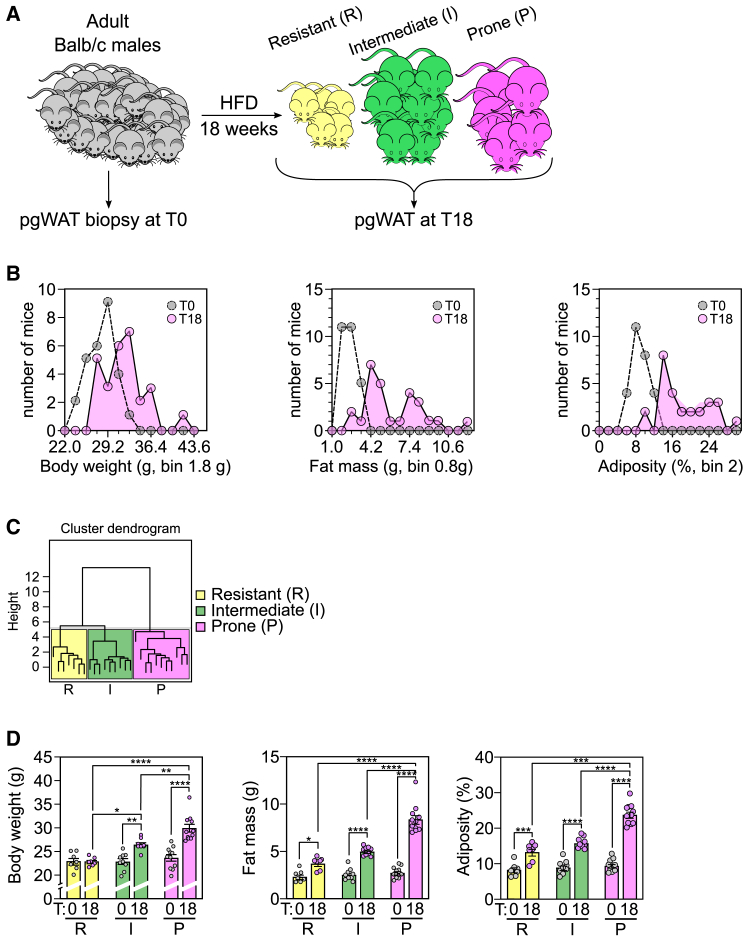
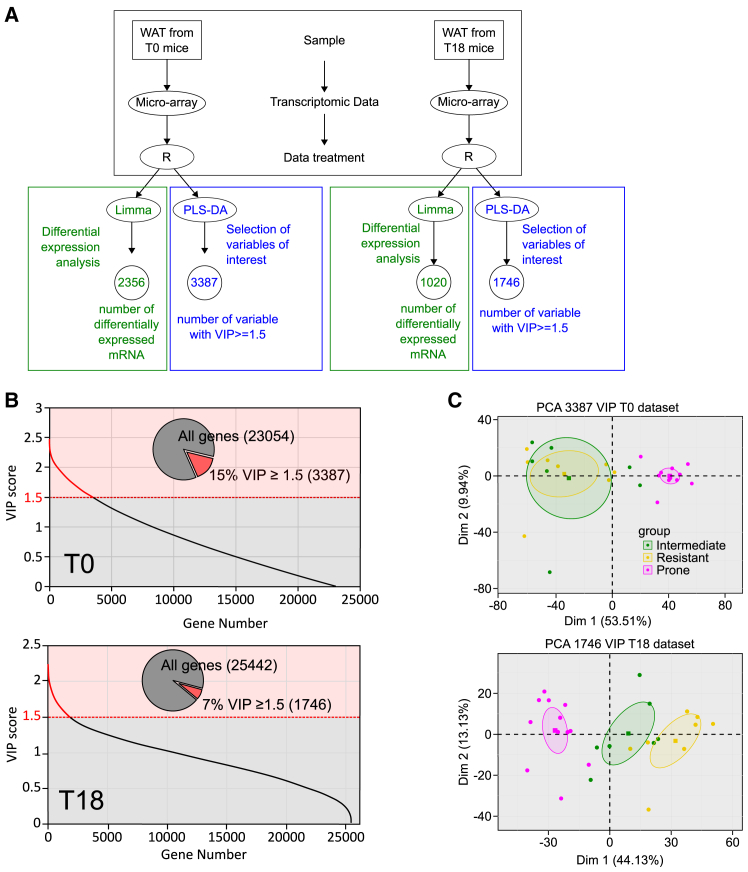
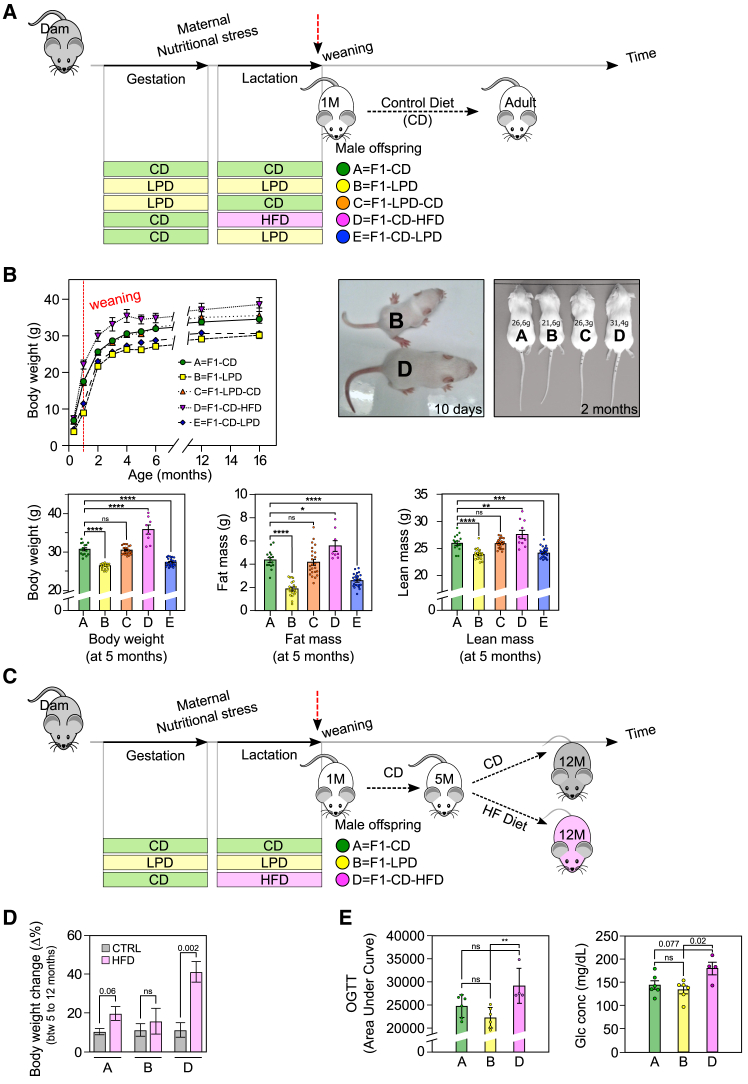
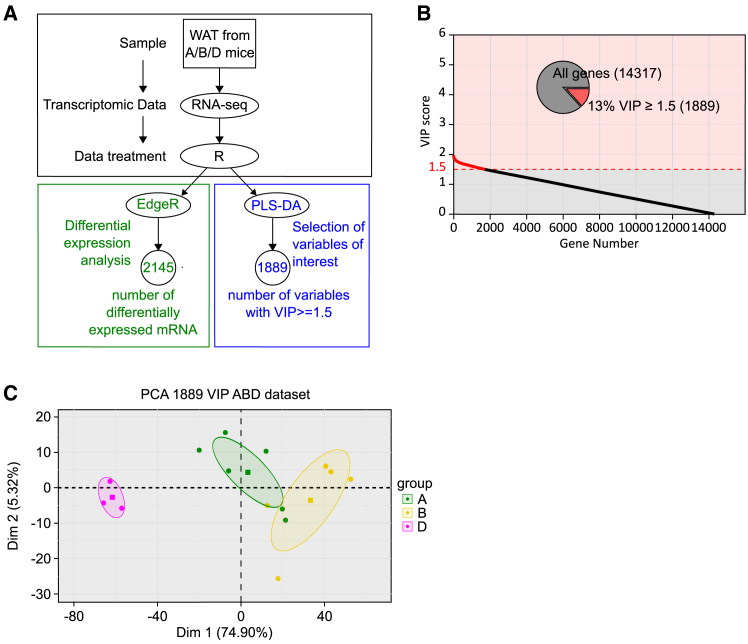
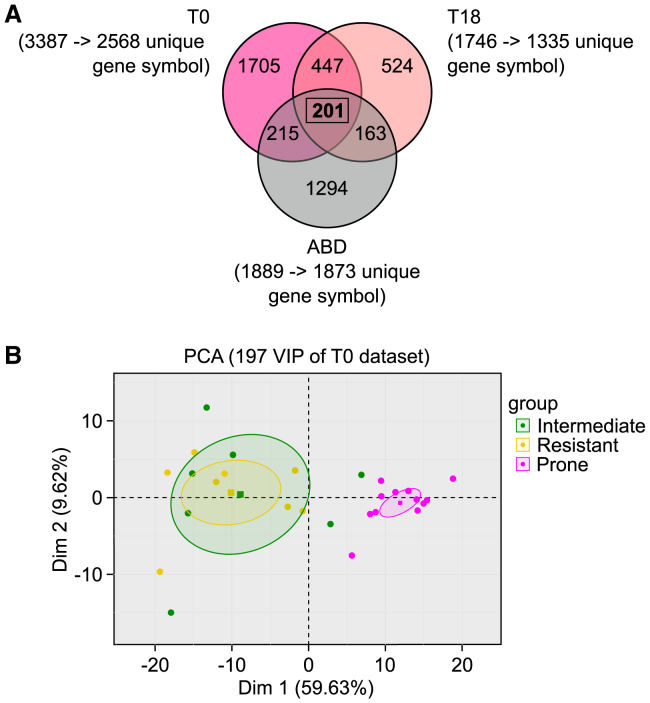
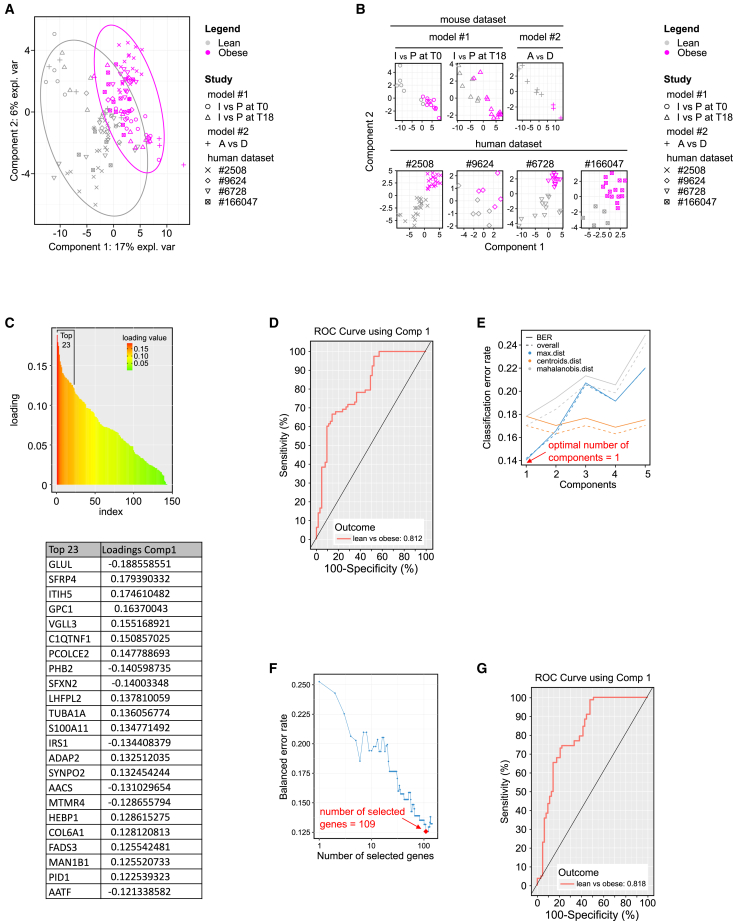
Obesity poses significant health and socioeconomic challenges, necessitating early detection of predisposition for effective personalized prevention. To identify candidate predictive markers, our study used two mouse models: one exhibiting interindividual variability in obesity predisposition and another inducing metabolic phenotypes through maternal nutritional stresses. In both cases, predisposition was assessed by challenging mice with a high-fat diet. Using multivariate analyses of transcriptomic data from white adipose tissue, we identified a set of genes whose expression correlates with an elevated susceptibility to obesity. Importantly, the expression of these genes was impacted prior to the appearance of any symptoms. A prediction model, incorporating both mouse and publicly available human datasets, confirmed the discriminative capacities of our set of genes across species, sexes, and adipose tissue deposits. These genes are promising candidates to serve as diagnostic tools for identifying individuals at risk of obesity.

Keywords: Genetics; Physiology; Transcriptomics.


Conflict of interest statement

The authors declare no competing interests.

Figures

None
Graphical abstract
Figure 1
Figure 1
Innate proneness to diet-induced obesity exhibits a large degree of variability among individuals (A) Experimental model. 4-month-old BALB/c males mice were monitored (n = 27). At T0, perigonadal WAT (pg-WAT) biopsies were taken. Animals were allowed to recover for 1 week. Subsequently, they were fed an experimental high-fat diet (HFD) for 18 weeks after which they were sacrificed (T18) to harvest pg-WAT. Schematically, at the end of the HFD challenge, the mice exhibit different sensitivities to obesity and will thus be categorized into 3 groups: R mice are resistant to diet-induced obesity (DIO), I mice have an intermediate phenotype, and P mice are prone to DIO. (B) Phenotypic characterization of mice based on sensitivity to DIO. Individual parameters such as body weight (g), fat mass (g), and adiposity (%) were measured at T0 (before HFD challenge) and at T18 (after 18 weeks consuming an HFD). Graphs show the distribution of the number of mice according to each parameter. Gray dots represent the animal before HFD challenge, filled dots represent animals after HFD challenge (T18). In each case, three groups of mice exhibiting different behavior regarding diet-induced changes in physical parameters are clearly identified. (C) Hierarchical clustering analysis (HCA) considers all the physical parameters measured (i.e., body weight, fat mass, and adiposity at T18, delta% body weight, delta% fat mass, and delta% adiposity) to classify mice in three groups: R mice are resistant to DIO (n = 7), P mice are prone to DIO (n = 11), and I mice exhibit an intermediate phenotype (n = 9). (D) Body weight, fat mass, and adiposity before and after HFD challenge for each group R, I, and P. Body weight (g), fat mass (g), and adiposity (%) at T0 (gray dots) and T18 (pink dots) for R, I, and P groups (n = 7, 9, and 11, respectively). Bars represent the mean for each group and error bars correspond to SEM. One-way ANOVA p value is indicated as follows: ∗p ≤ 0.05; ∗∗p ≤ 0.01; ∗∗∗p ≤ 0.001; ∗∗∗∗p ≤ 0.0001.
Figure 2
Figure 2
Identification of a set of genes as early predictive markers of predisposition to DIO (A) Workflow to select genes of interest. Micro-arrays were performed on RNA extracted from pg-WAT harvested at T0 and T18 from mice in the three groups R (n = 8), I (n = 7), and P (n = 12). Raw data were treated with the R package Limma prior to differential expression analysis (green part of the workflow). The mixOmics R package was used for PLS-DA (blue part of the workflow) in order to identify important genes based on their VIP scores. A VIP score is a measure of a variable’s importance in the PLS-DA model. It summarizes the contribution of a variable makes to the model. (B) Variable of importance in projection (VIP) scores for each gene used in the PLS-DA. Genes contributing meaningfully to the PLS-DA model with a VIP score >1.5 constitute, respectively, 15% and 7% of the genes tested for T0 and T18 data (inset pie chart). The y axis corresponds to the VIP scores for each variable on the x axis. Red part of the curve corresponds to genes with the highest VIP scores (≥1.5) and thus are the most contributory genes in class discrimination in the PLS-DA model. (C) Principal component analysis (PCA). PCA was performed using the set of 1,746 mRNA selected by PLS-DA at T18 and 3,387 mRNA selected by PLS-DA at T0. Data from groups I (green dots), R (yellow dots), and P (pink dots) are plotted, along the first (x) and second (y) principal components. Ellipses represent the 95% confidence interval, and squares represent the barycenter of each group.
Figure 3
Figure 3
The metabolic fate of the offspring is primarily determined by the nutritional status of the mother (A) Experimental model. Two-month-old virgin BALB/c female mice fed an A03 chow diet were mated with BALB/c males. Gestating animals were isolated when a vaginal plug was detected and fed the experimental diet as indicated. LPD and CD are isocaloric. At parturition, dams and litters were fed with the experimental diets indicated. Litters of different sizes were obtained from each group of pregnant female. Since the litter size is important in the offspring life trajectory, we considered only litters that have a total number of pups comprised between 4 and 10 to avoid extreme litter size. After weaning, male offspring from each group were housed individually with free access to CD. Moreover, to obviate any litter effects, animals used for each experiment were randomly chosen from different litters, and only a limited number of animals (n = 1 to 2) were used from each litter. (B) Phenotypic characterization of male offspring born from dams fed various diets during gestation and lactation: (upper left) male offspring born from dams fed experimental diets during gestation and lactation were weighed at postnatal day 10 (PND10), every month from 1 to 6 months and at 12 and 16 months. The results presented are the average of 3 independent experiments. Upper right, representative mice from groups B and D at PND10 and from groups A, B, C, and D at 2 months. Body weight is indicated for each mouse. Bottom, body composition parameters of 5-month-old A, B, C, D, and E male mice. Body weight, fat mass, and lean mass are indicated in grams. All values correspond to mean ± SEM for at least n = 8/group. One-way ANOVA p value is indicated as follows: ∗p ≤ 0.05; ∗∗p ≤ 0.01; ∗∗∗p ≤ 0.001; ∗∗∗∗p ≤ 0.0001; ns = not significant. (C) Experimental model for the HFD challenge on groups A, B, and D: 5-month-old male offspring from groups A, B, and D were fed either a CD or an HFD from the age of 5 to 12 months (7-month HFD challenge). (D) Body weight gain during HFD challenge: Body weight gain between the beginning (5 months) and the end (12 months) of the HFD challenge was calculated and expressed as the weight gain relative to the initial weight, given in percentage. n ≥ 4/group, one-way ANOVA p value is indicated, ns = not significant. (E) OGTT measured after HFD challenge: 12-month-old male mice from groups A, B, or D fed an HFD for 5 months were subjected to an oral glucose tolerance test. Area under curve and starved glucose concentration were measured. n ≥ 4, one-way ANOVA p value is indicated as follows: ns = not significant, ∗∗p < 0.01.
Figure 4
Figure 4
Identification of a set of genes whose expression correlates with predisposition to DIO in a nutritional programming model (A) Workflow to select genes of interest. RNA sequencing was performed on RNA extracted from pg-WAT harvested from 5-month-old mice from the three groups A (n = 6), B (n = 5), and D (n = 3). Raw data were treated with the R package EdgeR prior to differential expression analysis (green part of the workflow). The mixOmics R package was used for PLS-DA (blue part of the workflow) to identify important genes based on their VIP scores. (B) Variable of importance in projection (VIP) scores for each gene used in the PLS-DA. Genes contributing meaningfully to the PLS-DA model with a VIP score >1.5 constitute 13% of the genes tested (inset pie chart). The y axis indicates the VIP scores for each variable indicated on the x axis. Red dots indicate variables with the highest VIP scores (≥1.5) and thus contributing the most to class discrimination in the PLS-DA model. (C) Principal component analysis (PCA). PCA was performed using the set of 1,889 mRNA selected by PLS-DA. Data from groups A (green dots), B (yellow dots), and D (pink dots) are plotted along the first (x) and second (y) principal components. Ellipses represent the 95% confidence interval, and squares represent the barycenter of each group.
Figure 5
Figure 5
Identification of candidate genes and evaluation of their discriminant potential (A) Identification strategy. To identify the most robust predictive genes, we compared the three gene lists (containing 1,889, 1,746, and 3387 genes from the three datasets ABD, T0, and T18) obtained by PLS-DA and identified a list of 201 genes. Among these 201 common genes, 4 presented an adjusted q value ≥ 0.05 for all three datasets (ABD, T0, and T18) and were therefore eliminated, leaving 197 selected genes (Table S1, column A). (B) Principal component analysis (PCA) was performed using the expression of the 197 selected genes from the first model at T0. Data from groups I (green dots), R (yellow dots), and P (pink dots) are plotted with respect to the first (x) and second (y) principal components. Ellipses represent the 95% confidence interval, and squares represent the barycenter of each group.
Figure 6
Figure 6
Candidate genes identified in mice discriminate between lean and obese humans Three mouse datasets were used: nutritional programming model (groups A and D), innate variability model at T0 (group I and P), and innate variability model at T18 (group I and P) together with four human datasets from publicly available resources (ArrayExpress: E-GEOD-2508: microarray data obtained from isolated adipocytes of subcutaneous adipose deposits from Pima Indians, male or female and lean or obese. Cohort ArrayExpress: E-MTAB-6728 contains a large number of lean and obese individuals without specifications on biological sex. Cohort GEO: GSE-166047 consists of lean and obese females. A cohort of children [ArrayExpress: E-GEOD-9624] for whom omental adipose tissue samples were analyzed, see Table S2 for details and references). (A–D) MINT.plsda (Multivariate INTegration plsda) including both mouse and human datasets. (A) Sample plot from the MINT PLS-DA performed on the seven gene expression datasets. Samples are projected into the space corresponding to the first two components. Sample colors reflect their group (lean, obese), and symbols indicate the source study. (B) Study-specific sample plots showing the projection of samples from each of the datasets in the same subspace spanned by the first two MINT components. (C) Top, distribution of genes according to their loading values. Bottom, top 23 of the genes according to their loading value (loading value >0.12), selected arbitrarily, for illustration purpose, on the basis of the break observed in the distribution graph. (D) ROC curve and AUC from the MINT PLS-DA for the seven gene expression datasets. In an ROC curve, the true positive rate (i.e., the proportion of correctly predicted positive instances relative to all actual positive instances = sensitivity) is plotted in function of the false positive rate (i.e., the proportion of incorrectly predicted positive instances relative to all actual negative instances = 100-specificity). The numerical output indicated is the AUC measuring the overall performance of the model. It quantifies the ability of the model to discriminate between positive and negative classes. A higher AUC indicates better performance. AUC values greater than 0.8 are often considered very good and suggest a model with strong discriminative power. (E–G) MINT.splsda (Multivariate INTegration sparse plsda) including both mouse and human datasets. (E) Choosing the number of components in mint.splsda using “perf()” with LOGOCV (leave-one-group-out cross-validation) applied to the seven gene expression datasets. Classification error rates (overall and balanced) are represented on the y axis with respect to the number of components on the x axis for each prediction. The plot shows that the error rate reaches a minimum from one component with the BER and max distance. (F) Tuning keepX in MINT.splsda performed on the seven gene expression datasets. The line represents the balanced error rate (y axis) for component 1 across all tested keepX values (x axis). keepX refers to the minimum number of genes needed to retain a model with performance comparable to that of the initial model. The diamond indicates the optimal keepX value, which achieves the lowest classification error rate as determined with a one-sided t test across the studies. (G) ROC curve and AUC from the MINT.splsda performed on the seven gene expression datasets.

Similar articles

References

    1. Billings L.K., Florez J.C. The genetics of type 2 diabetes: what have we learned from GWAS? Ann. N. Y. Acad. Sci. 2010;1212:59–77. doi: 10.1111/j.1749-6632.2010.05838.x. - DOI - PMC - PubMed
    1. Huang L.-T. Maternal and Early-Life Nutrition and Health. IJERPH. 2020;17:7982. doi: 10.3390/ijerph17217982. - DOI - PMC - PubMed
    1. Barker D.J., Osmond C. Infant mortality, childhood nutrition, and ischaemic heart disease in England and Wales. Lancet. 1986;1:1077–1081. doi: 10.1016/s0140-6736(86)91340-1. - DOI - PubMed
    1. Barker D.J., Osmond C., Golding J., Kuh D., Wadsworth M.E. Growth in utero, blood pressure in childhood and adult life, and mortality from cardiovascular disease. BMJ. 1989;298:564–567. doi: 10.1136/bmj.298.6673.564. - DOI - PMC - PubMed
    1. Barker D.J.P. The origins of the developmental origins theory. J. Intern. Med. 2007;261:412–417. doi: 10.1111/j.1365-2796.2007.01809.x. - DOI - PubMed

LinkOut - more resources