. 2025 Apr 3;28(5):112339.
doi: 10.1016/j.isci.2025.112339. eCollection 2025 May 16.

The role of Tim-3+T cell subsets in the peripheral blood of patients with COVID-19 and diabetes

Affiliations

The role of Tim-3+T cell subsets in the peripheral blood of patients with COVID-19 and diabetes

Wenjun Luo et al. iScience. .

Abstract

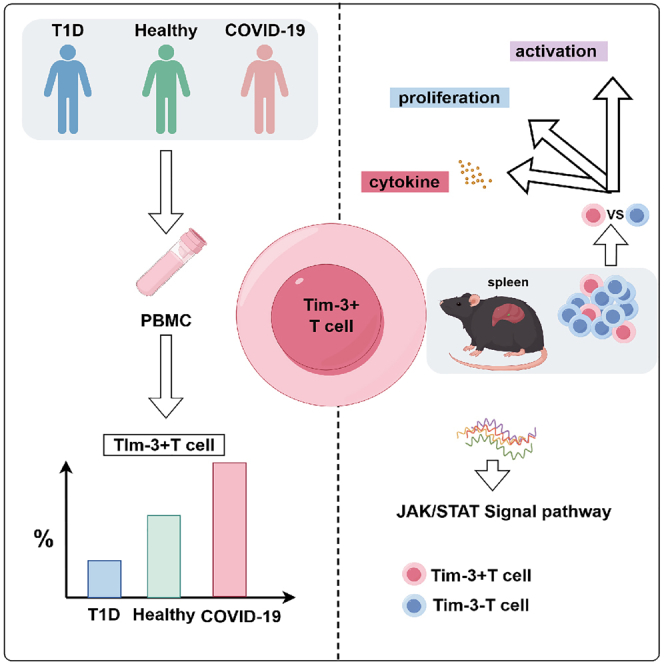
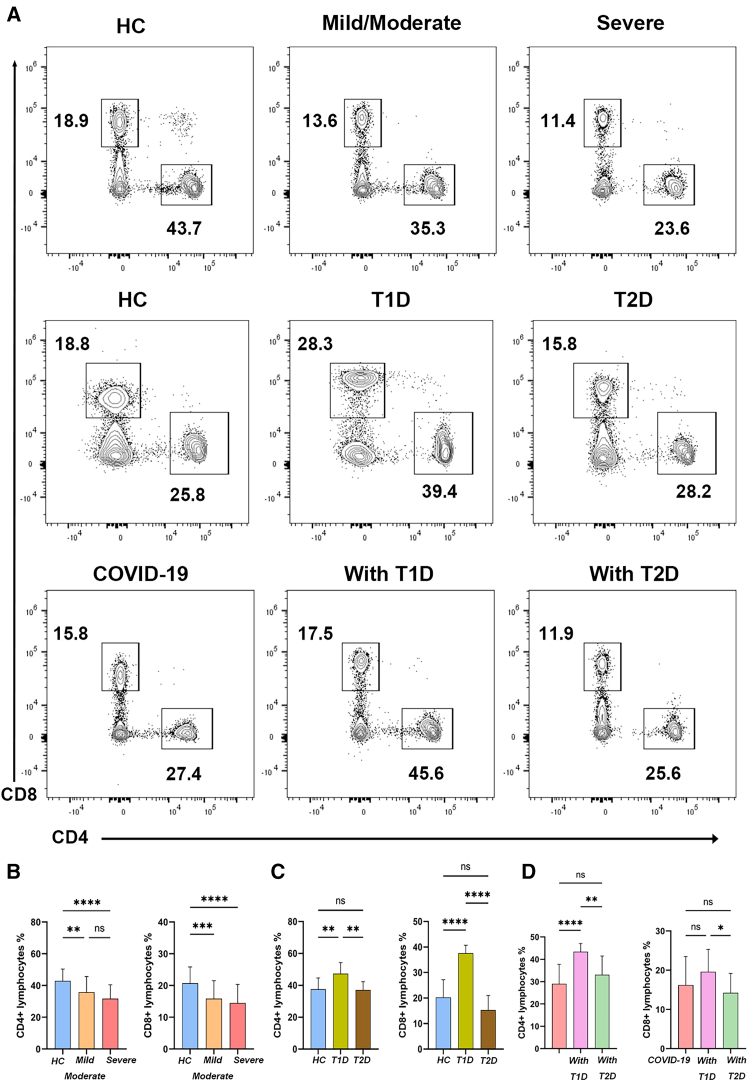
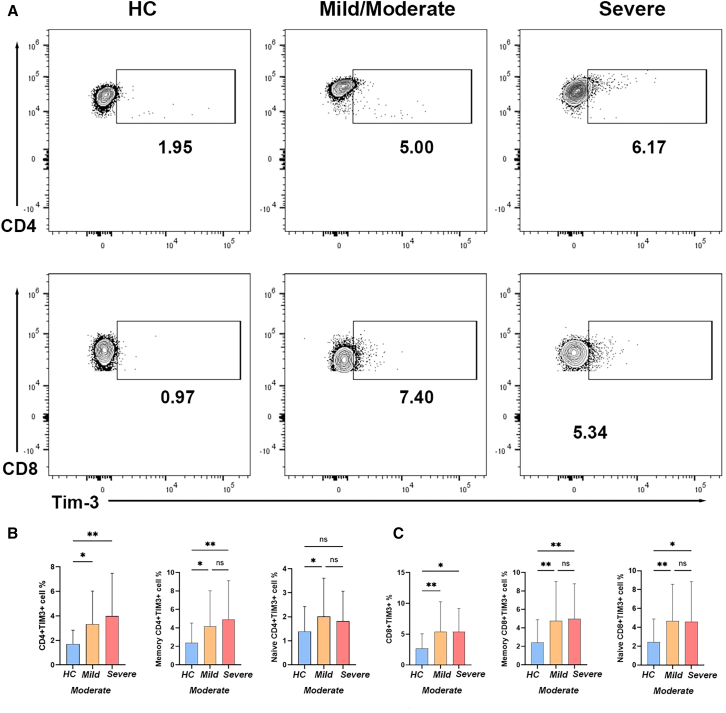
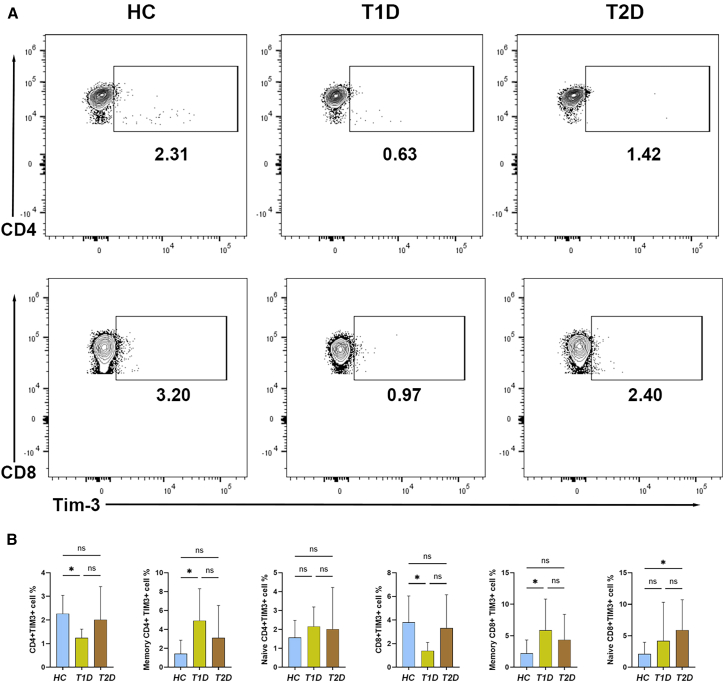
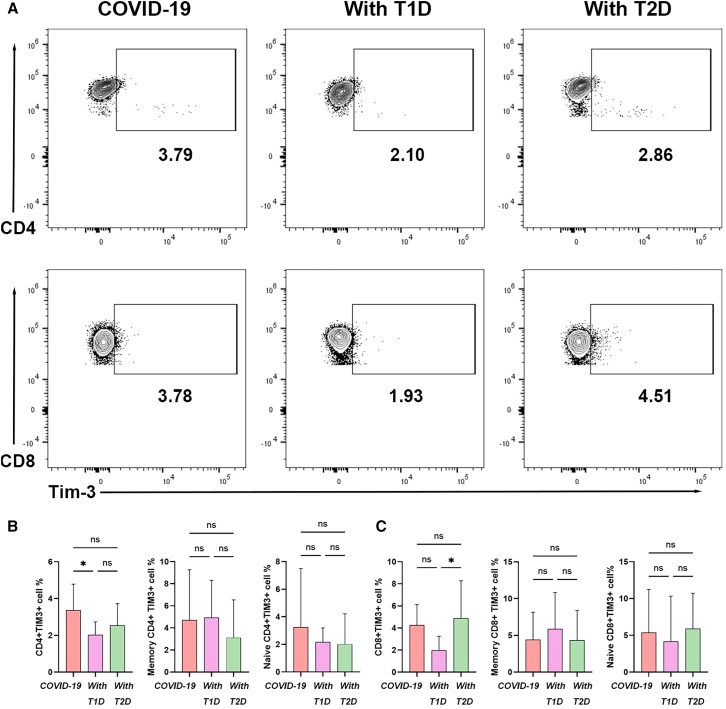
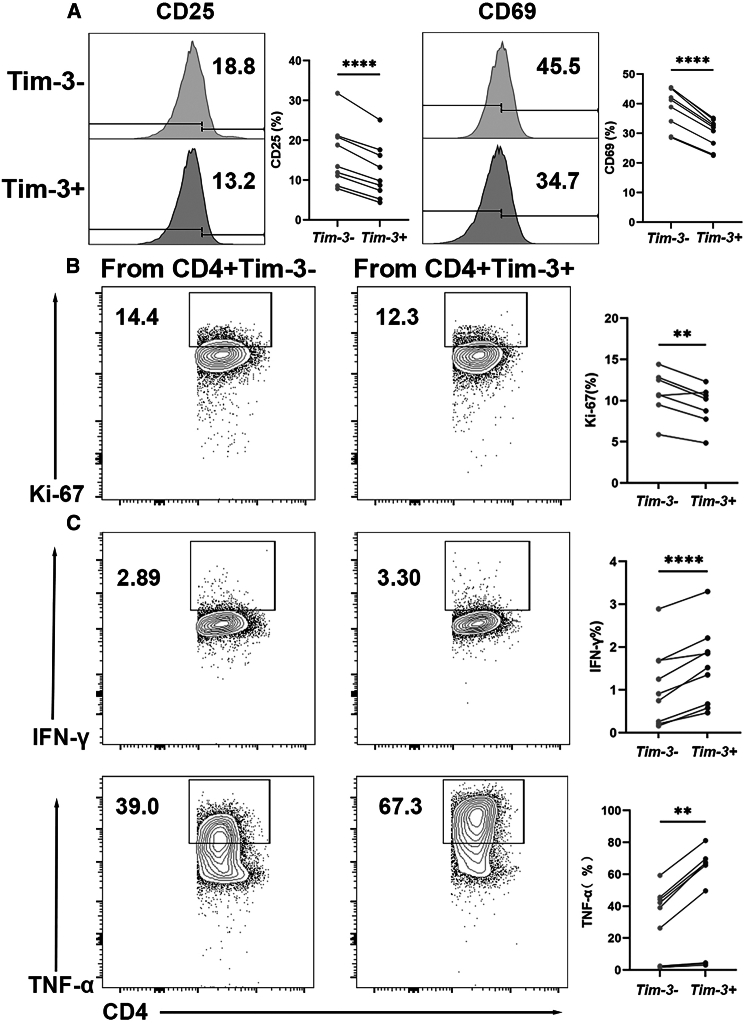
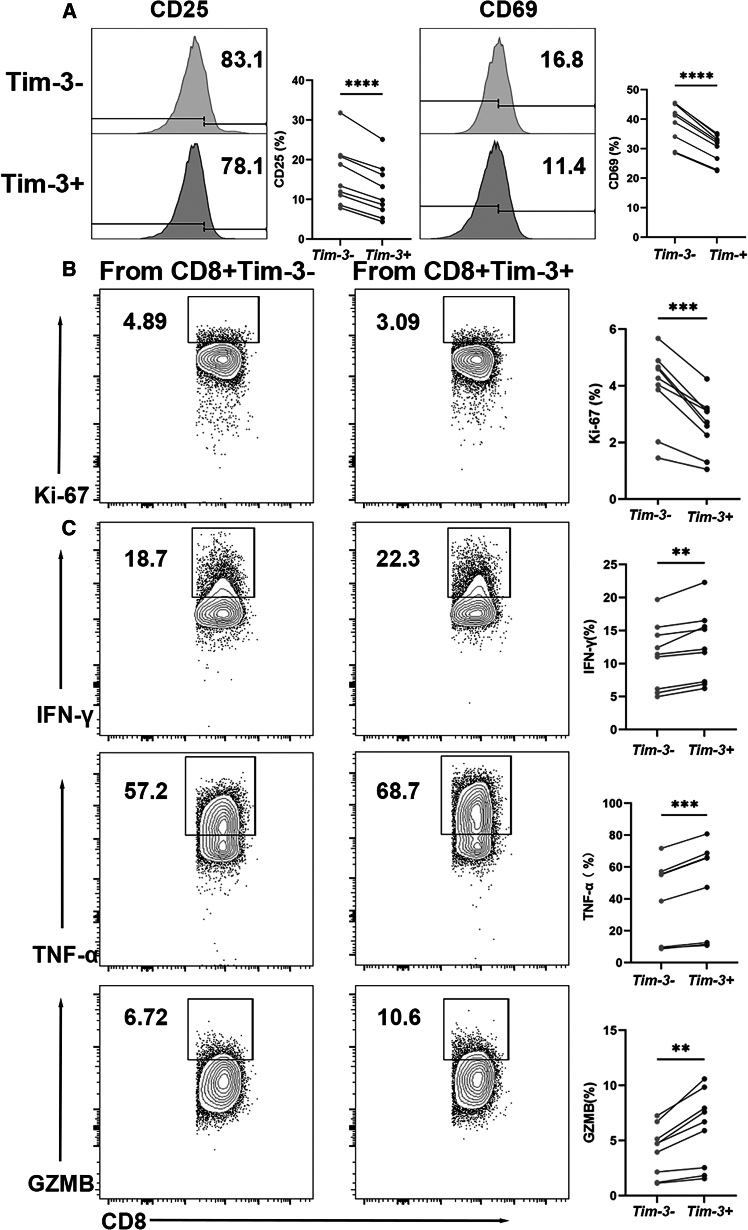
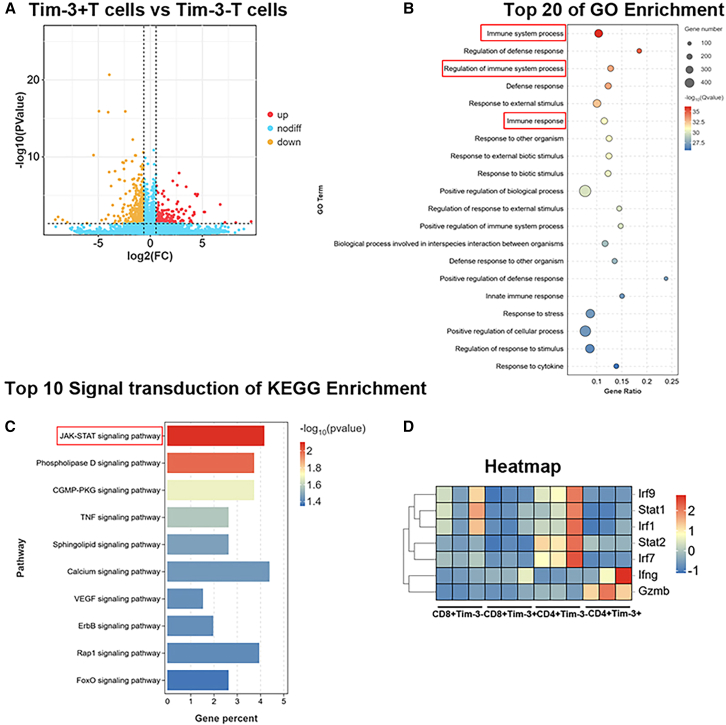
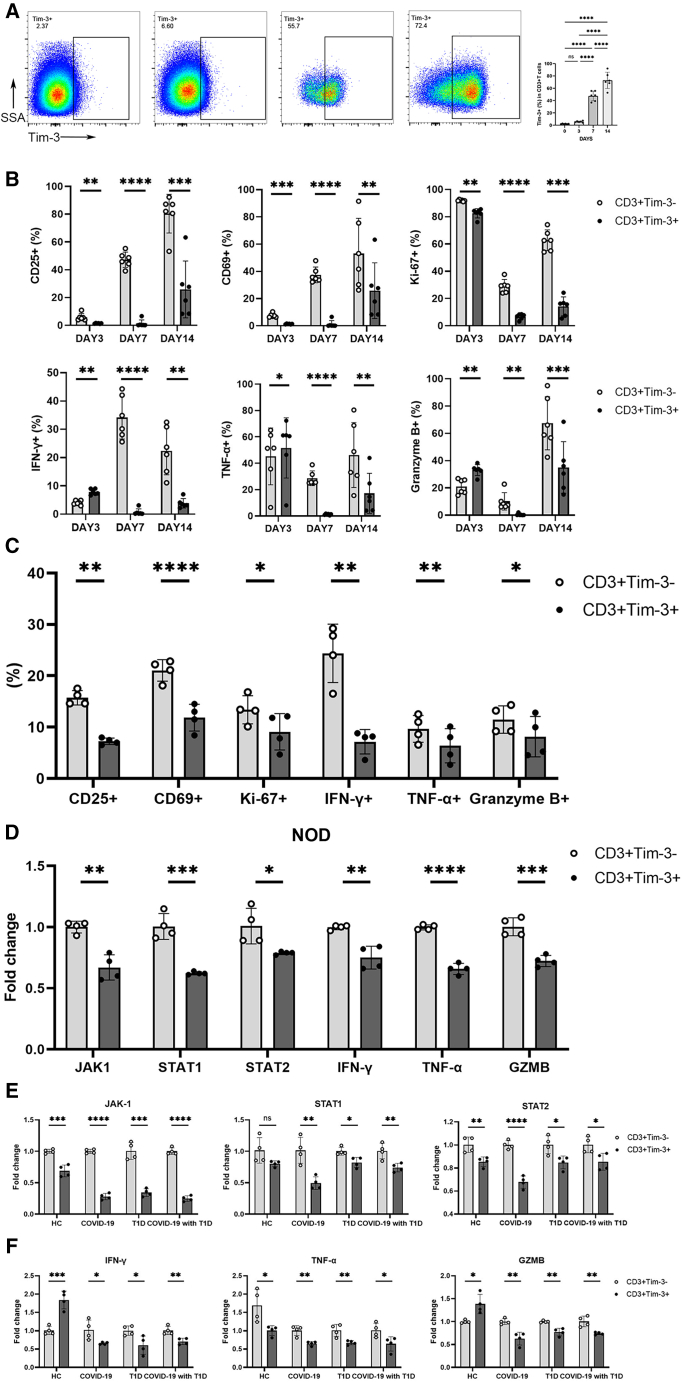
Corona Virus Disease 2019 (COVID-19) and diabetes interact to influence disease severity, yet their combined immunological characteristics remain unclear. Here, we analyzed Tim-3+ T cells in patients with COVID-19, Type 1 Diabetes (T1D), or both conditions. COVID-19 reduced peripheral T cell subsets but increased Tim-3+ cells, while T1D and COVID-19 with T1D showed the opposite pattern. Patients with Type 2 Diabetes (T2D) exhibited no significant alterations. In human samples and mouse models, Tim-3+ T cells demonstrated impaired activation and cytokine production. RNA-seq analysis in mice and RT-PCR analysis in human samples together identified the dysregulation of the JAK-STAT pathway in Tim-3+ T cells. These findings highlight Tim-3-mediated JAK-STAT dysregulation in T-cells as a potential mechanism linking COVID-19 and T1D, offering insights for therapeutic targeting.

Keywords: Disease; Immune response; Immunology.


Conflict of interest statement

The authors declare no competing interests.

Figures

None
Graphical abstract
Figure 1
Figure 1
Proportions of various T cell subsets in the peripheral blood of healthy controls, patients with COVID-19, and diabetes (A) Flow cytometry plots representing the proportions of CD4+T cell subsets and CD8+T cell subsets in the peripheral blood of healthy controls and patients with COVID-19 with different severities. T1D, T2D, and COVID-19 with T1D or T2D. (B) Bar graphs representing the proportions of CD4+T cell subsets and CD8+T cell subsets in the peripheral blood of healthy controls and patients with COVID-19 with different severities. (36 healthy controls, 24 mild-to-moderate COVID-19 cases, 18 severe COVID-19 cases). (C) Bar graphs representing the proportions of CD4+T cell subsets and CD8+T cell subsets in the peripheral blood of HC, T1D, and T2D. (36 healthy controls, 10 patients with T1D, 35 patients with T2D ). (D) Bar graphs representing the proportions of CD4+T cell subsets and CD8+T cell subsets in the peripheral blood of COVID-19 alone, COVID-19 with T1D, and COVID-19 with T2D. (42 patients with COVID-19 alone, 11 patients with COVID-19 with T1D, 52 patients with COVID-19 with T2D). (∗p < 0.05, ∗∗p < 0.01, ∗∗∗p < 0.001, ∗∗∗∗p < 0.0001).
Figure 2
Figure 2
Increased frequency of Tim-3+T cell subsets in COVID-19 with different severities (A) Flow cytometry was performed to detect the proportions of Tim-3+CD4+T and CD8+T in the peripheral blood of healthy controls and patients with COVID-19 with different severities. (B and C) Statistical analysis of Tim-3+CD4+T cell and CD8+T cell subsets from Healthy Control (n = 36), patients with mild-to-moderate COVID-19 (n = 24), patients with severe COVID-19 (n = 18). (∗p < 0.05, ∗∗p < 0.01).
Figure 3
Figure 3
Decreased frequency of Tim-3+T cell subsets in HC, T1D and T2D (A) Flow cytometry was performed to detect the proportions of Tim-3+CD4+T and CD8+T in the peripheral blood of healthy controls, T1D and T2D. (B and C) Statistical analysis of Tim-3+CD4+T cell and CD8+T cell subsets from Healthy Control (n = 36), patients with T1D (n = 10), patients with T2D (n = 35). (∗p < 0.05).
Figure 4
Figure 4
Decreased frequency of Tim-3+T cell subsets in patients with COVID-19, patients with COVID-19 with T1D or T2D (A) Flow cytometry was performed to detect the proportions of Tim-3+CD4+T and CD8+T in the peripheral blood of patients with COVID-19, patients with COVID-19 with T1D or T2D. (B and C) Statistical analysis of Tim-3+CD4+T cell and CD8+T cell subsets from patients with COVID-19 (n = 42), patients with COVID-19 with T1D (n = 11), patients with COVID-19 with T2D (n = 52). (∗p < 0.05).
Figure 5
Figure 5
In the early stages of stimulation, mouse Tim-3+CD4+T cell subsets exhibited low activation, low proliferation, and high pro-inflammatory cytokine secretion capacity (A) Flow cytometry gating and statistical analysis were conducted to analyze the expression frequency of activation markers, including CD25 and CD69, in Tim-3+CD4+T cells and Tim-3-CD4+T cells. (B) Flow cytometry gating and statistical analysis were performed to analyze the proliferation marker Ki-67 in Tim-3+CD4+T cells and Tim-3-CD4+T cells. (C) Flow cytometry gating and statistical analysis were conducted to analyze the frequency of pro-inflammatory cytokine secretion, including IFN-γ and TNF-α, in Tim-3+CD4+T cells and Tim-3-CD4+T cells. (n = 9, ∗∗p < 0.01, ∗∗∗∗p < 0.0001).
Figure 6
Figure 6
In the early stages of stimulation, mouse Tim-3+CD8+T cell subsets exhibited low activation, low proliferation, and high pro-inflammatory cytokine secretion capacity (A) Flow cytometry gating and statistical analysis were conducted to analyze the expression frequency of activation markers, including CD25 and CD69, in Tim-3+CD8+T cells and Tim-3-CD8+T cells. (B) Flow cytometry gating and statistical analysis were performed to analyze the proliferation marker Ki-67 in Tim-3+CD8+T cells and Tim-3-CD8+T cells. (C) Flow cytometry gating and statistical analysis were conducted to analyze the frequency of pro-inflammatory cytokine secretion, including IFN-γ, TNF-α, and Granzyme B, in Tim-3+CD8+T cells and Tim-3-CD8+T cells. (n = 9, ∗∗p < 0.01, ∗∗∗p < 0.001, ∗∗∗∗p < 0.0001).
Figure 7
Figure 7
Downregulation of the JAK/STAT Signal pathway in mouse Tim-3+T cells (A) The volcano plot illustrated the differentially expressed genes in Tim-3+T cells compared to Tim-3-T cells, in which genes significantly upregulated were shown in red, genes that significantly downregulated were shown in yellow, and other genes were shown in blue. Each gene was symbol-coded according to its adjusted p value generated using DESeq2 with a Benjamini-Hochberg false discovery rate (FDR) correction. The cutoff values were recognized as adjusted p < 0.05 and fold change >1.5. (B) Functional annotation analysis with the top 20 enrichment Gene Ontology (GO) terms were shown. (C)Signal transduction analysis with the top 10 enrichment Kyoto Encyclopedia of Genes and Genomes (KEGG) pathway. (D) Heatmap displaying for JAK/STAT signal pathway associated genes in Tim-3+T cells compared to Tim-3-T cells.
Figure 8
Figure 8
Functional and JAK/STAT Pathway Changes in Tim-3+ T Cells under disease conditions (A) Flow cytometry plots and statistical graphs of Tim-3 expression levels on CD3+ T cells from mouse spleen cells at different stimulation time points. (n = 6, ∗∗∗∗p < 0.0001) (B) Statistical graphs of activation, proliferation, and cytokine levels of Tim-3+ T cells from mouse spleen cells at different stimulation time points. (n = 6, ∗p < 0.05, ∗∗p < 0.01, ∗∗∗p < 0.001, ∗∗∗∗p < 0.0001) (C) Statistical graphs of activation, proliferation, and cytokine levels in Tim-3+T and Tim-3-T cells in NOD mice. (n = 4, Horizontal bars represent the mean ± SD. ∗p < 0.05, ∗∗p < 0.01, ∗∗∗∗p < 0.0001 by paired Student’s t test.) (D) Quantitative real-time PCR (qPCR) analysis for JAK1, STAT1, STAT2, IFN-γ, TNF-α and GZMB expression from CD3+Tim-3+T cells in NOD mouse (n = 4) (E) Quantitative real-time PCR (qPCR) analysis for JAK1, STAT1 and STAT2 expression from CD3+Tim-3+T cells in Healthy control (n = 4), COVID-19 (n = 4), patients with T1D (n = 4), and patients with COVID-19 with T1D (n = 4). (F) Quantitative real-time PCR (qPCR) analysis for IFN-γ, TNF-α, and GZMB expression from CD3+Tim-3+T cells in Healthy control (n = 4), COVID-19 (n = 4), patients with T1D (n = 4), and patients with COVID-19 with T1D (n = 4). Horizontal bars represent the mean ± SD. ns, not significant, ∗p < 0.05, ∗∗p < 0.01, ∗∗∗p < 0.001, ∗∗∗∗p < 0.0001 by unpaired Student’s t test.

Similar articles

References

    1. Sette A., Crotty S. Adaptive immunity to SARS-CoV-2 and COVID-19. Cell. 2021;184:861–880. - PMC - PubMed
    1. Pezeshki P.S., Rezaei N. Immune checkpoint inhibition in COVID-19: risks and benefits. Expert Opin. Biol. Ther. 2021;21:1173–1179. - PMC - PubMed
    1. The Prevention of Diabetes Mellitus. JAMA. 2021;325:190. - PubMed
    1. Barnett R. Type 1 diabetes. Lancet. 2018;391:195. - PubMed
    1. Taylor R. Type 2 diabetes: etiology and reversibility. Diabetes Care. 2013;36:1047–1055. - PMC - PubMed

LinkOut - more resources