. 2025 May 4;18(5):e70101.
doi: 10.1111/eva.70101. eCollection 2025 May.

The CpG Landscape of Protein Coding DNA in Vertebrates

Affiliations

The CpG Landscape of Protein Coding DNA in Vertebrates

Justin J S Wilcox et al. Evol Appl. .

Abstract

DNA methylation has fundamental implications for vertebrate genome evolution by influencing the mutational landscape, particularly at CpG dinucleotides. Methylation-induced mutations drive a genome-wide depletion of CpG sites, creating a dinucleotide composition bias across the genome. Examination of the standard genetic code reveals CpG to be the only facultative dinucleotide; it is however unclear what specific implications CpG bias has on protein coding DNA. Here, we use theoretical considerations of the genetic code combined with empirical genome-wide analyses in six vertebrate species-human, mouse, chicken, great tit, frog, and stickleback-to investigate how CpG content is shaped and maintained in protein-coding genes. We show that protein-coding sequences consistently exhibit significantly higher CpG content than noncoding regions and demonstrate that CpG sites are enriched in genes involved in regulatory functions and stress responses, suggesting selective maintenance of CpG content in specific loci. These findings have important implications for evolutionary applications in both natural and managed populations: CpG content could serve as a genetic marker for assessing adaptive potential, while the identification of CpG-free codons provides a framework for genome optimization in breeding and synthetic biology. Our results underscore the intricate interplay between mutational biases, selection, and epigenetic regulation, offering new insights into how vertebrate genomes evolve under varying ecological and selective pressures.

Keywords: DNA methylation; base composition; dinucleotides; epigenetics; protein coding DNA.


Conflict of interest statement

The authors declare no conflicts of interest.

Figures

FIGURE 1
FIGURE 1
Evolutionary forces acting on CpG dinucleotides. (A) CpG sites in a genomic context (B–D) CpG sites in coding DNA context. C(m)‐Mutation denote a methylation dependent mutation rate. Dashed arrows denote context dependent selection (see Table 2).
FIGURE 2
FIGURE 2
CpG sites within codons. Occurrences of CpG dinucleotides within codons of the standard genetic code. All 64 codons are shown (to be read from top, Base1, to bottom, Base3). CpG sites in codons at the first or second codon position are labeled in red. CpG dinucleotides, when methylated, can be subject to spontaneous deamination, resulting in a higher mutation rate in methylated CpG sites from CpG to TpG/CpA. 3rd codon positions of alternative synonymous codons potentially subject to spontaneous deamination are colored in blue. Stop (as asterisk) and Start codons (as M) are indicated in the row “Starts”. AAs, amino acids.
FIGURE 3
FIGURE 3
CpG sites across codons. All 64 codons are displayed, with Base1 at the top and Base3 at the bottom. CpG dinucleotides can form across codons when a codon ends with a C and the next codon starts with a G. Codon positions that may contribute to CpG sites at the first or third positions are marked in red. Methylated CpG dinucleotides are prone to spontaneous deamination, leading to an increased mutation rate (CpG → TpG/CpA). The third codon positions of synonymous codons, where such deamination may occur without altering the encoded amino acid, are highlighted in blue. Stop codons (indicated by an asterisk) and Start codons (indicated by M) are shown in the row labeled “Starts.” AAs, amino acids.
FIGURE 4
FIGURE 4
CpG content in different vertebrate species summed across the genome. CpG content is measured as the fraction of CpG sites in GpC and CpG dinucleotides. Shown are protein coding DNA (Coding DNA, blue) and the entire genomes (Genomic DNA, orange). Statistical differences were assessed with a Mann–Whitney‐U test, ****p ≤ 10−4.
FIGURE 5
FIGURE 5
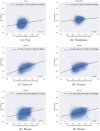
Correlation of CpG content with GC content in protein‐coding genes for six species (A–F). For all cases there is a positive correlation between CpG content and GC content. Note that genes smaller than 150 nucleotides and larger 2000 nucleotides were excluded from the analysis. The correlation coefficient τ is given as well as the parameters of the linear regression line and its associated p value. N denotes the number of genes in the analysis.
FIGURE 6
FIGURE 6
Coding CpG contents at the start and end of the coding DNA in different vertebrate species. CpG content is measured as the fraction of CpG sites in GpC and CpG dinucleotides. The first 99 coding basepairs (N‐terminal end) and the last 99 coding basepairs (C‐terminal end) of each gene were used. Statistical differences were assessed with a paired Wilcoxon rank test, ****p ≤ 10−4.
FIGURE 7
FIGURE 7
Functional association of genes with high and low CpG content in six vertebrate species. The 100 most and least CpG rich genes across six vertebrate species were combined and analysed for gene ontology overrepresentation. (A) Upset plot of unique and shared genes of the 100 highest CpG dinucleotides in each species. (B) Enrichment categories for the high CpG rich genes with FDR < 0.05 visualised through the WebGestalt server. (C) Upset plot of unique and shared genes of the 100 lowest CpG dinucleotides in each species. (D) KEGG Pathway Enrichment categories with FDR values < 0.05 for the low CpG rich genes visualised through the WebGestalt server.
FIGURE 8
FIGURE 8
Permutation test of genomic regions overlap between gene bodies and chromatin state in humans. Chromatin state was obtained from kidney epithelial cells deposited in the ENCODE database (ENCFF343KUN). Other tissues were very similar (results not shown). (A) The 100 most CpG‐rich genes show a significant enrichment in regions with functional chromatin states. (B) The 100 CpG‐poorest genes show no significant overlap with functional chromatin state.

Similar articles

References

    1. Anastasiadi, D. , Esteve‐Codina A., and Piferrer F.. 2018. “Consistent Inverse Correlation Between DNA Methylation of the First Intron and Gene Expression Across Tissues and Species.” Epigenetics & Chromatin 11, no. 1: 37. 10.1186/s13072-018-0205-1. - DOI - PMC - PubMed
    1. Angeloni, A. , and Bogdanovic O.. 2021. “Sequence Determinants, Function, and Evolution of CpG Islands.” Biochemical Society Transactions 49: 1109–1119. 10.1042/bst20200695. - DOI - PMC - PubMed
    1. Barik, S. 2017. “Amino Acid Repeats Avert mRNA Folding Through Conservative Substitutions and Synonymous Codons, Regardless of Codon Bias.” Heliyon 3: e00492. 10.1016/j.heliyon.2017.e00492. - DOI - PMC - PubMed
    1. Bernardi, G. , Mouchiroud D., Gautier C., and Bernardi G.. 1988. “Compositional Patterns in Vertebrate Genomes: Conservation and Change in Evolution.” Journal of Molecular Evolution 28: 7–18. 10.1007/bf02143493. - DOI - PubMed
    1. Bestor, T. H. 2000. “The DNA Methyltransferases of Mammals.” Human Molecular Genetics 9: 2395–2402. 10.1093/hmg/9.16.2395. - DOI - PubMed

LinkOut - more resources