. 2025 Apr 18:43:100725.
doi: 10.1016/j.pacs.2025.100725. eCollection 2025 Jun.

Wavelength-time-division multiplexed fiber-optic sensor array for wide-field photoacoustic microscopy

Affiliations

Wavelength-time-division multiplexed fiber-optic sensor array for wide-field photoacoustic microscopy

Wei Li et al. Photoacoustics. .

Abstract

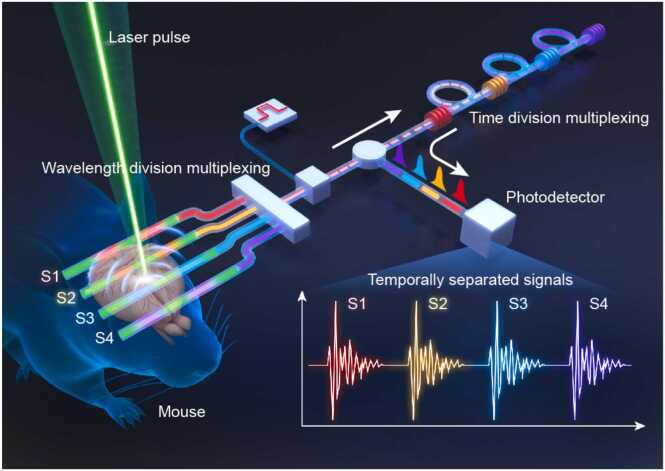
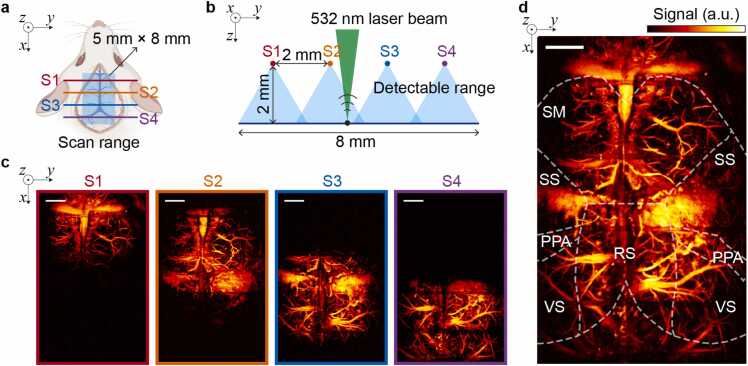
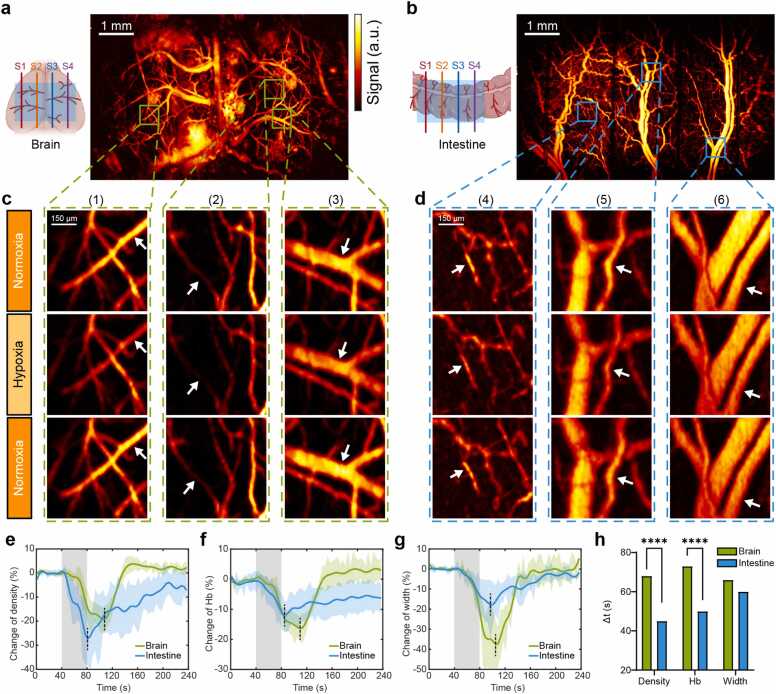
Photoacoustic microscopy (PAM) faces a fundamental trade-off between detection sensitivity and field of view (FOV). While optical ultrasound sensors offer high-sensitivity unfocused detection, implementing multichannel detection remains challenging. Here, we present a wavelength-time-division multiplexed (WTDM) fiber-optic sensor array that assigns distinct wavelengths to individual sensors and employs varying-length delay fibers for temporal separation, enabling efficient multichannel detection through a single photodetector. Using a 4-element sensor array, we achieved an expanded FOV of 5 × 8 mm² while maintaining high temporal resolution (160 kHz A-line rate, 0.25 Hz frame rate) and microscopic spatial resolution (10.7 μm). The system's capabilities were validated through comparative monitoring of cerebral and intestinal hemodynamics in mice during hypercapnia challenge, revealing distinct temporal patterns with notably delayed recovery in cerebral vascular response compared to intestinal vasculature. This WTDM approach establishes a promising platform for large-field, high-speed photoacoustic imaging in biomedical applications.

Keywords: Fiber-optic sensors; Hemodynamic monitoring; Photoacoustic microscopy; Wavelength-time-division multiplexing; Wide-field imaging.


Conflict of interest statement

The authors declare that they have no known competing financial interests or personal relationships that could have appeared to influence the work reported in this paper.

Figures

Fig. 1
Fig. 1
Schematic illustration of the wavelength-time-division multiplexed fiber laser ultrasound sensor array for wide-field photoacoustic microscopy.
Fig. 2
Fig. 2
Working principle and comprehensive characterization of an optical ultrasound sensor. (a) Schematic diagram illustrating the dual-polarization fiber laser sensor design, showing ultrasound-induced torsional-radial vibration and the corresponding p- and s-polarization components. (c) Frequency-dependent sensitivity spectrum. (d) Noise equivalent pressure density (NEPD) spectrum. (d) Experimental setup for spatial sensitivity characterization. (e) Spatial sensitivity distribution analysis. Top and left panels: normalized one-dimensional sensitivity profiles along x- and y-axes. Center panel: two-dimensional sensitivity map with normalized amplitude represented in pseudo-color scale.
Fig. 3
Fig. 3
Implementation of the multiplexed sensor array. (a) Schematic diagram of the multichannel ultrasound detection system. Key components include DWDM: dense wavelength division multiplexer; EDFA: Erbium-doped fiber amplifier; OSA: optical spectrum analyzer; ESA: electrical spectrum analyzer; AOM: acousto-optic modulator; PD: photodetector; RF: radio frequency; DAQ: data acquisition card; M1–4: mirror composed of Bragg grating. (b) Optical spectra of the four sensing channels showing distinct wavelength separation. (c) Radio frequency spectra demonstrating the carrier frequencies of individual sensors. (d) Time-sequenced waveforms of the downconverted signals acquired through temporal gating. (e) Demodulated ultrasonic signals from the four sensors showing their respective temporal positions and frequency characteristics. (f–i) The result of simultaneous detection of the same ultrasonic signal by four sensors.
Fig. 4
Fig. 4
Multi-sensor array implementation for extended field-of-view photoacoustic microscopy (PAM). (a) Schematic illustration of the quadruple fiber-optic sensor array (S1–S4) configuration, covering a 5 mm × 8 mm scanning area. (b) Cross-sectional view of the in vivo imaging architecture demonstrating the optimized 2-mm inter-sensor spacing design for comprehensive cortical vasculature mapping. The 532-nm laser beam excitation and sensor detectable ranges are indicated. (c) Individual maximum amplitude projection images acquired from sensors S1–S4, demonstrating complementary spatial coverage and signal detection capabilities. (d) Integrated wide-field reconstruction through multi-sensor data fusion. Annotated anatomical regions include the somatomotor (SM), somatosensory (SS), retrosplenial (RS), visual (VS), and posterior parietal association (PPA) areas. The dashed lines delineate major functional boundaries. Scale bar: 1 mm.
Fig. 5
Fig. 5
Comparative analysis of cerebral and intestinal hemodynamic responses to acute hypercapnia (50 % CO2 exposure) using wide-field photoacoustic microscopy. (a,b) Maximum amplitude projection images revealing vascular networks in the brain cortex (a) and intestinal tissue (b), with sensor array (S1–S4) coverage indicated in the anatomical diagrams. (c,d) Dynamic vascular responses in representative regions of interest (ROIs): magnified views from brain cortex (regions 1–3, c) and intestine (regions 4–6, d) captured during normoxia (baseline, 36 s), hypercapnia (108 s), and recovery phase (204 s). White arrows indicate vessels selected for quantitative analysis. (e-g) Temporal evolution of key vascular parameters demonstrating distinct response patterns between cortical and intestinal vasculature: vessel density (e), total hemoglobin concentration (f), and vessel diameter (g). (h) Comparative analysis of maximum response time (Δt) in vascular parameters between brain and intestinal tissue. Gray-shaded areas in e-g indicate CO2 exposure period (t = 40–80 s). n = 4. Data represent mean ± SD (e-g) and mean values (h). Statistical significance determined by two-way ANOVA (**** P < 0.0001).

Similar articles

References

    1. Zhu X., Menozzi L., Cho S.-W., Yao J. High speed innovations in photoacoustic microscopy. npj Imaging. 2024;2(1):46. - PMC - PubMed
    1. Yao J., Wang L., Yang J.-M., Maslov K.I., Wong T.T.W., Li L., Huang C.-H., Zou J., Wang L.V. High-speed label-free functional photoacoustic microscopy of mouse brain in action. Nat. Methods. 2015;12(5):407–410. - PMC - PubMed
    1. Wang L., Maslov K., Yao J., Rao B., Wang L.V. Fast voice-coil scanning optical-resolution photoacoustic microscopy. Opt. Lett. 2011;36(2):139–141. - PMC - PubMed
    1. Kim J., Kim J.Y., Jeon S., Baik J.W., Cho S.H., Kim C. Super-resolution localization photoacoustic microscopy using intrinsic red blood cells as contrast absorbers. Light.: Sci. Appl. 2019;8(1):103. - PMC - PubMed
    1. Kim J.Y., Lee C., Park K., Han S., Kim C. High-speed and high-SNR photoacoustic microscopy based on a galvanometer mirror in non-conducting liquid. Sci. Rep. 2016;6(1) - PMC - PubMed

LinkOut - more resources