. 2025 Apr 22:16:1554260.
doi: 10.3389/fphar.2025.1554260. eCollection 2025.

Sodium aescinate promotes apoptosis of pancreatic stellate cells and alleviates pancreatic fibrosis by inhibiting the PI3K/Akt/FOXO1 signaling pathways

Affiliations

Sodium aescinate promotes apoptosis of pancreatic stellate cells and alleviates pancreatic fibrosis by inhibiting the PI3K/Akt/FOXO1 signaling pathways

Qing-Yun Wang et al. Front Pharmacol. .

Abstract

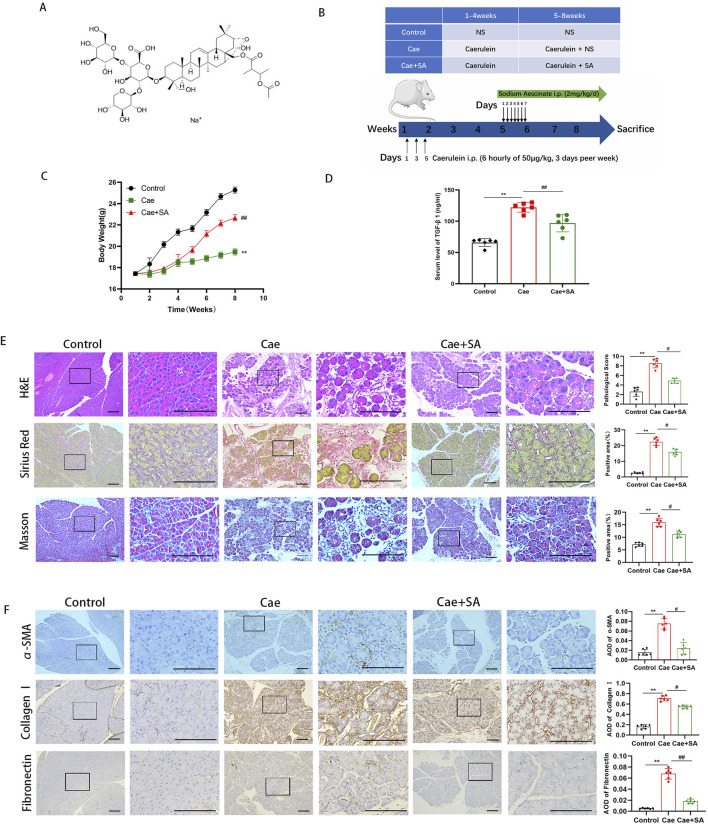
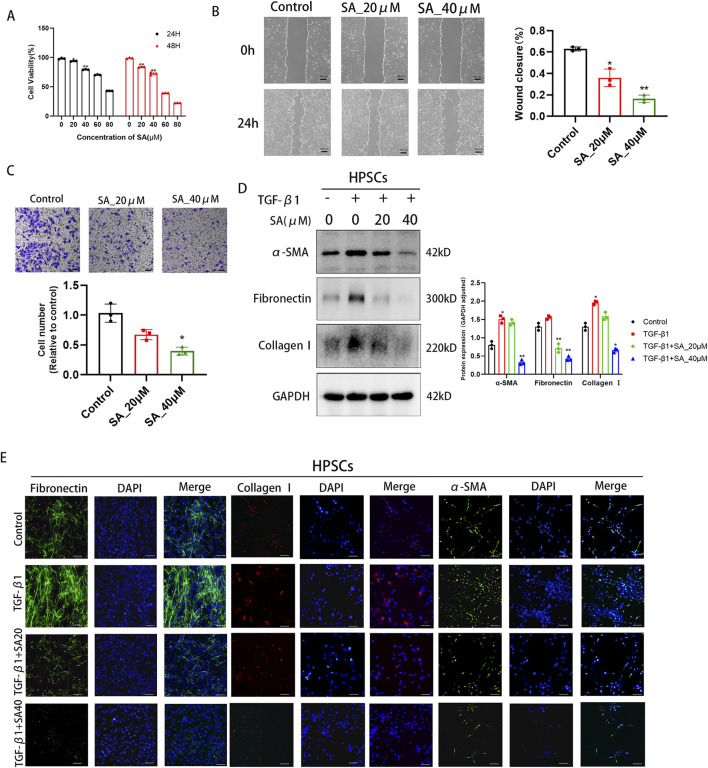
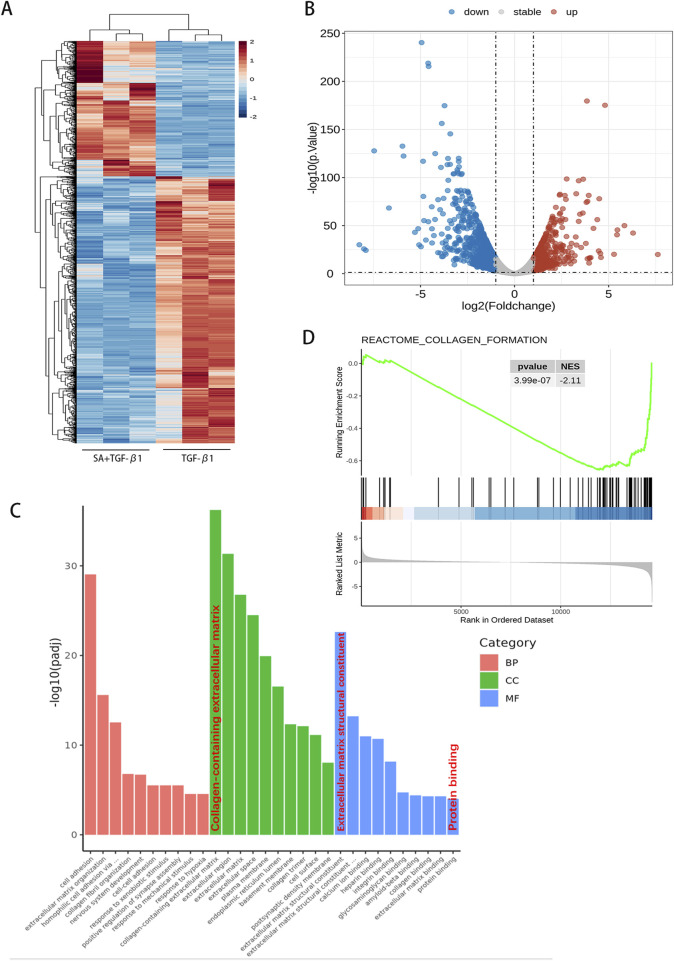
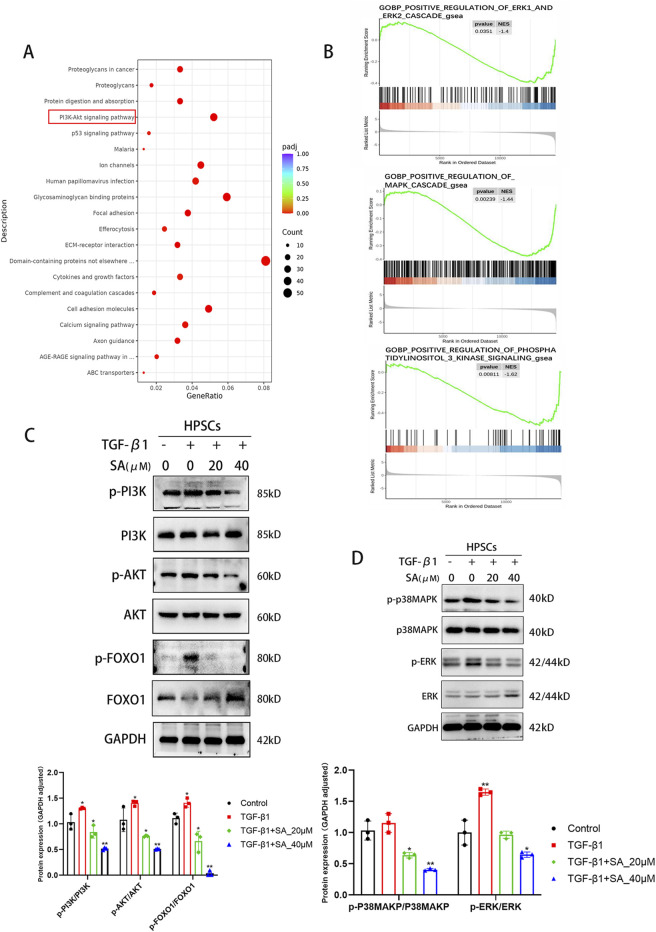
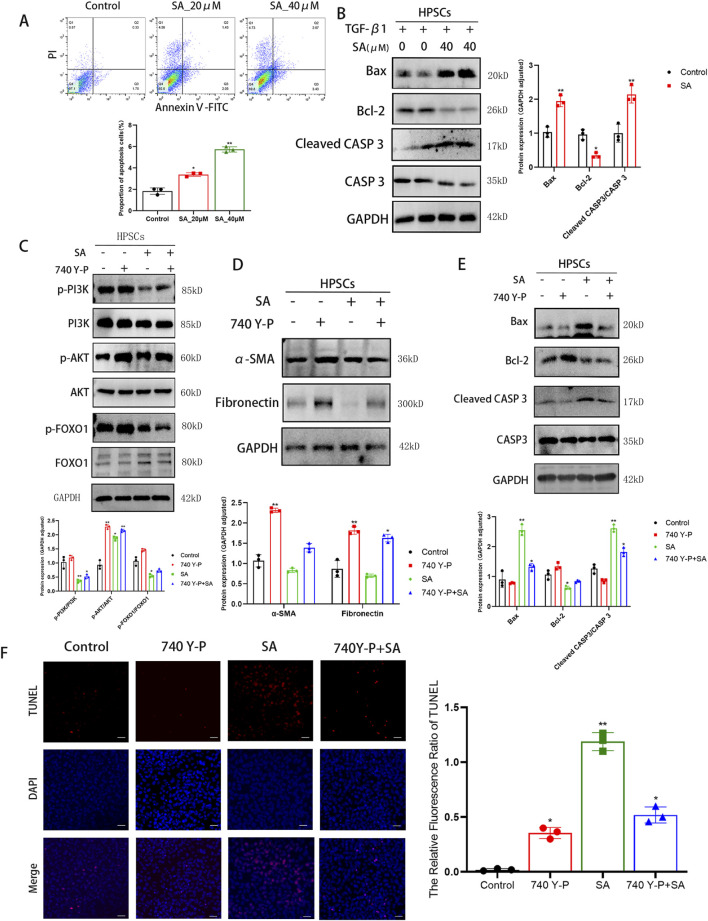
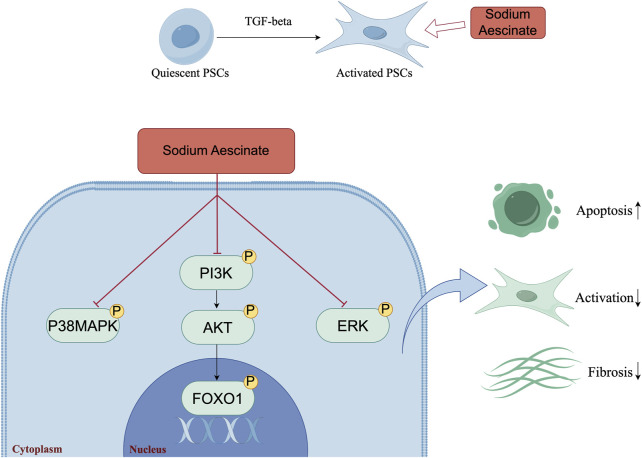
Chronic pancreatitis (CP) is an inflammatory disease of progressive pancreatic fibrosis, and pancreatic stellate cells (PSCs) are key cells involved in pancreatic fibrosis. To date, there are no clinical therapies available to reverse inflammatory damage or pancreatic fibrosis associated with CP. Sodium Aescinate (SA) is a natural mixture of triterpene saponins extracted from the dried and ripe fruits of horse chestnut tree. It has been shown to have anti-inflammatory and anti-edematous effects. This study aims to explore the therapeutic potential of SA in CP and the molecular mechanism of its modulation. Through in vivo animal models and experiments, we found that SA significantly alleviated pancreatic inflammation and fibrosis in caerulein-induced CP mice model. In addition, SA inhibited the proliferation, migration and activation of PSCs as well as promoted apoptosis of PSCs through a series of experiments on cells in vitro including CCK-8 assay, Western blotting, immunofluorescence staining, wound-healing assay, Transwell migration assays, flow cytometric analysis, etc. Further RNA sequencing and in vitro validation assays revealed that inhibition of the PI3K/AKT/FOXO1 signaling pathway was involved in the SA mediated promotion of PSCs apoptosis, thus alleviating pancreatic fibrosis. In conclusion, this study revealed that SA may have promising potential as therapeutic agent for the treatment of CP, and the PI3K/AKT/FOXO1 pathway is a potential therapeutic target for pancreatic inflammation and fibrosis.

Keywords: PI3K/AKT/FOXO1 signaling pathway; apoptosis; chronic pancreatitis (CP); pancreatic fibrosis; pancreatic stellate cells (PSCs); sodium aescinate (SA).


Conflict of interest statement

The authors declare that the research was conducted in the absence of any commercial or financial relationships that could be construed as a potential conflict of interest.

Figures

FIGURE 1
FIGURE 1
SA in vivo alleviated caerulein-induced pancreatic inflammation and fibrosis. (A) Schematic diagram of the molecular structure of SA. (B) Flowchart of experimental design for cerulein-induced pancreatitis mouse model construction and SA intervention. (C) Body weight changes in control group (Control), cerulein-induced model group (Cae), and SA-treated group (Cae + SA) during the experiment (n = 6/group; presented as mean ± SD; ** P < 0.01 vs Control group; ## P < 0.01 vs Cae group). (D) Serum TGF-β1 levels detected by ELISA (n = 6/group, three independent experiments; presented as mean ± SD; ** P < 0.01 vs Control group; ## P < 0.01 vs Cae group; analyzed by Kruskal–Wallis test and Dunn’s correction). (E) Representative images of pancreatic tissue sections stained with H&E, Masson, and Sirius red (scale bar = 100 μm). Right panels show quantitative results of histopathological scores and positive staining area (n = 6; presented as mean ± SD; ** P < 0.01 vs Control group; # P < 0.05 vs Cae group; analyzed by Kruskal–Wallis test and Dunn’s correction). (F) Immunohistochemical staining of α-smooth muscle actin (α-SMA), fibronectin, and collagen I (scale bar = 100 μm). Bar graphs show mean optical density values (n = 6; presented as mean ± SD; ** P < 0.01 vs Control group; ## P < 0.01, # P < 0.05 vs Cae group; analyzed by Kruskal–Wallis test and Dunn’s correction).
FIGURE 2
FIGURE 2
SA inhibited the proliferation, migration and activation of PSCs. (A) The effects of different concentrations of SA (0, 20, 40, 60, 80 μM) on PSC viability after 24/48 h treatment were detected by CCK-8 assay (* P < 0.05, ** P < 0.01 compared to 0 μM group, presented as mean ± SD, n = 3/group, three independent experiments). (B) Scratch assay evaluated PSC migration ability after 24 h SA treatment (0, 20, 40 μM). Scratch areas were quantified using ImageJ (n = 3 fields/group, three independent experiments, presented as mean ± SD; * P < 0.05, ** P < 0.01 compared to control group). (C) Transwell assay detected the number of migrated PSCs after 24 h SA treatment (0, 20, 40 μM) (* P < 0.05 compared to control group, three independent experiments, presented as mean ± SD). (D) Western blot analysis of α-SMA, Collagen I, and Fibronectin expression in PSCs treated with different SA concentrations for 24 h before and after TGF-β1 activation (GAPDH as loading control, n = 3, * P < 0.05, ** P < 0.01 compared to control group by Paired t-test, presented as mean ± SD). (E) Immunofluorescence staining showing the effects of SA intervention on Fibronectin (green), Collagen I (red), and α-SMA (green) expression in TGF-β1-activated PSCs. Nuclei were stained with DAPI (blue, scale bar = 100 μm).
FIGURE 3
FIGURE 3
RNA sequencing analysis of PSCs treated with SA. Using the screening criteria (P < 0.05 and fold change >2 or <0.5), a total of 1,610 differentially expressed genes (DEGs) were identified. (A) A hierarchical clustering heatmap and (B) volcano plot illustrate the gene expression profiles. (C) Gene Ontology (GO) functional enrichment analysis based on hypergeometric distribution and (D) Gene Set Enrichment Analysis (GSEA, analyzed using R software, n = 3).
FIGURE 4
FIGURE 4
SA inhibited the activation and proliferation of PSCs through the PI3K/AKT Signaling Pathway and MAPK Signaling Pathway. (A) KEGG pathway enrichment and (B) GO functional enrichment analyses revealed key signaling pathways associated with DEGs. (C) Western blot analysis of total and phosphorylated protein levels of PI3K, AKT, and FOXO1 in PSCs treated with SA before and after TGF-β1 activation (n = 3, * P < 0.05, ** P < 0.01 compared to control group by Paired t-test, presented as mean ± SD). (D) Changes in MAPK pathway protein expression (ERK1/2, p38-MAPK) following SA intervention, quantified by bar graphs (n = 3, presented as mean ± SD; * P < 0.05, ** P < 0.01 compared to control group by Paired t-test).
FIGURE 5
FIGURE 5
SA promoted the apoptosis of PSCs via inhibiting PI3K/AKT/FOXO1 signaling pathway. (A) Apoptosis rates (early + late apoptosis) of PSCs treated with SA for 48 h were measured by Annexin V/PI double staining flow cytometry (n = 3, * P < 0.05, ** P < 0.01 vs control group. presented as mean ± SD). (B) Western blot analysis of apoptosis-related protein expression in PSCs treated with TGF-β1 combined with SA for 24 h (GAPDH as loading control, n = 3, * P < 0.05,** P < 0.01 compared to control group by Paired t-test, presented as mean ± SD). (C) Validation of total and phosphorylated protein levels of PI3K, AKT, and FOXO1 under different treatment conditions (n = 3, * P < 0.05, ** P < 0.01 compared to control group by Paired t-test, presented as mean ± SD). (D, E) Expression levels of α-SMA, Fibronectin (D) and apoptosis-related proteins (E) across experimental groups (n = 3, * P < 0.05, ** P < 0.01 compared to control group by Paired t-test, presented as mean ± SD). (F) TUNEL fluorescence staining showing cellular apoptosis (scale bar = 100 μm, n = 3, * P < 0.05, ** P < 0.01 vs. control; presented as mean ± SD).
FIGURE 6
FIGURE 6
The Mechanism Diagram of the Article (by Figdraw). The schematic model illustrated the underlying mechanism by which SA induced the apoptosis of PSCs, inhibited the activation of PSCs and panreatic fibrosis. The figure visually showed the key molecular events and pathways involved in SA-induced apoptosis.

Similar articles

References

    1. Apte M., Pirola R., Wilson J. (2011). The fibrosis of chronic pancreatitis: new insights into the role of pancreatic stellate cells. Antioxid. Redox Signal 15 (10), 2711–2722. 10.1089/ars.2011.4079 - DOI - PubMed
    1. Auwercx J., Fourgeaud M., Lalot A., Gautier M. (2025). Unraveling the connection between ion channels and pancreatic stellate cell activation. Cell. Physiol. Biochem. 59 (S1), 25–40. 10.33594/000000754 - DOI - PubMed
    1. Bai Y., Qin X., Ao X., Ran T., Zhou C., Zou D. (2024). The role of EUS in the diagnosis of early chronic pancreatitis. Endosc. Ultrasound 13 (4), 232–238. 10.1097/eus.0000000000000077 - DOI - PMC - PubMed
    1. Bertheloot D., Latz E., Franklin B. S. (2021). Necroptosis, pyroptosis and apoptosis: an intricate game of cell death. Cell. Mol. Immunol. 18 (5), 1106–1121. 10.1038/s41423-020-00630-3 - DOI - PMC - PubMed
    1. Beyer G., Habtezion A., Werner J., Lerch M. M., Mayerle J. (2020). Chronic pancreatitis. Lancet. 396 (10249), 499–512. 10.1016/S0140-6736(20)31318-0 - DOI - PubMed

LinkOut - more resources