

Image segmentation of treated and untreated tumor spheroids by fully convolutional networks
- PMID: 40331344
- PMCID: PMC12056507
- DOI: 10.1093/gigascience/giaf027
Image segmentation of treated and untreated tumor spheroids by fully convolutional networks
Abstract
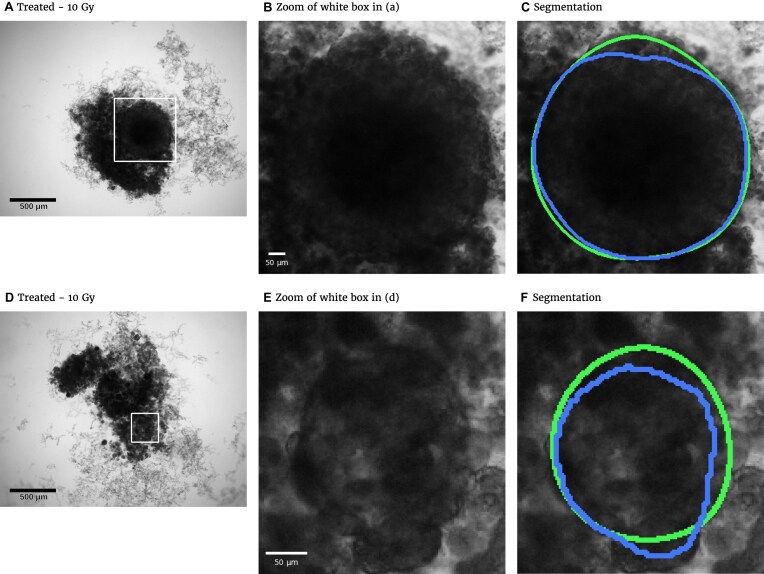
Background: Multicellular tumor spheroids (MCTS) are advanced cell culture systems for assessing the impact of combinatorial radio(chemo)therapy as they exhibit therapeutically relevant in vivo-like characteristics from 3-dimensional cell-cell and cell-matrix interactions to radial pathophysiological gradients. State-of-the-art assays quantify long-term curative endpoints based on collected brightfield image time series from large treated spheroid populations per irradiation dose and treatment arm. This analyses require laborious spheroid segmentation of up to 100,000 images per treatment arm to extract relevant structural information from the images (e.g., diameter, area, volume, and circularity). While several image analysis algorithms are available for spheroid segmentation, they all focus on compact MCTS with a clearly distinguishable outer rim throughout growth. However, they often fail for the common case of treated MCTS, which may partly be detached and destroyed and are usually obscured by dead cell debris.
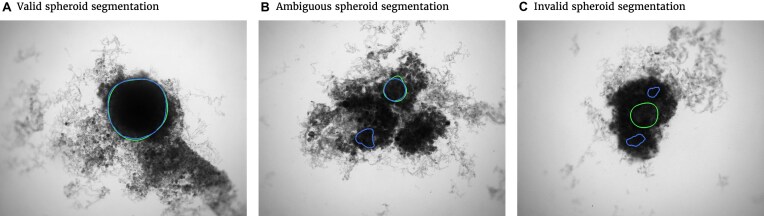
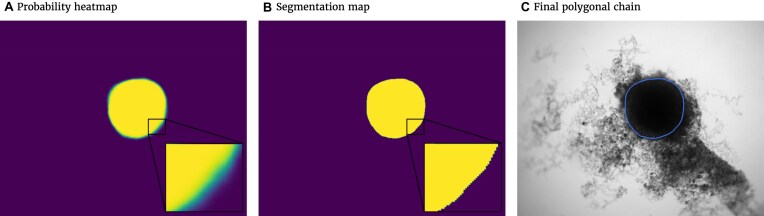
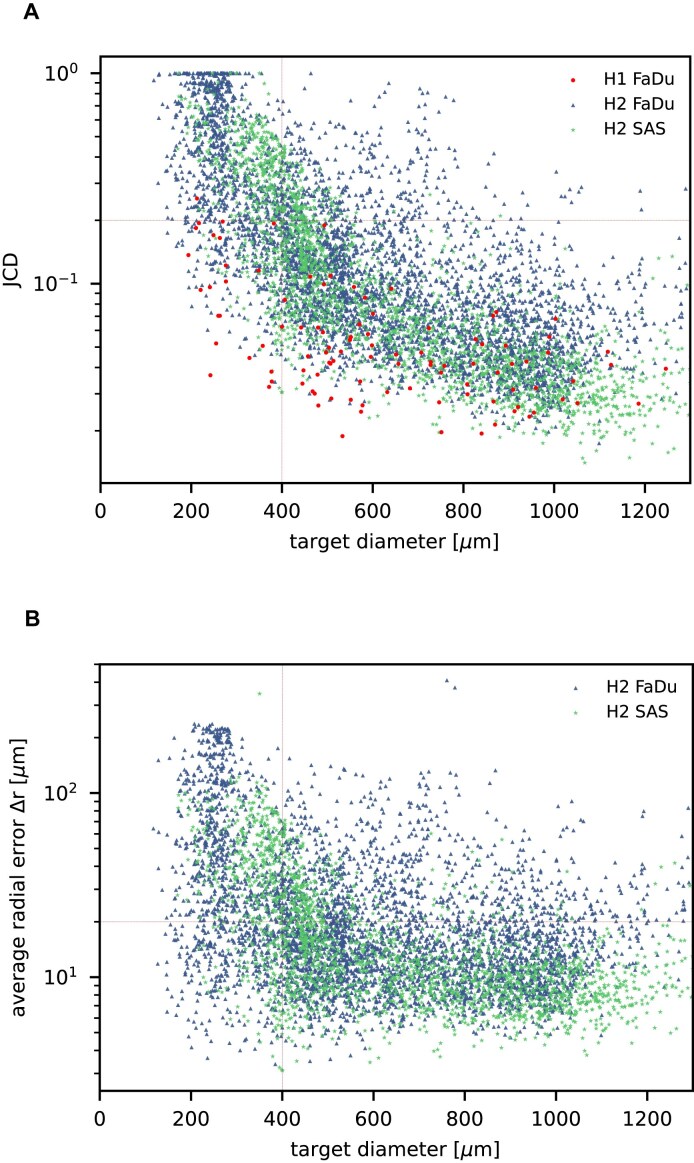
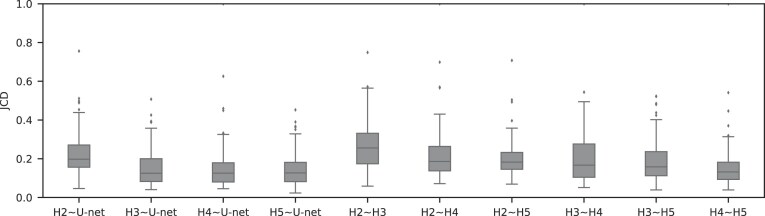
Results: To address these issues, we successfully train 2 fully convolutional networks, UNet and HRNet, and optimize their hyperparameters to develop an automatic segmentation for both untreated and treated MCTS. We extensively test the automatic segmentation on larger, independent datasets and observe high accuracy for most images with Jaccard indices around 90%. For cases with lower accuracy, we demonstrate that the deviation is comparable to the interobserver variability. We also test against previously published datasets and spheroid segmentations.
Conclusions: The developed automatic segmentation can not only be used directly but also integrated into existing spheroid analysis pipelines and tools. This facilitates the analysis of 3-dimensional spheroid assay experiments and contributes to the reproducibility and standardization of this preclinical in vitro model.
Keywords: 3D cancer models; brightfield microscopy; cancer therapy; deep learning; fully convolutional networks; high-content screening; interobserver variability; organoids; segmentation; spheroids.
© The Author(s) 2025. Published by Oxford University Press GigaScience.
Conflict of interest statement
The authors declare that they have no competing interests.
Figures
Similar articles
-
SpheroScan: a user-friendly deep learning tool for spheroid image analysis.Gigascience. 2022 Dec 28;12:giad082. doi: 10.1093/gigascience/giad082. Epub 2023 Oct 27. Gigascience. 2022. PMID: 37889008 Free PMC article.
-
AnaSP: a software suite for automatic image analysis of multicellular spheroids.Comput Methods Programs Biomed. 2015 Apr;119(1):43-52. doi: 10.1016/j.cmpb.2015.02.006. Epub 2015 Feb 24. Comput Methods Programs Biomed. 2015. PMID: 25737369
-
[Fully Automatic Glioma Segmentation Algorithm of Magnetic Resonance Imaging Based on 3D-UNet With More Global Contextual Feature Extraction: An Improvement on Insufficient Extraction of Global Features].Sichuan Da Xue Xue Bao Yi Xue Ban. 2024 Mar 20;55(2):447-454. doi: 10.12182/20240360208. Sichuan Da Xue Xue Bao Yi Xue Ban. 2024. PMID: 38645864 Free PMC article. Chinese.
-
Experimental anti-tumor therapy in 3-D: spheroids--old hat or new challenge?Int J Radiat Biol. 2007 Nov-Dec;83(11-12):849-71. doi: 10.1080/09553000701727531. Int J Radiat Biol. 2007. PMID: 18058370 Review.
-
Recent Advances in Multicellular Tumor Spheroid Generation for Drug Screening.Biosensors (Basel). 2021 Nov 11;11(11):445. doi: 10.3390/bios11110445. Biosensors (Basel). 2021. PMID: 34821661 Free PMC article. Review.
References
-
- Leek R, Grimes DR, Harris AL, et al. Methods: using three-dimensional culture (spheroids) as an in vitro model of tumour hypoxia. In: Koumenis C, Coussens LM, Giaccia A, et al., eds. Tumor Microenvironment Advances in Experimental Medicine and Biology. Cham: Springer International Publishing; 2016:167–96. 10.1007/978-3-319-26666-4_10. - DOI - PubMed
MeSH terms
Grants and funding
LinkOut - more resources
Full Text Sources
Medical
