Review
. 2025 Jul;21(26):e2412271.
doi: 10.1002/smll.202412271. Epub 2025 May 7.

Design Principles of Nanosensors for Multiplex Detection of Contaminants in Food

Affiliations
Review

Design Principles of Nanosensors for Multiplex Detection of Contaminants in Food

Yang Zhang et al. Small. 2025 Jul.

Abstract

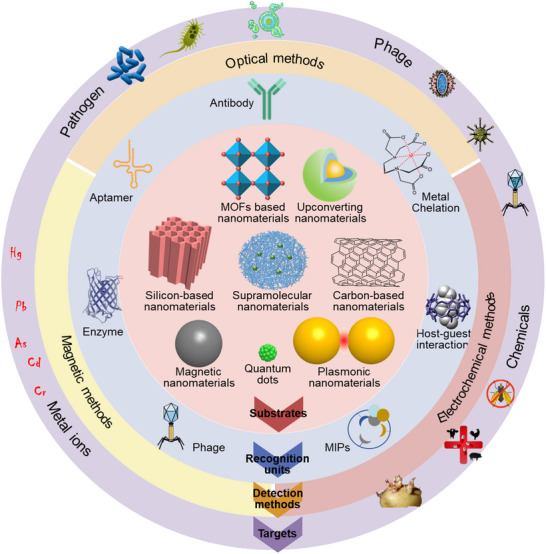
The rapid and cost-effective detection of food contaminants such as toxins and pathogens is a major challenge and a key concern for food safety. To this end, innovative, fast, cost-effective, and easy-to-use sensors must be developed at the point where food is produced, distributed, and consumed. Therefore, timely detection and response to food contaminants can improve human health and reduce economic burden. However, affordable sensor technologies with specificity, sensitivity, and speed are required, which can be used by non-specialized personnel and enable high throughput analysis. In this respect, advances in the development of nanoparticle-based sensors, i.e., nanosensors, have shown the potential to provide the much-anticipated versatile sensors. In addition, multiplex detection, i.e., the ability to detect multiple targets simultaneously, is another strategy facilitated by nanoparticle-based sensors and will enable further improvements in sensor performance that are important for developing effective monitoring. This review summarizes the nanosensors for multiplex sensing of food samples with respect to hazardous contaminates reported over the past few years. In addition, special attention is paid to providing the reader with promising design principles and the current performance of the sensitivity and selectivity of such sensors for practical requirements, thereby inspiring new ideas for developing further advanced systems.

Keywords: food safety; multiplex; multiplex detection; nanosensors; nanotechnology.


Conflict of interest statement

The authors declare no conflict of interest.

Figures

Figure 1
Figure 1
The general compositions of nanosensors, including nano substrates, binding elements, and the detection mechanisms (producing detectable signals) for contaminants in food.
Figure 2
Figure 2
Two types of recognition elements with different specificity.
Figure 3
Figure 3
Strategies for achieving multiplex detection by concentrating multiple single detection reactions. Detailed approaches include: a) increasing the number of detection sites, b) combining sensor units within a single detection process, and c) designing multifunctional nanosensors. Reproduced with permission.[ 315 ] Copyright 2019, American Chemistry Society. Reproduced with permission.[ 414 ] Copyright 2024, American Chemistry Society. Reproduced with permission.[ 415 ] Copyright 2023, American Chemistry Society.
Figure 4
Figure 4
Optical encoding based on particles for multiplex detection. a) SERS encoding is based on gold nanoparticles by changing the Raman molecules. Reproduced with permission.[ 270 ] Copyright 2002, Science (AAAS). b) Fluorescent encoding based on QDs with different wavelengths and intensity. Reproduced with permission.[ 395 ] Copyright 2001, Springer Nature. c) Photonic crystal (PhC) barcodes with different reflection intensities and scale bars of 100 µm.[ 134 ] Copyright 2020, American Chemistry Society. d) Graphical encoding with particles with tunable structural colors. Reproduced with permission.[ 121 ] Copyright 2010, Springer Nature. e) Fluorescence lifetime encoding based on nanogels through emulsion polymerization. Reproduced with permission.[ 421 ] Copyright 2020, Springer Nature.
Figure 5
Figure 5
Representative examples of multiplex detection based on logic gates. a) molecular structures of “AND” and “XOR” logic gates for Ca2+ and H+ sensing. Reproduced with permission.[ 446 ] Copyright 2000, American Chemical Society. b) “AND” logic gate with Hg2+ and H+ ions as inputs based on 3D DNA tetrahedra. Reproduced with permission.[ 454 ] Copyright 2012, John Wiley and Sons. c) “OR” logic gate system activated by Mg2+ and Pb2+ using gold nanoparticles and DNA composite. Reproduced with permission.[ 455 ] Copyright 2010, John Wiley and Sons.
Figure 6
Figure 6
a) Illustration of a traditional nanosensor with high specificity to an analyte, producing a single response. b) Sensor array comprising a set of cross‐reactive sensor units, generating multiple responses for each analyte and providing fingerprint‐pattern recognition. Representative examples of multiplex detection based on sensor arrays. c) A colorimetric sensor array for odor visualization utilizing metalloporphyrins as sensor units, with TPP representing 5,10,15,20‐tetraphenylporphyrinate(‐2). Reproduced with permission.[ 42 ] Copyright 2000, Springer Nature. d) Identification of antibiotic resistance in ESKAPE pathogens using a sensor array composed of plasmonic nanosensors, facilitated by machine learning. Reproduced with permission.[ 138 ] Copyright 2023, American Chemical Society. ESKAPE is an acronym for six pathogens: Enterococcus faecium, Staphylococcus aureus, Klebsiella pneumoniae, Acinetobacter baumannii, Pseudomonas aeruginosa, and Enterobacter spp.
Figure 7
Figure 7
Nanosensors with Multiple Functions for Detecting Metal Ions. a) Paper@MnZnS sensor demonstrating different responses to Cd2⁺, Hg2⁺, and Pb2⁺, utilized for multiplex detection. Reproduced with permission.[ 510 ] Copyright 2022, Elsevier. b) Schematic illustration of simultaneous detection of Cd2⁺ and Pb2⁺ by bifunctional MOF materials based on ion‐exchange reaction with differential pulse voltammetry. Reproduced with permission.[ 327 ] Copyright 2020, American Chemical Society. The nanosensor for multiplex detection was fabricated using nano‐barcode materials. c) Microarray chip fabricated on filter paper using three fluorescent carbon nanodots for detecting Pb2⁺, Hg2⁺, and Cu2⁺, employing a fluorescence “on‐off” model based on the mechanism of non‐radiative electron/hole recombination. Reproduced with permission.[ 516 ] Copyright 2020, American Chemical Society.
Figure 8
Figure 8
Illustration of Sensor Array with Cross‐Reactivity for Detecting Multiple Ions and Identification by ML Methods. a) Principle of identifying multiple metal ions using DNA‐Au encoders, with A5‐AuNP being one of six types of encoders, analyzed through three output signals: ultraviolet absorption spectrum, dynamic light scattering, and ζ‐potential. Reproduced with permission.[ 524 ] Copyright 2021, American Chemical Society. b) Sensor responses for different DNA‐SWCNTs to cations under two reaction pH values, allowing discrimination of Hg2⁺, Cr2⁺, Mn2⁺, and Pb2⁺ through PCA analysis. Reproduced with permission.[ 525 ] Copyright 2022, American Chemical Society. c) Schematic illustration of fluorophore/surfactant assemblies‐based cross‐reactive sensor. The four signal recognition patterns for 13 metal ions (at a concentration of 10 µM) were analyzed and discriminated using PCA. Reproduced with permission.[ 527 ] Copyright 2017, American Chemical Society.
Figure 9
Figure 9
Representative examples of multiplex detection of chemicals using a single nanosensor. a) Illustration of multipesticide residue detection (monocrotophos, methamidophos, and carbaryl) based on the inhibition of acetylcholinesterase activity, utilizing an electrochemical method. Reproduced with permission.[ 536 ] Copyright 2023, American Chemical Society. b) Detection principle for small molecules using Ni‐HHTP as the sensing unit, which exhibits two capacitance peaks: (1) structure of Ni‐HHTP, (2‐3) capacitance of Ni‐HHTP, and Ni‐HHTP in the presence of ascorbic acid (Asc) and acetic acid (Ace). c) Relative capacitance response in the presence of different analytes, including ascorbic acid (Asc), acetic acid (Ace), formic acid (FA), ethylamine (EA), perfluoropropionic acid (PFP), melatonin (MT), dopamine (DA), and cysteine (Cys). Reproduced with permission.[ 538 ] Copyright 2023, American Chemical Society.
Figure 10
Figure 10
Illustration of detecting multiple chemicals using sensor arrays. a) Principles of nanoenzyme sensor arrays for detecting aromatic pesticides based on heteroatom‐doped graphene. The catalytic activity of the nanoenzyme is inhibited to varying degrees by different pesticides, resulting in distinct colors of catalytic reactions. Reproduced with permission.[ 539 ] Copyright 2020, American Chemical Society. b) A sensor array containing 24 sensing units for discriminating perfumes: (1) sensor responses to perfume samples, (2) the formulas of typical aromatic components in the perfume bases. Reproduced with permission.[ 540 ] Copyright 2022, American Chemical Society. c) Schematic of classifying food with a chemiresistive sensor array based on multi‐electrodes modified by SWCNTs and selectors as the active layer: (1) composition of the sensing device, including carbon‐based electrodes and polyimide substrate, (2) examples of one selector interacting with cheddar, Mahon, and pecorino, with conductance as the output signal. Reproduced with permission.[ 159 ] Copyright 2019, American Chemical Society.
Figure 11
Figure 11
Examples of multiplex detection of chemicals using label‐free SERS methods. a) Simultaneous detection of multiple pesticides (2,4‐dichlorophenoxyacetic acid (2,4‐D), glyphosate, and imidacloprid) utilizing a 3D Ag‐silica photonic microsphere array. Reproduced with permission.[ 552 ] Copyright 2023, American Chemical Society. b) Principles of a SERS array for identifying and quantifying wine flavor molecules with the assistance of ML. This sensor array comprises four sensing units, each capable of binding target molecules to form a SERS superprofile. Data analysis is performed using ML chemometric models for precise identification and quantification. Reproduced with permission.[ 104 ] Copyright 2021, American Chemical Society.
Figure 12
Figure 12
Illustrative Examples of Nanosensors for Pathogen Detection. The figure showcases various nanosensors used for pathogen detection, incorporating multiple specific single detection reactions. a) Multicolor Coding UCNPs: Functionalized with antibodies for detecting five types of pathogens based on immunoassay. Reproduced with permission.[ 568 ] Copyright 2021, American Chemical Society. b) Ultrasensitive Enzyme‐Linked Immunosorbent Assay (ELISA): Utilizes HCR and multicolor fluorescent dyes for the detection of three pathogenic bacteria. Reproduced with permission.[ 572 ] Copyright 2019, American Chemical Society. c) Single Virus Immunoassay: Employs multifunctional QD‐decorated magnetic nanospheres for the detection of three avian influenza viruses. Reproduced with permission.[ 575 ] Copyright 2019, American Chemical Society. d) Lateral Flow Immunoassay: Detects two respiratory viruses using two antibody‐modified Fe₃O₄@Ag magnetic tags. Reproduced with permission.[ 576 ] Copyright 2019, American Chemical Society.
Figure 13
Figure 13
Illustrative Examples of the CARMEN‐Cas Workflow for Virus Detection. a) CARMEN‐Cas Workflow: Illustration of the workflow capable of detecting 169 viruses simultaneously. b) Zika cDNA Detection: Example of sensitively detecting Zika cDNA using a single CARMEN‐Cas13 assay. Reproduced with permission.[ 590 ] Copyright 2020, Springer Nature.
Figure 14
Figure 14
Illustrative Examples of Multichannel Sensor Arrays for Bacteria Detection. a) Multichannel Sensor Array for Rapid Bacteria Identification: Utilizes a modified PEI‐GO complex, where nonspecific discrimination is based on electrostatic and hydrophobic interactions. The sensor array generates unique fingerprint patterns for each bacterium through multichannel fluorescence responses. Reproduced with permission.[ 597 ] Copyright 2022, American Chemical Society. b) Metabolism‐Triggered Colorimetric Sensor Array for Bacteria Fingerprinting: Based on the differential metabolic capabilities of bacteria toward various D‐AAs, which result in distinct aggregation states (colors) of gold nanoparticles. Reproduced with permission.[ 600 ] Copyright 2022, American Chemical Society. (c, d) Multichannel Sensor Array for Gut Microbiota Sensing: c) The array leverages the recognition ability of different antimicrobial agents and the competitive binding between gold nanoclusters and bacteria toward MXenes. d) The resulting heat map and HCA dendrogram showcase the fluorescent fingerprint patterns of five bacterial strains. Reproduced with permission.[ 601 ] Copyright 2023, American Chemical Society.
Figure 15
Figure 15
Colorimetric Sensor Array for Bacteria Discrimination. a) Principles of Colorimetric Sensor Array: Based on Wulff‐type boronate and electrically charged functionalized AgNPs at different pH levels for bacterial discrimination. b) Canonical Score LDA Plot for Bacterial Mixtures: Each point represents the fingerprint pattern of a bacterial sample, illustrating the separation and discrimination of different bacterial mixtures. c) RGB Values and Concentration Relationship: The RGB values of functionalized AgNPs reacting with P. aeruginosa at different concentrations, showing the linear relationship between the RGB values and the concentration of P. aeruginosa. Reproduced with permission.[ 603 ] Copyright 2019, American Chemical Society.
Figure 16
Figure 16
Detection of Various Pathogens Based on Volatile Organic Compounds. a) Principle of Paper Chromogenic Array: Illustration of the paper chromogenic array for multiplex pathogen detection, utilizing machine learning and automatic pattern recognition. b) Signal Patterns from Various Pathogens: Representation of the distinct signal patterns generated by different pathogens, enabling their identification and discrimination. Reproduced with permission.[ 117 ] Copyright 2021, Springer Nature.

Similar articles

Cited by

References

    1. World Health Organization , WHO Estimates of the Global Burden of Foodborne Diseases: Foodborne Disease Burden Epidemiology Reference Group 2007–2015, World Health Organization; 2015.
    1. Dattani S., Spooner F., Ritchie H., Roser M., Cause of death,Our World in Data 2023, https://ourworldindata.org/causes‐of‐death.
    1. van Dijk M., Morley T., Rau M. L., Saghai Y., Nature Food 2021, 2, 494. - PubMed
    1. Malik A. K., Blasco C., Picó Y., J. Chromatogr. A 2010, 1217, 4018. - PubMed
    1. Gazzaz S. S., Rasco B. A., Dong F. M., Crit. Rev. Food Sci. Nutr. 1992, 32, 197. - PubMed

MeSH terms

LinkOut - more resources