. 2025 Apr 8;26(8):3478.
doi: 10.3390/ijms26083478.

Development and Validation of a Prognostic Model for Lung Adenocarcinoma Based on CAF-Related Genes: Unveiling the Role of COX6A1 in Cancer Progression and CAF Infiltration

Affiliations

Development and Validation of a Prognostic Model for Lung Adenocarcinoma Based on CAF-Related Genes: Unveiling the Role of COX6A1 in Cancer Progression and CAF Infiltration

Xinyu Zhu et al. Int J Mol Sci. .

Abstract

Lung adenocarcinoma (LUAD), the predominant subtype of non-small cell lung cancer (NSCLC), presents significant challenges in early diagnosis and personalized treatment. Recent research has focused on the role of the tumor microenvironment, particularly tumor-associated fibroblasts (CAFs), in tumor progression. This study systematically analyzed CAF immune infiltration-related genes to construct a prognostic model for LUAD, confirming its predictive value for patient outcomes. The risk score derived from CAF-related genes (CAFRGs) was negatively correlated with immune microenvironment scores and linked to the expression of immune checkpoint genes, indicating that high-risk patients may exhibit immune escape characteristics. Analysis via the TIDE tool revealed that low-risk patients had more active T-cell immune responses. The risk score also correlated with anti-tumor drug sensitivity, particularly to doramapimod. Notably, COX6A1 emerged as a key gene in the model, with its upregulation associated with immune cell infiltration and immune escape. Further in vitro experiments demonstrated that COX6A1 regulates LUAD cell migration, proliferation, and senescence, suggesting its role in tumor immune evasion. Additionally, further co-culture studies of lung cancer cells and fibroblasts revealed that COX6A1 knockdown promotes the expression of CAF-related cytokines, enhancing CAF infiltration. Overall, this study provides a foundation for personalized treatment of LUAD and highlights COX6A1 as a promising therapeutic target within the tumor immune microenvironment, guiding future clinical research.

Keywords: COX6A1; immune microenvironment; lung adenocarcinoma; prognostic model; tumor-associated fibroblasts.


Conflict of interest statement

The authors declare that they have no conflicts of interest.

Figures
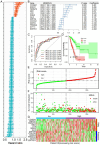
Figure 1
Figure 1
Construction and performance analysis of the CAFRG prognostic model. (A) Univariate Cox regression analysis identified CAFRGs associated with prognosis in the training cohort. (B) Multivariate Cox regression analysis was used to construct the prognostic model. (C) Time-dependent ROC curve showing the ROC and AUC values for 1–5 years in the training cohort. (D) Survival curves of high-risk and low-risk patients in the training cohort. (E) Distribution of risk scores in high- and low-risk patients and their survival outcomes and times in the training cohort. (F) Distribution of survival outcomes and times for high- and low-risk patients. (G) Heatmap showing the differential expression of CAFRGs in high- and low-risk samples in the training cohort. The gradient from green to red represents the range of expression in the dataset. ROC: receiver operating characteristic; CAFRG: cancer-associated fibroblast-related genes; AUC: area under the curve.
Figure 2
Figure 2
Validation of the model’s robustness in the TCGA LUAD and GSE31210 datasets. (A) Time-dependent ROC curve showing ROC and AUC values for 1–5 years in the TCGA LUAD dataset; (B) survival curves comparing high-risk and low-risk patients in the TCGA LUAD dataset; (C) distribution of risk scores and survival outcomes in high- and low-risk samples in the TCGA LUAD dataset; (D) heatmap showing the differential expression of CAFRGs in high- and low-risk samples in the TCGA LUAD dataset. The gradient from green to red represents the range of expression in the dataset; (E) time-dependent ROC curve showing ROC and AUC values for 1–5 years in the GSE31210 dataset; (F) survival curve comparison between high-risk and low-risk patients in the GSE31210 dataset; (G) distribution of risk scores and survival outcomes in high- and low-risk patients in the GSE31210 dataset; (H) heatmap showing the expression patterns of CAFRGs in high- and low-risk samples in the GSE31210 dataset. The gradient from green to red represents the range of expression in the dataset. TCGA: The Cancer Genome Atlas; LUAD: Lung adenocarcinoma; ROC: Receiver operating characteristic; CAFRG: Cancer-associated fibroblast-related genes; AUC: Area under the curve.
Figure 3
Figure 3
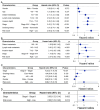
CAFRG risk score as an independent prognostic factor. (A) Forest plot showing univariate Cox analysis results of the CAFRG risk score and major clinicopathological features for patient prognosis in the TCGA LUAD dataset. (B) Forest plot showing the multivariate Cox analysis results of significant factors from univariate analysis for patient prognosis in the TCGA LUAD dataset. (C) Forest plot showing univariate Cox analysis results of the CAFRG risk score and major clinicopathological features for patient prognosis in the GSE31210 dataset. (D) Forest plot showing the multivariate Cox analysis results of significant factors from univariate analysis for patient prognosis in the GSE31210 dataset. TCGA: The Cancer Genome Atlas; LUAD: Lung adenocarcinoma; CAFRG: Cancer-associated fibroblast-related genes.
Figure 4
Figure 4
Construction and evaluation of the clinical prediction nomogram. (A) Clinical prediction nomogram constructed on the basis of independent prognostic factors identified by multivariate Cox analysis in the TCGA LUAD dataset; (B) Calibration curve showing the agreement between the predicted and actual 1-, 3-, and 5-year survival rates for the TCGA LUAD nomogram; (C) ROC curve evaluating the accuracy of the TCGA LUAD nomogram for predicting 1-, 3-, and 5-year survival; (D) DCA curve for the TCGA LUAD nomogram showing net benefit across different risk thresholds; (E) Clinical prediction nomogram constructed for the GSE31210 dataset on the basis of independent prognostic factors from multivariate Cox analysis; (F) Calibration curve for the GSE31210 nomogram; (G) Kaplan–Meier survival curve for the GSE31210 nomogram; (H) Decision curve analysis for the GSE31210 nomogram. TCGA: The Cancer Genome Atlas; LUAD: Lung adenocarcinoma; ROC: Receiver operating characteristic; AUC: Area under the curve; DCA: Decision curve analysis; Cox: Cox regression analysis.
Figure 5
Figure 5
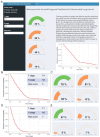
Construction of the nomogram-based clinical prediction tool. (A) An online tool designed for visual prediction based on the TCGA LUAD and GSE31210 data predicted survival probabilities and curves for parameters T4, N0, and risk score of 5 (B,C); Predicted survival probabilities and curves for parameters T1, N0, and risk score of 7 (D,E).
Figure 6
Figure 6
Correlation of the risk score with immune cell infiltration and immunotherapy in the TCGA LUAD dataset. (A) Lollipop plot showing the correlation between the risk score and immune cell infiltration score calculated via the xCell algorithm. Scatter plots depicting the correlation between the risk score and immune microenvironment score (B) and immune score (C). (D) Lollipop plot illustrating the correlation between the risk score and expression of immune checkpoint genes. Scatter plots showing the correlation between the risk score and the expression of BTLA (E) and VSIR (F). Scatter plots and box plots demonstrate the correlation between the risk score and immune infiltration score of T-cell dysfunction (G), exclusion (H), MDSC (I), and CAF (J) based on the TIDE algorithm. TCGA: The Cancer Genome Atlas; LUAD: Lung adenocarcinoma; TIDE: Tumor immune dysfunction and exclusion; CAF: Cancer-associated fibroblasts; MDSC: Myeloid-derived suppressor cells.
Figure 7
Figure 7
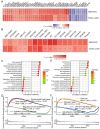
Correlation between the CAFRG risk score and progression of lung adenocarcinoma. Heatmap displaying the correlation between the CAFRG risk score and oncogenes in the TCGA LUAD and GSE31210 datasets (A) and the association with anticancer drug sensitivity calculated via OncoPredict (B). Lollipop plots showing the results of GSEA enrichment analysis for biological functions (C) and signaling pathways (E) in the TCGA LUAD dataset. GSEA plots show enrichment of the CAFRG risk score in key biological functions (D) and signaling pathways (F). TCGA: The Cancer Genome Atlas; LUAD: Lung adenocarcinoma; CAFRG: Cancer-associated fibroblast-related genes; GSEA: Gene set enrichment analysis.
Figure 8
Figure 8
COX6A1 is a gene that promotes tumor progression in the CAFRG prognostic model. (A) The scatter plot illustrates the correlation analysis between CAFRGs and the risk score in the model, revealing a strong association between COX6A1 and the risk score. (B) The heatmap illustrates the expression variation of COX6A1 in tumor tissues compared with normal tissues across multiple LUAD datasets. (C) The survival curve shows the prognostic differences between patients with high and low expression of COX6A1 in the TCGA LUAD dataset. (D) The lollipop plot shows the correlation between COX6A1 expression and immune checkpoint gene expression in the TCGA LUAD dataset. The scatter plots illustrate the correlation between COX6A1 expression and cancer associated fibroblast infiltration score (E) and microenvironment score (F) derived from xCell, highlighting associations with various immune cell types. (G) The scatter plot displays the correlation between COX6A1 expression and antitumor drug sensitivity scores on the basis of OncoPredict, suggesting enhanced drug sensitivity. (H) The scatter plot shows the correlation between COX6A1 expression and tumor stemness assessed by the RNA stemness score (RNAs), indicating a strong positive relationship. (I) The lollipop plot depicts signaling pathways associated with COX6A1 identified by GSEA. (J) The lollipop plot reveals biological functions related to COX6A1 expression. (K) The GSEA plot highlights COX6A1 related to DNA replication, oxidative phosphorylation, and cell adhesion molecules. TCGA: The Cancer Genome Atlas; LUAD: Lung adenocarcinoma; CAFRG: Cancer-associated fibroblast-related gene; GSEA: Gene set enrichment analysis.
Figure 9
Figure 9
COX6A1 is a gene that promotes tumor progression in the model. CCK8 assay for analyzing the effects of COX6A1 knockdown on the proliferation of A549 (A) and H1299 (B) lung adenocarcinoma cells; CCK8 assay dose–response curves of A549 (C) and H1299 (D) cells treated with different concentrations of Doramapimod; Transwell migration assay images (E) and quantification (F) showing the effects of COX6A1 knockdown on cell migration; EdU proliferation assay images (G) and quantification (H) showing the impact of COX6A1 knockdown on cell proliferation; β-galactosidase staining images (I) and quantification (J) showing the induction of cellular senescence following COX6A1 knockdown; qPCR analysis showing changes in COX6A1 (K) and migration and senescence-related genes (L) after knockdown; Western blot analysis images (M) and quantification (N) demonstrating changes in migration and senescence-related proteins. This section may be divided into subheadings. It should provide a concise and precise description of the experimental results, their interpretation, as well as the experimental conclusions that can be drawn. Compare with shNC, * p < 0.05, ** p < 0.01, *** p < 0.001.
Figure 10
Figure 10
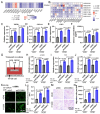
COX6A1 overexpression in lung cancer cells promotes CAF infiltration. Heat maps show the correlation between COX6A1 and the expression of CAF activation-related cytokines in the TCGA LUAD dataset (A) and multiple LUAD datasets from the GEO database (B). qPCR analysis of COX6A1-knockdown lung cancer cells shows changes in the expression of TGFB2 (C), CXCL12 (D), and FGF2 (E). (F) ELISA analysis of CXCL12 levels in the culture supernatant of COX6A1-knockdown lung cancer cells. (G) A co-culture system of lung cancer cells and human embryonic lung cells WI-38. qPCR analysis of RNA expression of α-SMA (H), FN1 (I), and VIM (J) in WI-38 cells co-cultured with lung cancer cells. Immunofluorescence images (K) and quantitative results (L) showing α-SMA expression in WI-38 cells co-cultured with lung cancer cells. Transwell migration assay images (M) and quantitative results (N) show the migratory capacity of WI-38 cells co-cultured with lung cancer cells. TCGA, The Cancer Genome Atlas; LUAD, Lung Adenocarcinoma; GEO, Gene Expression Omnibus.

Similar articles

References

    1. Thai A.A., Solomon B.J., Sequist L.V., Gainor J.F., Heist R.S. Lung cancer. Lancet. 2021;398:535–554. doi: 10.1016/s0140-6736(21)00312-3. - DOI - PubMed
    1. Chen P., Liu Y., Wen Y., Zhou C. Non-small cell lung cancer in China. Cancer Commun. 2022;42:937–970. doi: 10.1002/cac2.12359. - DOI - PMC - PubMed
    1. Li Y., Yan B., He S. Advances and challenges in the treatment of lung cancer. Biomed. Pharmacother. 2023;169:115891. doi: 10.1016/j.biopha.2023.115891. - DOI - PubMed
    1. Sen T., Takahashi N., Chakraborty S., Takebe N., Nassar A.H., Karim N.A., Puri S., Naqash A.R. Emerging advances in defining the molecular and therapeutic landscape of small-cell lung cancer. Nat. Rev. Clin. Oncol. 2024;21:610–627. doi: 10.1038/s41571-024-00914-x. - DOI - PMC - PubMed
    1. Biffi G., Tuveson D.A. Diversity and Biology of Cancer-Associated Fibroblasts. Physiol. Rev. 2021;101:147–176. doi: 10.1152/physrev.00048.2019. - DOI - PMC - PubMed

MeSH terms

Substances

LinkOut - more resources