. 2025 Apr 9;26(8):3531.
doi: 10.3390/ijms26083531.

Cyclosporine A Accelerates Neurorecovery Transcriptional Trajectory in a Swine Model of Diffuse Traumatic Brain Injury

Affiliations

Cyclosporine A Accelerates Neurorecovery Transcriptional Trajectory in a Swine Model of Diffuse Traumatic Brain Injury

Oluwagbemisola Aderibigbe et al. Int J Mol Sci. .

Abstract

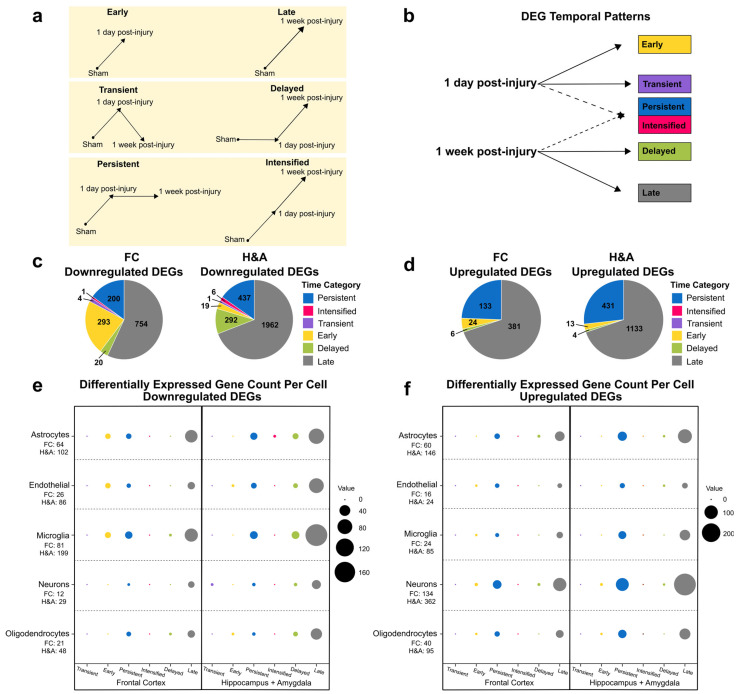
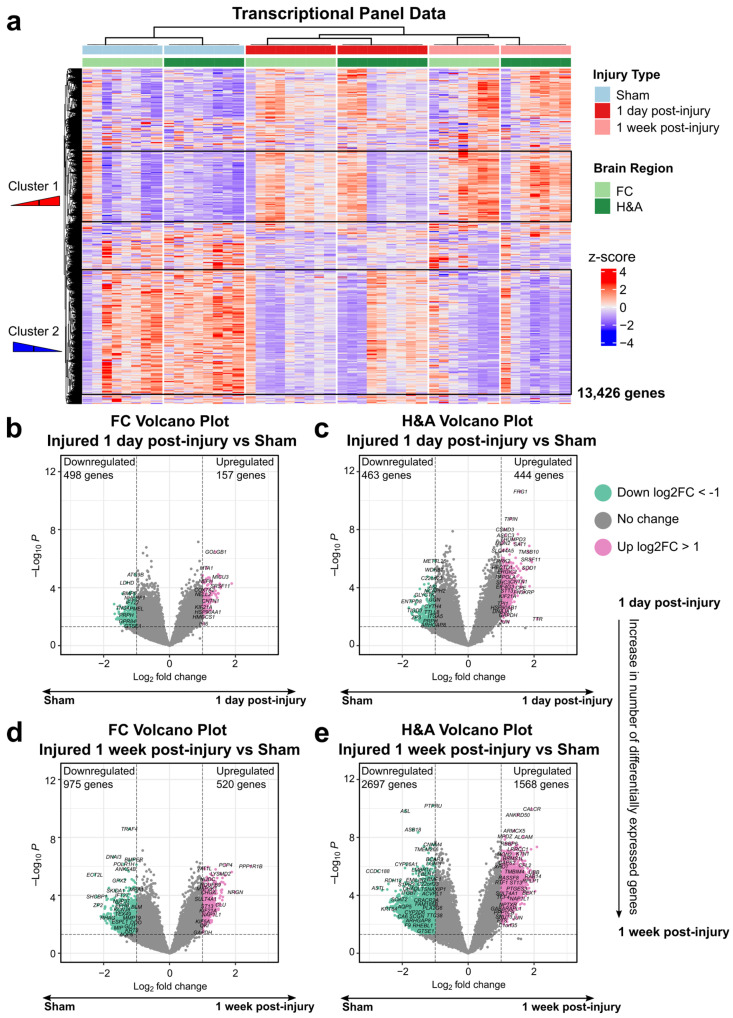
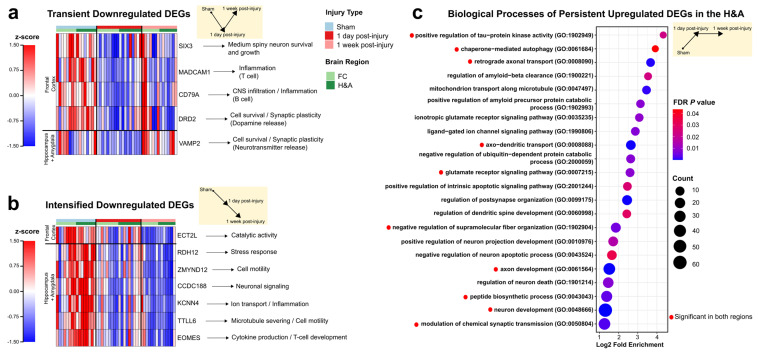
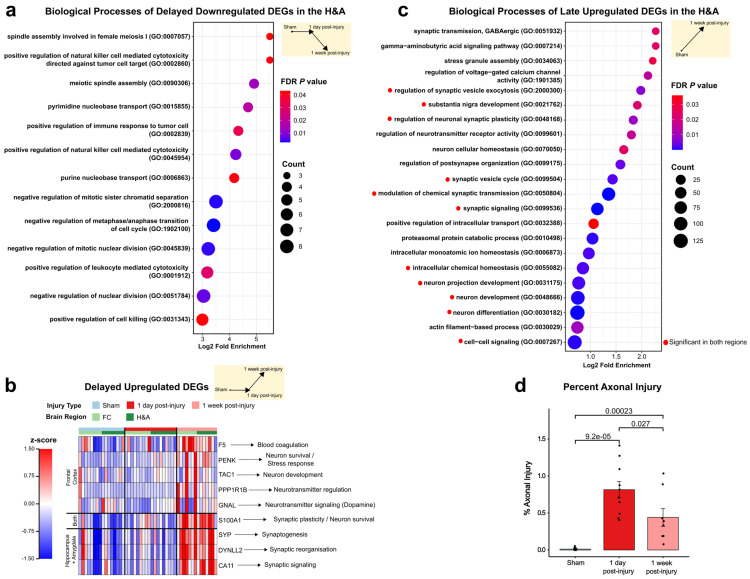
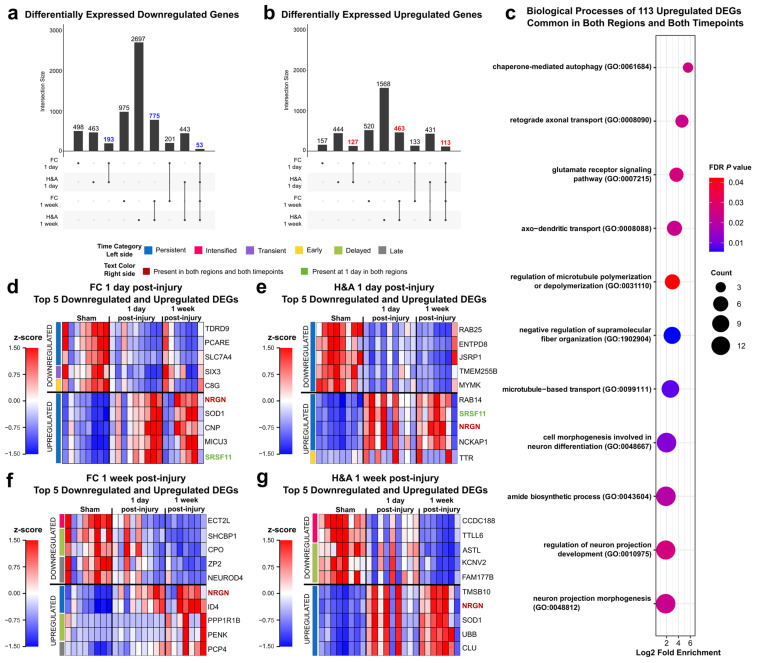
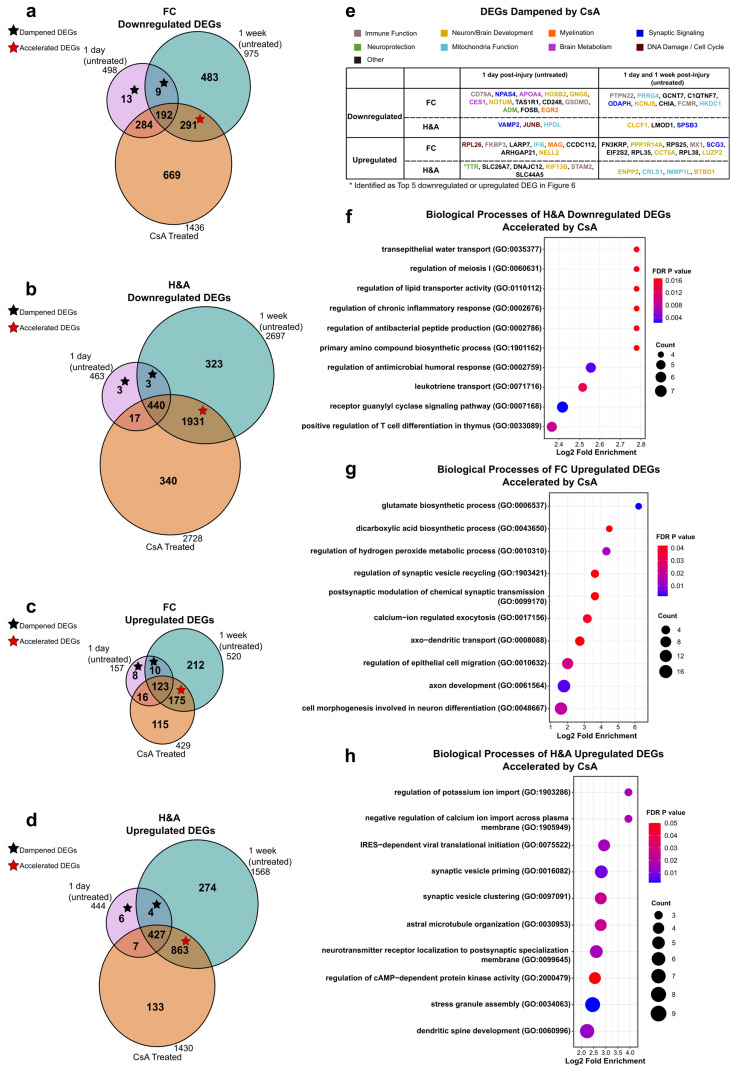
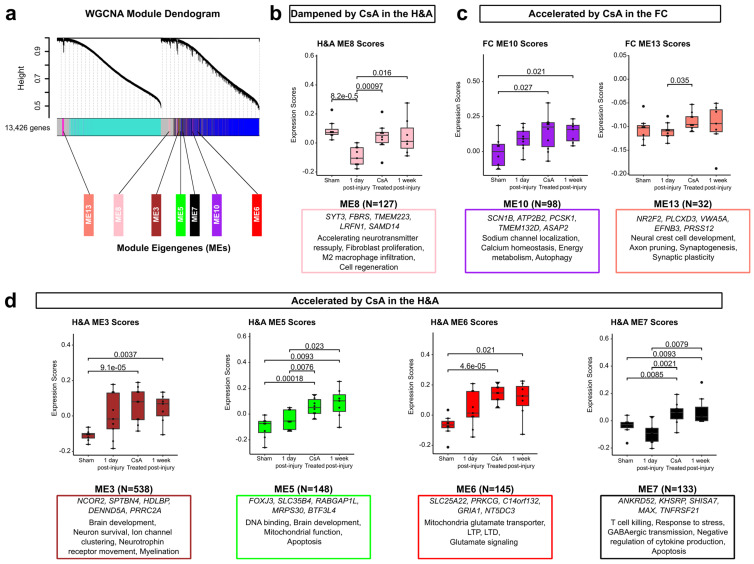
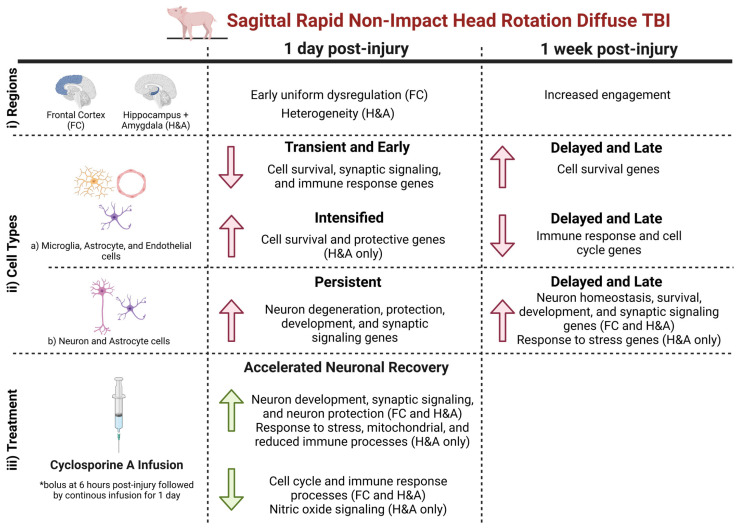
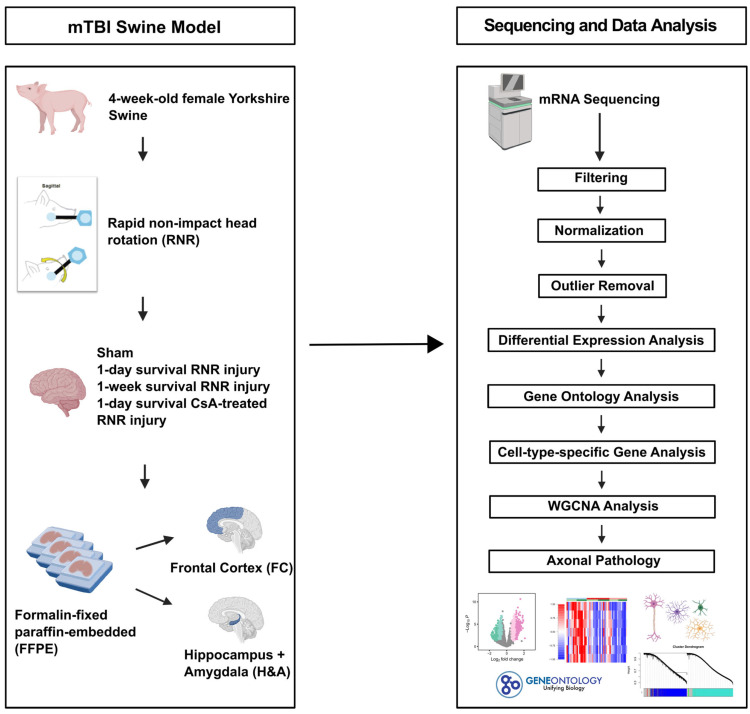
Mild traumatic brain injury (mTBI) is a leading cause of morbidity in children with both short- and long-term neurological, cognitive, cerebrovascular, and emotional deficits. These deficits have been attributed to ongoing pathophysiological cascades that occur acutely and persist post-injury. Given our limited understanding of the transcriptional changes associated with these pathophysiological cascades, we studied formalin-fixed paraffin-embedded (FFPE) tissues from the frontal cortex (FC) and the hippocampus + amygdala (H&A) regions of swine (N = 40) after a sagittal rapid non-impact head rotation (RNR). We then sequenced RNA to define transcriptional changes at 1 day and 1 week after injury and investigated the protective influence of cyclosporine A (CsA) treatment. Differentially expressed genes (DEGs) were classified into five temporal patterns (Early, Transient, Persistent, Intensified, Delayed, or Late). DEGs were more abundant at 1 week than 1 day. Shared significant gene ontology annotations in both regions included terms associated with neuronal distress at 1 day and neurorecovery at 1 week. CsA (20 mg/kg/day) infused for 1 day (beginning at 6 h after injury) accelerated 466 DEGs in the FC and 2794 DEGs in the H&A, such that the CsA-treated transcriptional profile was associated with neurorecovery. Overall, our data reveal the effects of anatomic region and elapsed time on gene expression post-mTBI and motivate future studies of CsA treatment.

Keywords: RNA-seq; TBI; gene expression; pediatric; pig; treatment; weighted gene co-expression network analysis.


Conflict of interest statement

The funding institutions had no role in the conceptualization, study design, data collection, analysis, preparation, writing, review, and decision to submit this manuscript for publication.

Figures

Figure 2
Figure 2
Temporal patterns for differentially expressed genes. (a) DEG temporal pattern definitions and descriptions. Early: DEG only at 1 day compared to Sham. Transient: DEG only at 1 day compared to both Sham and 1 week post-injury. Persistent: DEG at 1 day and remained significantly altered by 1 week post-injury, both compared to Sham. Intensified: DEG at 1 day, and significantly altered further at 1 week post-injury relative to the 1-day level. Delayed: DEG only at 1 week post-injury, when compared to both Sham and 1 day post-injury. Late: DEG only at 1 week post-injury compared to Sham. (b) Connection between post-injury timepoints and temporal patterns. (c) Populations of Transient, Early, Persistent, Intensified, Delayed, and Late downregulated DEGs. (d) Populations of Persistent, Intensified, Transient, Early, Delayed, and Late upregulated DEGs. (e) Number of cell type-specific genes within each downregulated temporal pattern. The total number of DEGs for each specific cell type in FC and H&A are listed on the vertical axis. (f) Number of cell-specific genes within each upregulated temporal pattern. The total number of DEGs for each specific cell type in FC and H&A are listed on the vertical axis. The size of the circles represents the number of cell type-specific genes from each cell (vertical axis) in each temporal pattern (horizontal axis). DEGs, differentially expressed genes. FC, frontal cortex. H&A, hippocampus + amygdala.
Figure 1
Figure 1
Increased alteration of genes by 1 week post-injury in both regions. (a) Hierarchal clustering of all genes across all injury groups in the FC (light green) and H&A (dark green). Each row represents a gene, and each column represents an animal subject (rows were z-scored). (b) Differentially expressed genes (DEGs) between the Sham and injured 1 day post-injury groups in the FC and (c) H&A, consecutively. DEGs have unadjusted p-values ≤ 0.05 (above dashed horizontal line) and corresponding log2 fold change |log2FC| ≥ 1. (d) DEGs between the Sham and injured 1 week post-injury groups in the FC and (e) H&A, consecutively. DEGs have unadjusted p-values ≤ 0.05 (above dashed horizontal line) and corresponding log2 fold change |log2FC| ≥ 1. mTBI, mild traumatic brain injury. DEGs, differentially expressed genes. Log2FC, log2 fold change. FC, frontal cortex. H&A, hippocampus + amygdala.
Figure 3
Figure 3
Neuronal and immune genes are altered at 1 day post-injury. (a) Transient downregulated DEGs. Each row represents a DEG, and each column represents an animal subject (rows are z-scored). (b) Intensified downregulated DEGs. Each row represents a DEG, and each column represents an animal subject (rows were z-scored). (c) Top GO terms for the Persistent upregulated DEGs in the H&A (FDR ≤ 0.05). Red circles indicate those significant in the FC and H&A. Red to blue indicates high to low FDR p-values. Count is the number of DEGs making up each GO term. DEGs, differentially expressed genes. FDR, false discovery rate. FC, frontal cortex. H&A, hippocampus + amygdala.
Figure 4
Figure 4
Synaptic, survival, and developmental genes are increased later at 1 week post-injury. (a) Top GO terms for the delayed downregulated DEGs in the H&A (FDR ≤ 0.05). Red to blue indicates high to low FDR p-values. Count is the number of DEGs making up each GO term. (b) Delayed upregulated DEGs. Each row represents a DEG, and each column represents an animal subject (rows were z-scored). (c) Top GO terms for the Late upregulated DEGs in the H&A (FDR ≤ 0.05). Red circles indicate those significant in the FC and H&A. Red to blue indicates high to low FDR p-values. Count is the number of DEGs making up each GO term. (d) Percent axonal injury for Sham and injured groups. Significance was achieved using the Wilcox test, with the Bonferroni adjustment (p ≤ 0.05). Data are shown as the mean ± standard error. DEGs, differentially expressed genes. FDR, false discovery rate. FC, frontal cortex. H&A, hippocampus + amygdala.
Figure 5
Figure 5
Common and top 5 DEGs in both regions and at both timepoints. (a) Upset plot depicting the number of overlapping downregulated DEGs (unadjusted p ≤ 0.05, |log2FC| ≥ 1) between groups. (b) Upset plot depicting the number of overlapping upregulated DEGs (unadjusted p ≤ 0.05, |log2FC| ≥ 1) between groups. (c) Top GO terms for the 113 upregulated DEGs in both regions and at both timepoints (FDR ≤ 0.05). Red to blue indicates high to low FDR p-values. Count is the number of DEGs making up each GO term. (d) Top 5 downregulated and upregulated DEGs in the FC at 1 day post-injury (FDR ≤ 0.05, |log2FC| ≥ 1). (e) Top 5 downregulated and upregulated DEGs in the H&A at 1 day post-injury (FDR ≤ 0.05, |log2FC| ≥ 1). (f) Top 5 downregulated and upregulated DEGs in the FC at 1 week post-injury (FDR ≤ 0.05, |log2FC| ≥ 1). (g) Top 5 downregulated and upregulated DEGs in the H&A at 1 week post-injury (FDR ≤ 0.05, |log2FC| ≥ 1). NRGN (bold red) is present in all groups. SRSF11 (bold green) is present in both regions at 1 day post-injury. Each row represents a DEG, and each column represents an animal subject (rows were z-scored). DEGs, differentially expressed genes. FC, frontal cortex. H&A, hippocampus + amygdala.
Figure 6
Figure 6
Cyclosporine A accelerates neurorecovery DEGs. Venn diagrams highlighting dampened (black stars) and accelerated DEGs (red stars). The pink circle represents DEGs in the 1 day post-injury vs. Sham comparison, the green circle represents DEGs in the 1 week post-injury vs. Sham comparison, and the orange circle represents DEGs in the CsA-treated vs Sham comparison. Dampened DEGs are in the 1-day-post-injury-only and 1-day-post-injury + 1-week-post-injury sections. Accelerated DEGs are in the 1-week-post-injury + CsA-treated sections for the (a) FC downregulated, (b) H&A downregulated, (c) FC upregulated, and (d) H&A upregulated DEGs. (e) Functions of dampened DEGs. (f) Top GO terms of accelerated downregulated DEGs in the H&A (FDR ≤ 0.05). Red to blue indicates high to low FDR p-values. Count is the number of DEGs making up each GO term. (g) Top GO terms of accelerated upregulated DEGs in the FC (FDR ≤ 0.05). Red to blue indicates high to low FDR p-values. Count is the number of DEGs making up each GO term. (h) Top GO terms of accelerated upregulated DEGs in the H&A (FDR ≤ 0.05). Red to blue indicates high to low FDR p-values. Count is the number of DEGs making up each GO term. FDR, false discovery rate. FC, frontal cortex. H&A, hippocampus + amygdala. CsA, cyclosporine A.
Figure 7
Figure 7
Functional modules dampened or accelerated by CsA treatment. (a) Hierarchical clustering tree of 13,426 genes. Each gene cluster (module) has a distinct color representing co-expressed genes. A total of 13 modules were identified. Modules highlighted are those dampened or accelerated in either region. (b) Expression scores of the dampened module, ME8 (pink), in the H&A. The box includes its top 5 hub genes and their functions. (c) Expression scores of the accelerated modules, ME10 (purple) and ME13 (salmon), in the FC. The boxes include their top 5 hub genes and their functions. (d) Expression scores of the accelerated modules, ME3 (brown), ME5 (green), ME6 (red), and ME7(black), in the H&A. The boxes include their top 5 hub genes and their functions. All stats, Wilcox test, Bonferroni-adjusted p ≤ 0.05). Data are shown as the mean ± standard error. FC, frontal cortex. H&A, hippocampus + amygdala. CsA, cyclosporine A. ME, module eigengene.
Figure 8
Figure 8
Results summary. Created in BioRender. Wood, L. (2025) https://BioRender.com/2oqfrhu (accessed on 4 April 2025).
Figure 9
Figure 9
Schematic of experimental design.

Similar articles

References

    1. Kureshi N., Erdogan M., Thibault-Halman G., Fenerty L., Green R.S., Clarke D.B. Long-Term Trends in the Epidemiology of Major Traumatic Brain Injury. J. Community Health. 2021;46:1197–1203. doi: 10.1007/s10900-021-01005-z. - DOI - PubMed
    1. Theodorou C.M., Nuño M., Yamashiro K.J., Brown E.G. Increased Mortality in Very Young Children with Traumatic Brain Injury Due to Abuse: A Nationwide Analysis of 10,965 Patients. J. Pediatr. Surg. 2021;56:1174–1179. doi: 10.1016/j.jpedsurg.2021.02.044. - DOI - PMC - PubMed
    1. Dewan M.C., Mummareddy N., Wellons J.C., Bonfield C.M. Epidemiology of Global Pediatric Traumatic Brain Injury: Qualitative Review. World Neurosurg. 2016;91:497–509.e1. doi: 10.1016/j.wneu.2016.03.045. - DOI - PubMed
    1. Georges A., M Das J. StatPearls. StatPearls Publishing; Treasure Island, FL, USA: 2022. Traumatic Brain Injury.
    1. Røe C., Sveen U., Alvsåker K., Bautz-Holter E. Post-Concussion Symptoms after Mild Traumatic Brain Injury: Influence of Demographic Factors and Injury Severity in a 1-Year Cohort Study. Disabil. Rehabil. 2009;31:1235–1243. doi: 10.1080/09638280802532720. - DOI - PubMed

LinkOut - more resources