. 2025 Apr 10;26(8):3586.
doi: 10.3390/ijms26083586.

Disruption of Man-6-P-Dependent Sorting to Lysosomes Confers IGF1R-Mediated Apoptosis Resistance

Affiliations

Disruption of Man-6-P-Dependent Sorting to Lysosomes Confers IGF1R-Mediated Apoptosis Resistance

Asena Aynaci et al. Int J Mol Sci. .

Abstract

Mutations in GNPTAB underlie mucolipidosis II and mucolipidosis III α/β, which are inherited lysosomal storage disorders caused by a defective UDP-N-acetylglucosamine:lysosomal-enzyme N-acetylglucosamine phosphotransferase. As a result, newly synthesized acid hydrolases fail to acquire Mannose-6-Phosphate (Man-6-P) sorting signals, or do so to a lesser extent, and exhibit an impaired trafficking to lysosomes. Interestingly, we found that GNPTAB knockout HeLa cells are resistant to several cytotoxic agents: doxorubicin, chloroquine, staurosporine and paclitaxel. While we detected an increased trapping of weak bases in the expanded lysosomal population of these cells, which could reduce the effect of doxorubicin and chloroquine; the decreased cell response to staurosporine and paclitaxel suggested the involvement of alternative resistance mechanisms. Indeed, further investigation revealed that the hyperactivation of the Insulin-like Growth Factor 1 Receptor (IGF1R) pathway is a central player in the apoptosis resistance exhibited by Man-6-P sorting deficient cells.

Keywords: GNPTAB; IGF1R; apoptosis; lysosomes; mannose-6-phosphate, M6PR; mucolipidosis II.


Conflict of interest statement

The authors declare no conflicts of interest.

Figures
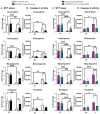
Figure 1
Figure 1
Analysis of GNPTAB KO HeLa cells resistance to cytotoxic drugs. (A,C) Measurement of metabolic activity of WT and GNPTAB KO cells ((A): SK clones and (C): newly generated clones) using MTT assay, 48 h after treatment with 2.5 μM doxorubicin, 25 μM chloroquine, 50 nM staurosporine or 50 nM paclitaxel. Means ± SD of OD48h relative to OD0h are shown on graphs. OD = Optical Density. n = 6 independent experiments for each panel (indicated with small circle dots). For panel C, 2 control and 3 KO clones were assessed separately in experiments prior to pooling of results. (B,D) Caspase 3/7 activity (fluorescence units/μg of total proteins) was measured in WT and GNPTAB KO cells ((B): SK clones and (D): newly generated clones), as described in Section Materials and Methods to assess apoptosis induction at early time points after treatment with doxorubicin, chloroquine, staurosporine or paclitaxel. Means ± SD. n ≥ 4 independent experiments (indicated with small circle dots). NT = Non-Treated and T = Treated * p < 0.05; ** p < 0.01; *** p < 0.001; **** p < 0.0001; and One-way ANOVA.
Figure 2
Figure 2
Trapping of weak bases in GNPTAB KO and control HeLa cells. (A) Labeling of intracellular acidic compartments of control and GNPTAB KO cells (SK clones) for 15 min with 1.5 μM acridine orange (AO). Scale bars, 25 μm. Graph shows mean red signal intensity in cytoplasm (arbitrary units) ± SEM. n = 3 independent experiments with 10 cells analyzed per genotype (shown as circled dots). (B) Immunofluorescence detection of late endosomal/lysosomal marker LAMP1 (green). Nuclei were stained with DAPI (blue). Scale bars, 25 μm. Graphs show mean lysosomal diameter and average number of lysosomes per cell ± SEM. n = 3 independent experiments with 10 cells analyzed in each experiment and for each cell type. (C) Detection of doxorubicin (DOXO, red) in cells transfected with LAMP1-GFP (green). Cells were observed 48 h post-transfection. They were treated for last 16 h with 2.5 μM DOXO. Scale bars, 10 μm. n = 3 independent experiments with 10 cells analyzed per condition. Graph shows mean red signal intensity in cytoplasm (arbitrary units) ± SEM. *** p < 0.001; **** p < 0.0001. Unpaired t-test. N.B. Dotted lines indicate zoomed areas.
Figure 3
Figure 3
IGF1R pathway activation in GNPTAB KO HeLa cells. (A) Western blotting detection of total IGF1R and phosphorylated (Tyr1135/1136) IGF1R (pIGF1R) in lysates of WT and GNPTAB KO HeLa cells (SK clones) cultured in 10% FBS-containing medium supplemented or not with IGF-II (30 ng/mL) for 30 min. Graph shows mean relative level (fold changes) of pIGF1R/IGF1R ratio ± SD. n = 4 independent experiments. * p < 0.05. One-way ANOVA (B) Western blotting detection of total IGF1R and pIGF1R after 48 h of incubation of cells with purified Man-6-P-bearing acid hydrolases extracted from mouse brain. Graph shows mean relative level of pIGF1R/IGF1R ratio ± SD. n = 4 independent experiments. * p < 0.05. One-way ANOVA. The 55 kDa fragment detected in KO cells was not included in quantifications. (C) Western blotting detection of total AKT and phosphorylated (Ser473) AKT (pAKT) in conditions described in A. Mean relative level of pAKT/AKT ratio ± SD. n = 4 independent experiments. * p < 0.05. ** p < 0.01. One-way ANOVA. (D) Proteins located at cell surface were biotinylated (B fraction) at 4 °C and separated from non-biotinylated proteins (NB, intracellular fraction) as described in Section 4. GAPDH is cytosolic protein and was detected in these fractions to control that biotinylated reagent did not enter cells. As expected, no signal was detected in B fraction for this protein. pIGF1R and IGF1R were then analyzed. Dilution factors of each fraction are indicated at top of each blot. Graph shows percentage of signal detected in each fraction. n = 3 independent experiments. * p < 0.05. Unpaired t-test.
Figure 4
Figure 4
Analysis of effect of IGF1R inhibitor on apoptosis resistance of GNPTAB KO HeLa. Measurement of metabolic activity of WT and GNPTAB KO cells (SK clones) using MTT assay, 48 h after treatment with 2.5 μM doxorubicin, 25 μM chloroquine, 50 nM staurosporine or 50 nM paclitaxel in presence or absence of IGF-II (30 ng/mL) and of IGF1R inhibitor NVP-AEW541 (50 nM). n = 6 independent experiments. Means ± SD of OD48h relative to OD0h are shown on graph. * p < 0.05; ** p < 0.01; *** p < 0.001; and **** p < 0.0001. One-way ANOVA.

Similar articles

References

    1. Kornfeld S. Trafficking of lysosomal enzymes. Faseb J. 1987;1:462–468. doi: 10.1096/fasebj.1.6.3315809. - DOI - PubMed
    1. von Figura K., Hasilik A. Lysosomal enzymes and their receptors. Annu. Rev. Biochem. 1986;55:167–193. doi: 10.1146/annurev.bi.55.070186.001123. - DOI - PubMed
    1. Kornfeld S., Mellman I. The biogenesis of lysosomes. Annu. Rev. Cell Biol. 1989;5:483–525. doi: 10.1146/annurev.cb.05.110189.002411. - DOI - PubMed
    1. Braulke T., Carette J.E., Palm W. Lysosomal enzyme trafficking: From molecular mechanisms to human diseases. Trends Cell Biol. 2024;34:198–210. doi: 10.1016/j.tcb.2023.06.005. - DOI - PubMed
    1. Reitman M.L., Kornfeld S. UDP-N-acetylglucosamine:glycoprotein N-acetylglucosamine-1-phosphotransferase. Proposed enzyme for the phosphorylation of the high mannose oligosaccharide units of lysosomal enzymes. J. Biol. Chem. 1981;256:4275–4281. doi: 10.1016/S0021-9258(19)69430-5. - DOI - PubMed

MeSH terms

LinkOut - more resources