. 2025 May 20;139(10):479-501.
doi: 10.1042/CS20255922.

LONP1 facilitates pulmonary artery smooth muscle cell glycolytic reprogramming by degrading MPC1 in pulmonary hypertension

Affiliations

LONP1 facilitates pulmonary artery smooth muscle cell glycolytic reprogramming by degrading MPC1 in pulmonary hypertension

Mingkang Li et al. Clin Sci (Lond). .

Abstract

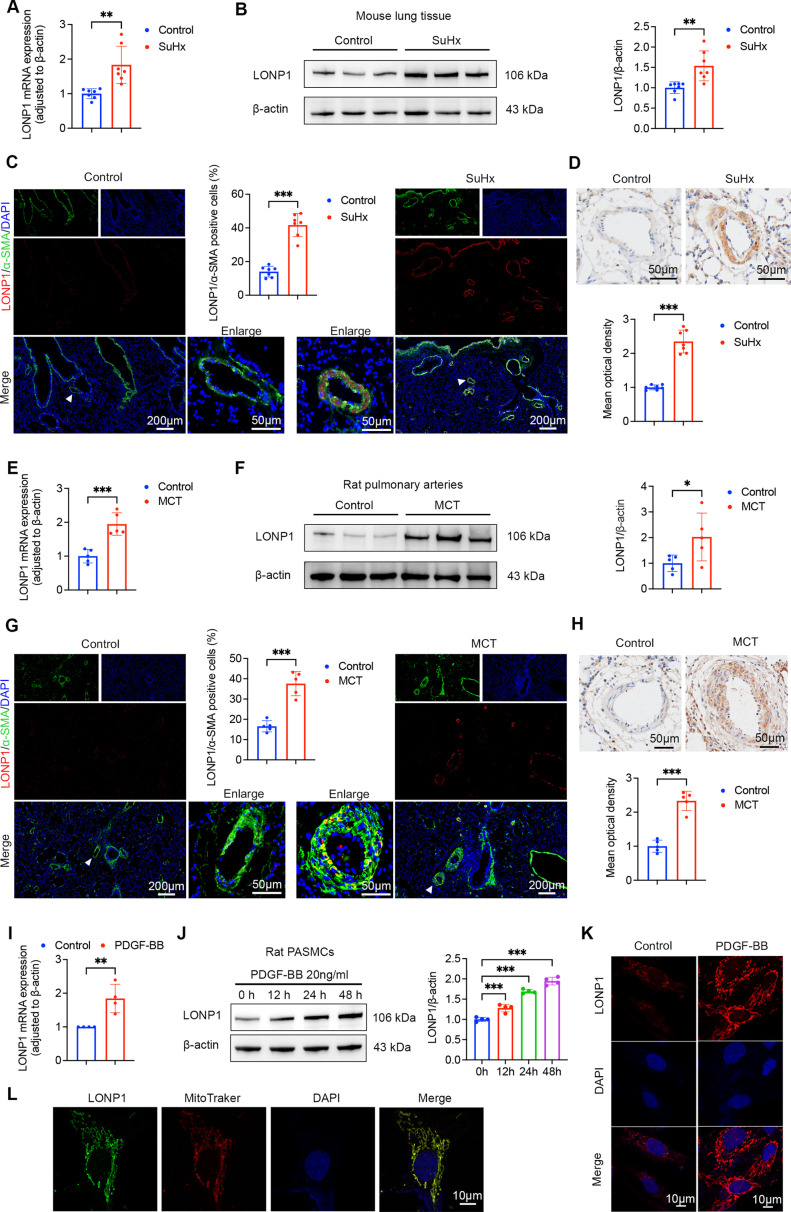
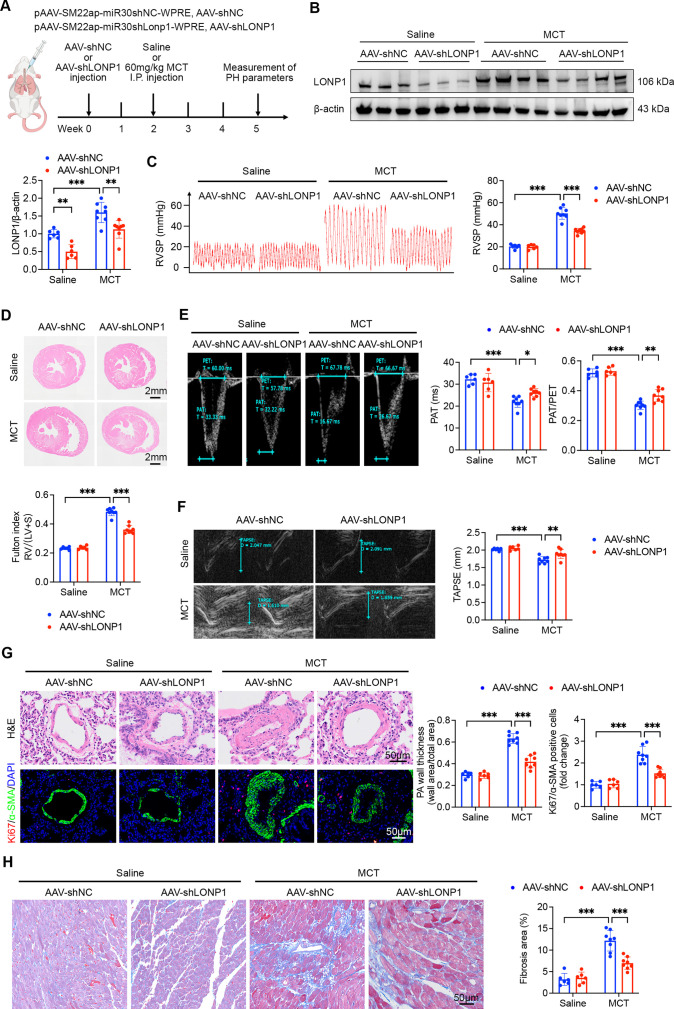
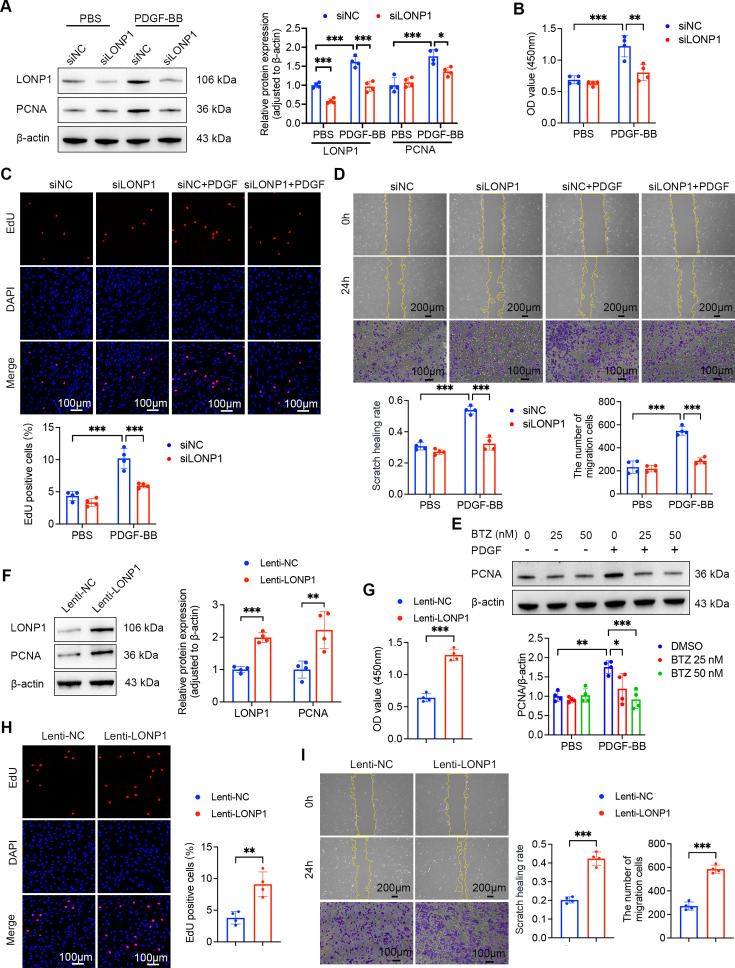
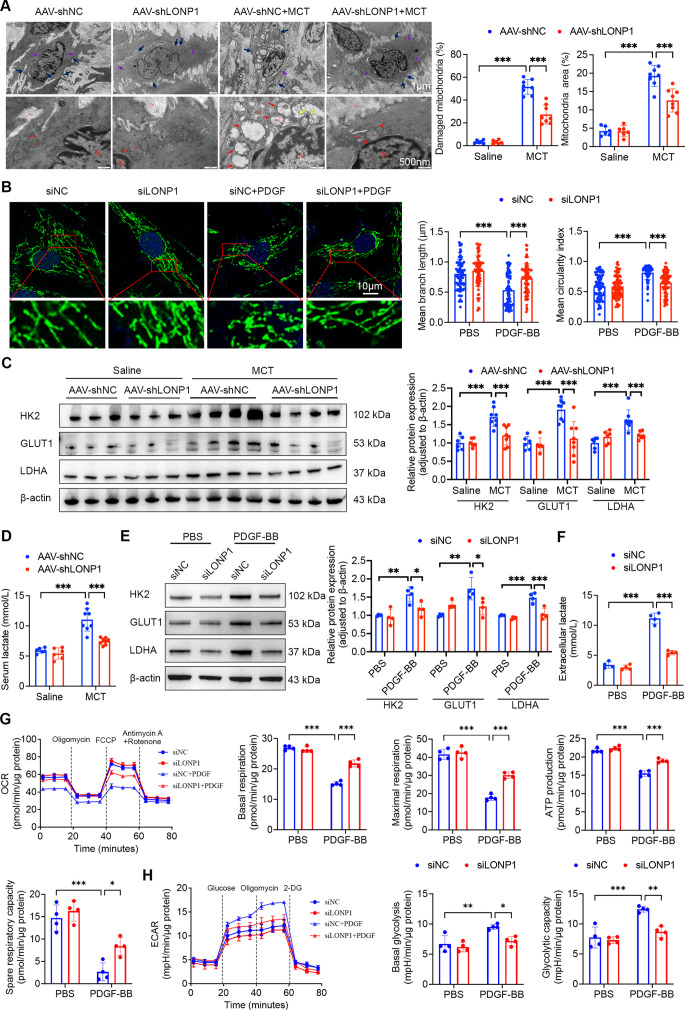
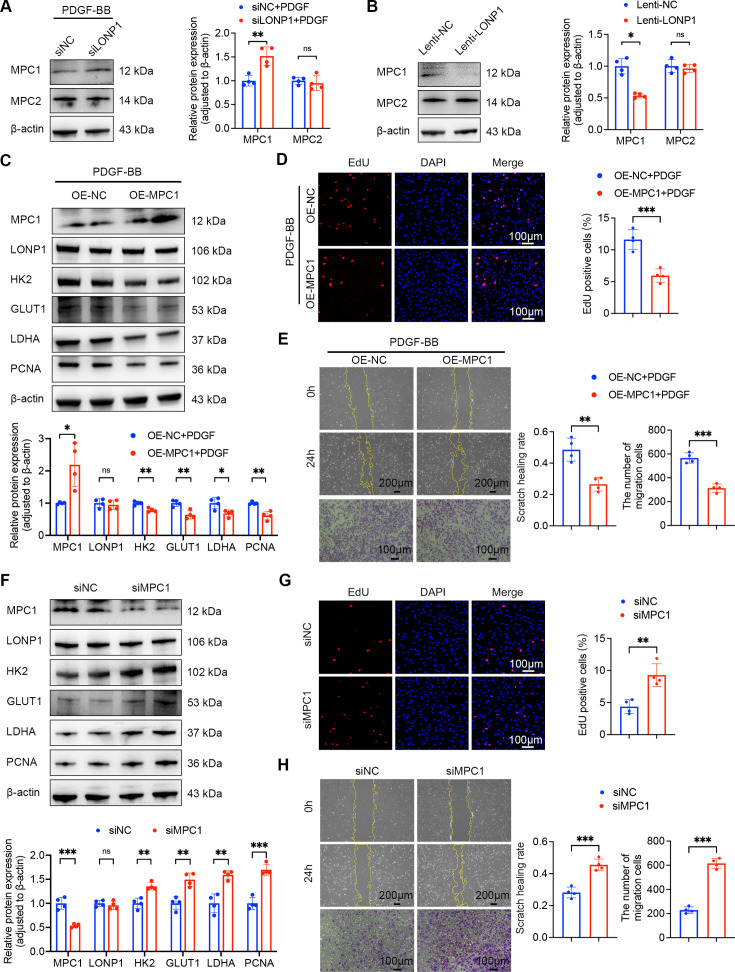
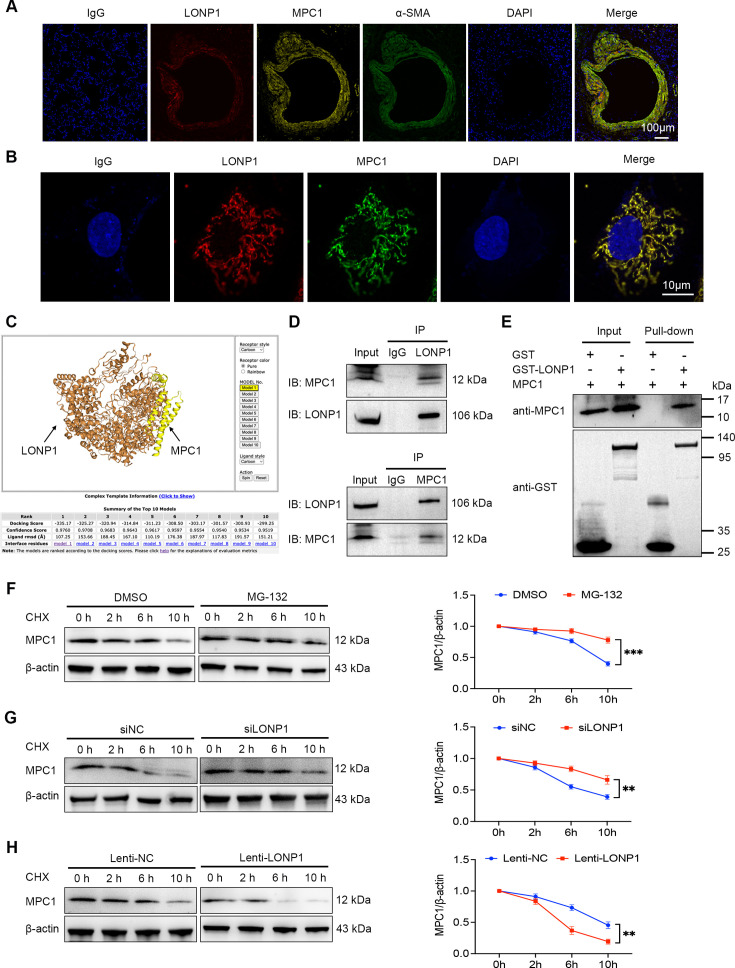
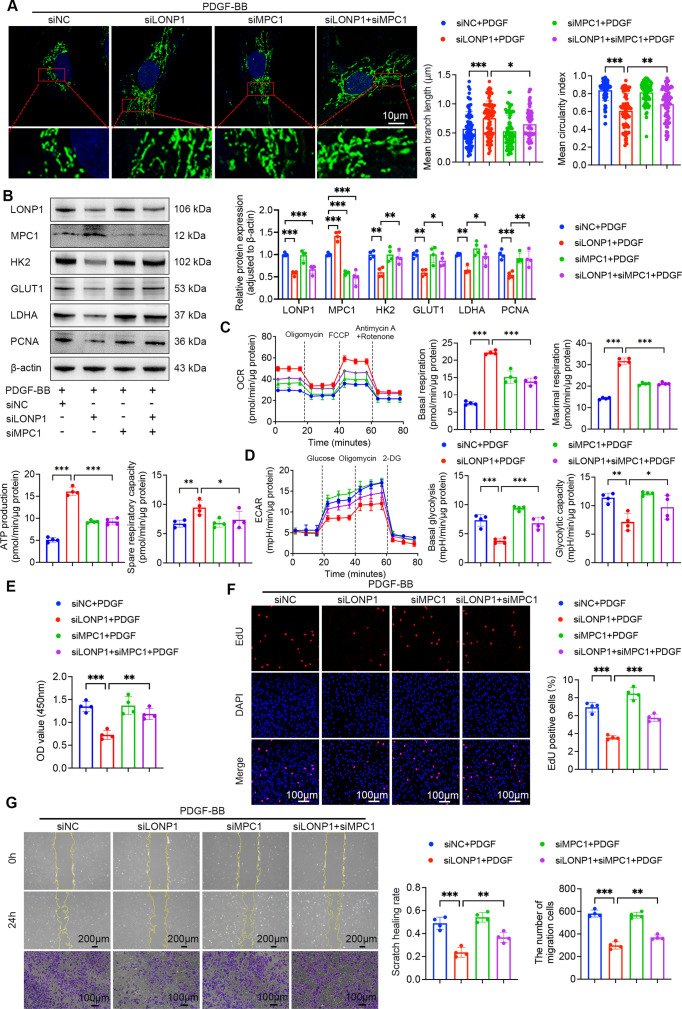
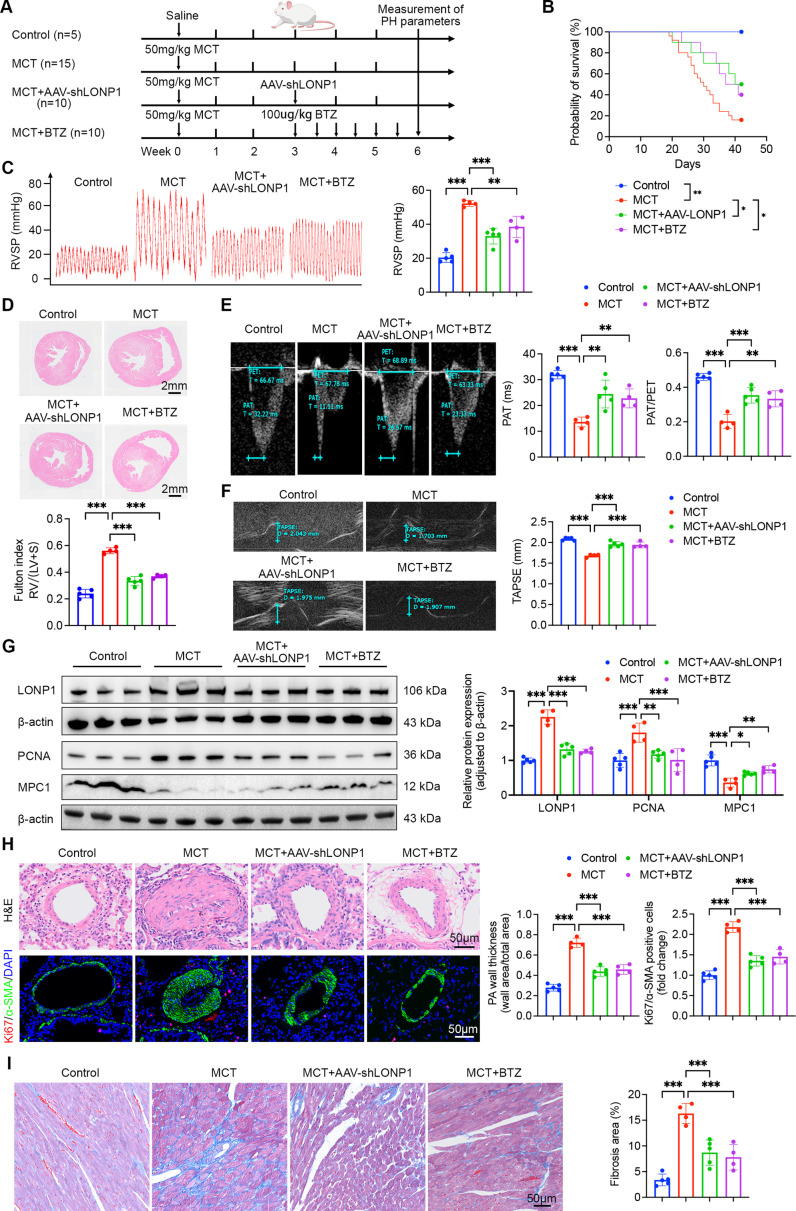
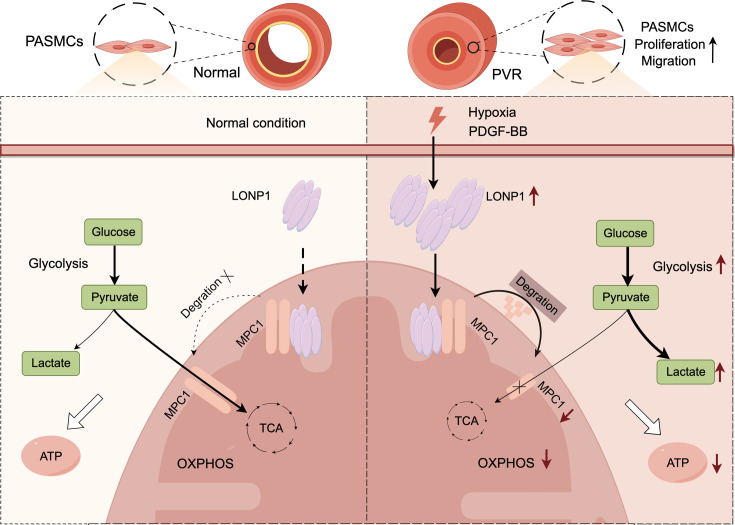
Pulmonary hypertension (PH) is a chronic and life-threatening disease characterized by pulmonary vascular remodeling (PVR), which involves the abnormal proliferation of pulmonary artery smooth muscle cells (PASMCs). These cells exhibit metabolic characteristics akin to cancer cells, particularly in their shift toward glycolysis. The Lon protease 1 (LONP1) has been shown to promote glycolytic reprogramming of tumor cells, conferring a malignant proliferative phenotype. However, the precise role of LONP1 in PH remains unclear. In the present study, Su5416/hypoxia-induced and monocrotaline (MCT)-induced PH rodent models and platelet-derived growth factor BB (PDGF-BB)-induced PASMCs were used to investigate the role and mechanism of LONP1 in PH. The results revealed an up-regulation of LONP1 expression in lung tissues from two PH rodent models, as well as in PDGF-BB-induced PASMCs. In vivo knockdown of LONP1 significantly alleviated PASMC mitochondrial dysfunction, reduced glycolytic enzyme expression, and decreased lactate accumulation, thereby mitigating PVR. Additionally, in vitro experiments demonstrated that knockdown or inhibition of LONP1 attenuated glycolytic reprogramming, proliferation, and migration of PASMCs, whereas overexpression of LONP1 had converse effects. Mechanistic studies confirmed that mitochondrial pyruvate carrier 1 (MPC1) was a direct substrate for LONP1-mediated degradation. Functional experiments with MPC1 knockdown and overexpression further elucidated its role in the proliferation and migration of PASMCs. Rescue experiments indicated that MPC1 knockdown abrogated the suppressive effects of LONP1 knockdown on glycolytic reprogramming, proliferation, and migration in PASMCs. Therapeutically, knockdown or pharmacological inhibition of LONP1 significantly reversed MCT-induced PH in rats. Thus, targeting LONP1 may represent a promising therapeutic strategy for PH.

Keywords: Lon protease 1; glycolytic reprogramming; mitochondrial pyruvate carrier 1; pulmonary hypertension; pulmonary vascular remodeling.


Conflict of interest statement

The authors declare that there are no competing interests associated with the manuscript.

Figures

Figure 1
Figure 1. Up-regulated expression of LONP1 in PH.
(A) qPCR analysis of LONP1 mRNA expression in lung tissue homogenates from control and SuHx-induced mice (n = 7). (B) Representative Western blot and quantitative analysis of LONP1 protein expression in lung tissue homogenates from control and SuHx-induced mice (n = 7). (C) Representative IF staining of LONP1 (red) and α-SMA (green) in lung sections from control and SuHx-induced mice, along with quantitative analysis (n = 7). Nuclei were stained with DAPI (blue). Scale bar = 200 µm and 50 µm. (D) Representative IHC staining of LONP1 in lung sections from control and SuHx-induced mice (n = 7). Scale bar = 50 µm. (E) qPCR analysis of LONP1 mRNA expression in pulmonary artery homogenates from control and MCT-induced rats (n = 5). (F) Representative Western blot and quantitative analysis of LONP1 protein expression in pulmonary artery homogenates from control and MCT-induced rats (n = 5). (G) Representative IF staining of LONP1 (red) and α-SMA (green) in lung sections from control and MCT-induced rats, along with quantitative analysis (n = 5). Nuclei were stained with DAPI (blue). Scale bar = 200 µm and 50 µm. (H) Representative IHC staining of LONP1 in lung sections from control and MCT-induced rats (n = 5). Scale bar = 50 µm. (I) qPCR analysis of LONP1 mRNA expression in PASMCs stimulated with 20 ng/ml PDGF-BB for 24 hours (n = 4). (J) Representative Western blot and quantitative analysis of LONP1 protein expression in PASMCs stimulated with 20 ng/ml PDGF-BB at the indicated time (n = 4). (K) Representative IF staining of LONP1 (red) in control and PDGF-BB-stimulated PASMCs. Nuclei were stained with DAPI (blue). Scale bar = 10 µm. (L) Representative IF staining of LONP1 (green) and MitoTracker (red) in PASMCs. Nuclei were stained with DAPI (blue). Scale bar = 10 µm. Data are presented as mean ± SD. Student’s t-test was used for comparisons between two groups, and one-way ANOVA with Bonferroni multiple comparisons test was used for comparisons among multiple groups. *P<0.05, **P<0.01, ***P<0.001. DAPI, 4’,6-diamidino-2-phenylindole; LONP1, Lon protease 1; PASMCs, pulmonary artery smooth muscle cells; PDGF-BB, platelet-derived growth factor BB; PH, pulmonary hypertension; qPCR, quantitative real-time polymerase chain reaction.
Figure 2
Figure 2. LONP1 knockdown prevents MCT-induced PH in rats.
(A) Schematic illustration of the experimental design aimed at investigating the preventive effects of LONP1 knockdown on PH. (B) Representative Western blot and quantitative analysis of LONP1 protein expression in pulmonary artery homogenates from the AAV-shNC, AAV-shLONP1, AAV-shNC + MCT, and AAV-shLONP1 + MCT groups (n = 6–8). (C) Representative tracings and quantitative analysis of RVSP in each group (n = 6–8). (D) Representative H&E staining of heart sections and Fulton index in each group (n = 6–8). The Fulton index was calculated as the ratio of RV weight to the sum of LV and S weights. Scale bar = 2 mm. (E and F) Representative echocardiographic images and quantitative analysis of PAT, PAT/PET ratio, and TAPSE in each group (n = 6–8). (G) Representative H&E staining, Ki67 (red) and α-SMA (green) IF staining of lung tissue, and quantitative analysis of pulmonary artery wall thickness and Ki67/α-SMA positive cells in each group (n = 6–8). Nuclei were stained with DAPI (blue). Pulmonary artery wall thickness was calculated as the ratio of (total vascular area minus luminal area) to total vascular area. Scale bar = 50 µm. (H) Representative Masson’s trichrome stain images and quantitative analysis of RV fibrosis in each group (n = 6–8). Scale bar = 50 µm. Data are presented as mean ± SD. Two-way ANOVA with Bonferroni multiple comparisons test was used for comparisons among multiple groups. *P<0.05, **P<0.01, ***P<0.001. AAV, adeno-associated virus; ANOVA, analysis of variance; DAPI, 4’,6-diamidino-2-phenylindole; LONP1, Lon protease 1; LV, left ventricle; MCT, monocrotaline; PAT, pulmonary artery acceleration time; PET, pulmonary artery ejection time; PH, pulmonary hypertension; RV, right ventricle; RVSP, RV systolic pressure; TAPSE, tricuspid annular plane systolic excursion.
Figure 3
Figure 3. LONP1 promotes the proliferation and migration of PASMCs.
(A) Representative Western blot and quantitative analysis of LONP1 and PCNA protein expression in PASMCs treated with siNC or siLONP1, with or without 20 ng/ml PDGF-BB stimulation for 24 hours (n = 4). (B) Cell viability was assessed by CCK-8 assay at 450 nm absorbance (n = 4). (C) Representative fluorescent images and quantitative analysis of EdU (red) incorporation into PASMCs (n = 4). Nuclei were stained with DAPI (blue). Scale bar = 100 µm. (D) Representative images and quantitative analysis of wound healing and Transwell assays assessing PASMC migration ability (n = 4). Scale bar = 200 µm for wound healing assay. Scale bar = 100 µm for Transwell assay. (E) Representative Western blot and quantitative analysis of PCNA protein expression in PASMCs treated with different concentrations of BTZ, with or without 20 ng/ml PDGF-BB stimulation for 24 hours (n = 4). (F) Representative Western blot and quantitative analysis of LONP1 and PCNA protein expression in PASMCs transfected with Lenti-NC or Lenti-LONP1 (n = 4). (G) Cell viability was assessed by CCK-8 assay at 450 nm absorbance (n = 4). (H) Representative fluorescent images and quantitative analysis of EdU (red) incorporation into PASMCs (n = 4). Nuclei were stained with DAPI (blue). Scale bar = 100 µm. (I) Representative images and quantitative analysis of wound healing and Transwell assays (n = 4). Scale bar = 200 µm for wound healing assay. Scale bar = 100 µm for Transwell assay. Data are presented as mean ± SD. Student’s t-test was used for comparisons between two groups, and two-way ANOVA with Bonferroni multiple comparisons test was used for comparisons among multiple groups. *P<0.05, **P<0.01, ***P<0.001. DAPI, 4’,6-diamidino-2-phenylindole; LONP1, Lon protease 1; PASMCs, pulmonary artery smooth muscle cells; PCNA, proliferating cell nuclear antigen.
Figure 4
Figure 4. LONP1 facilitates glycolytic reprogramming.
(A) Representative TEM images of mitochondria in PASMCs from pulmonary arteries in each group, along with quantitative analysis (n = 6–8, 20 PASMCs/independent experiment). Dense body and dense patch are specific structures of smooth muscle cells. Dense body, dense patch, and damaged mitochondria are indicated with purple, dark blue, and red arrows, respectively. Scale bar = 1 μm and 500 nm. (B) Representative IF staining of MitoTracker (green) in PASMCs from the siNC, siLONP1, siNC+PDGF-BB, and siLONP1 + PDGF-BB groups, along with quantitative analysis (n = 4, 20 PASMCs/independent experiment). Nuclei were stained with Hoechst 33,342 (blue). Scale bar = 10 µm. (C) Representative Western blot and quantitative analysis of HK2, GLUT1, and LDHA protein expression in pulmonary artery homogenates from each group (n = 6–8). (D) Serum lactate levels from each group (n = 6–8). (E) Representative Western blot and quantitative analysis of HK2, GLUT1, and LDHA protein expression in PASMCs from each group (n = 4). (F) Lactate levels in the supernatants of PASMC cultures from each group (n = 4). (G) Real-time monitoring of the OCR in PASMCs with the indicated treatments, along with quantitative analysis (n = 4). (H) Real-time monitoring of the ECAR in PASMCs with the indicated treatments, along with quantitative analysis (n = 4). Data are presented as mean ± SD. Two-way ANOVA with Bonferroni multiple comparisons test was used for comparisons among multiple groups. *P<0.05, **P<0.01, ***P<0.001. LONP1, Lon protease 1; PASMCs, pulmonary artery smooth muscle cells; TEM, transmission electron microscopy.
Figure 5
Figure 5. MPC1 is a potential downstream target of LONP1 and regulates PASMC phenotype.
(A) Representative Western blot and quantitative analysis of MPC1 and MPC2 protein expression in PASMCs treated with PDGF-BB and transfected with either siNC or siLONP1 (n = 4). (B) Representative Western blot and quantitative analysis of MPC1 and MPC2 protein expression in PASMCs transfected with either Lenti-NC or Lenti-LONP1 (n = 4). (C) Representative Western blot and quantitative analysis of MPC1, LONP1, HK2, GLUT1, LDHA, and PCNA protein expression in PASMCs treated with PDGF-BB and transfected with either OE-NC or OE-MPC1 plasmids (n = 4). (D) Representative fluorescent images and quantitative analysis of EdU (red) incorporation into PASMCs (n = 4). Nuclei were stained with DAPI (blue). Scale bar = 100 µm. (E) Representative images and quantitative analysis of wound healing and Transwell assays (n = 4). Scale bar = 200 µm for wound healing assay. Scale bar = 100 µm for Transwell assay. (F) Representative Western blot and quantitative analysis of MPC1, LONP1, HK2, GLUT1, LDHA, and PCNA protein expression in PASMCs transfected with either siNC or siMPC1 (n = 4). (G) Representative fluorescent images and quantitative analysis of EdU (red) incorporation into PASMCs (n = 4). Nuclei were stained with DAPI (blue). Scale bar = 100 µm. (H) Representative images and quantitative analysis of wound healing and Transwell assays (n = 4). Scale bar = 200 µm for wound healing assay. Scale bar = 100 µm for Transwell assay. Data are presented as mean ± SD. Student’s t-test was used for comparisons between two groups. *P<0.05, **P<0.01, ***P<0.001. DAPI, 4’,6-diamidino-2-phenylindole; GLUT1, glucose transporter-1; LDHA, lactate dehydrogenase A; LONP1, Lon protease 1; MPC1, mitochondrial pyruvate carrier 1; PASMCs, pulmonary artery smooth muscle cells; PCNA, proliferating cell nuclear antigen.
Figure 6
Figure 6. MPC1 functions as a degradation substrate for LONP1.
(A) Representative IF staining of LONP1 (red), MPC1 (yellow), and α-SMA (green) in rat lung sections. IgG was used for negative control staining. Nuclei were stained with DAPI (blue). Scale bar = 100 µm. (B) Representative IF staining of LONP1 (red) and MPC1 (green) in PASMCs. IgG was used for negative control staining. Nuclei were stained with DAPI (blue). Scale bar = 10 µm. (C) Simulated docking of LONP1 and MPC1 protein molecules using the protein-protein interaction prediction software HADDOCK. (D) Co-IP using either LONP1 or MPC1 antibodies confirmed the interaction between LONP1 and MPC1 in PASMCs (n = 4). (E) GST pull-down was conducted to detect the direct interaction between LONP1 and MPC1 (n = 4). Purified GST or GST-LONP1 was mixed with PASMC lysates, followed by precipitation using glutathione magnetic beads. (F-H) Representative Western blot and quantitative analysis of MPC1 protein expression in PASMCs (n = 4). PASMCs were treated with CHX (25 µg/ml) for 0, 2, 6, and 10 hours after intervention with MG-132 (5 μM) (F), transfection with siNC or siLONP1 (G), or transfection with Lenti-NC or Lenti-LONP1 (H). Cell samples were collected and lysed for Western blot to detect MPC1 expression. Data are presented as mean ± SD. Student’s t-test was used for comparisons between two groups. *P<0.05, **P<0.01, ***P<0.001. DAPI, 4’,6-diamidino-2-phenylindole; GLUT1, glucose transporter-1; LDHA, lactate dehydrogenase A; LONP1, Lon protease 1; MPC1, mitochondrial pyruvate carrier 1; PASMCs, pulmonary artery smooth muscle cells; PCNA, proliferating cell nuclear antigen.
Figure 7
Figure 7. MPC1 knockdown abrogates the suppressive effects of LONP1 knockdown on glycolytic reprogramming, proliferation, and migration in PASMCs.
(A) Representative IF and quantitative analysis of mitochondria stained with MitoTracker (green) in PASMCs (n = 4). Nuclei were stained with Hoechst 33,342 (blue). Scale bar = 10 µm. (B) Representative Western blot and quantitative analysis of LONP1, MPC1, HK2, GLUT1, LDHA, and PCNA protein expression in PASMCs (n = 4). (C) Real-time monitoring of the OCR in PASMCs with the indicated treatments, along with quantitative analysis (n = 4). (D) Real-time monitoring of the ECAR in PASMCs with the indicated treatments, along with quantitative analysis (n = 4). (E) Cell viability was assessed by CCK-8 assay at 450 nm absorbance (n = 4). (F) Representative fluorescent images and quantitative analysis of EdU (red) incorporation in PASMCs (n = 4). Nuclei were stained with DAPI (blue). Scale bar = 100 µm. (G) Representative images and quantitative analysis of wound healing and Transwell assays in PASMCs (n = 4). Scale bar = 200 µm for wound healing assay. Scale bar = 100 µm for Transwell assay. Data are presented as mean ± SD. One-way ANOVA with Bonferroni multiple comparisons test was used for comparisons among multiple groups. *P<0.05, **P<0.01, ***P<0.001. LONP1, Lon protease 1; MPC1, mitochondrial pyruvate carrier 1; PASMCs, pulmonary artery smooth muscle cells.
Figure 8
Figure 8. Knockdown or pharmacological inhibition of LONP1 reverses MCT-induced PH in rats.
(A) Schematic illustration of the experimental design aimed at investigating the therapeutic effects of LONP1 knockdown or pharmacological inhibition on PH. (B) Kaplan–Meier survival curves for rats in the control, MCT, MCT + AAV-shLONP1, and MCT + BTZ groups (n = 5–15). (C) Representative tracings and quantitative analysis of RVSP in each group (n = 4–5). (D) Representative H&E staining of heart sections and Fulton index in each group (n = 4–5). The Fulton index was calculated as the ratio of RV weight to the sum of LV and S weights. Scale bar = 2 mm. (E and F) Representative echocardiographic images and quantitative analysis of PAT, PAT/PET ratio, and TAPSE in each group (n = 4–5). (G) Representative Western blot and quantitative analysis of LONP1, PCNA, and MPC1 protein expression in pulmonary artery homogenates from each group (n = 4–5). (H) Representative H&E staining, Ki67 (red) and α-SMA (green) IF staining of lung tissue, and quantitative analysis of pulmonary artery wall thickness and Ki67/α-SMA positive cells in each group (n = 4–5). Nuclei were stained with DAPI (blue). Pulmonary artery wall thickness was calculated as the ratio of (total vascular area minus luminal area) to total vascular area. Scale bar = 50 µm. (I) Representative Masson’s trichrome stain images and quantitative analysis of RV fibrosis in each group (n = 4–5). Scale bar = 50 µm. Data are presented as mean ± SD. Log-rank test and one-way ANOVA with Bonferroni multiple comparisons test were used for comparisons among multiple groups. *P<0.05, **P<0.01, ***P<0.001. AAV, adeno-associated virus; H&E hematoxylin and eosin; LONP1, Lon protease 1; MCT, monocrotaline; PCNA, proliferating cell nuclear antigen; PH, pulmonary hypertension.
Figure 9
Figure 9. The schematic diagram illustrates the regulatory mechanism of LONP1 in PH.
Pathogenic factors promote the up-regulation of LONP1 expression, causing LONP1 to directly interact with and degrade MPC1. This leads to the inability of pyruvate in the cytoplasm to enter mitochondria for subsequent OXPHOS, resulting in more pyruvate being directed toward the glycolysis pathway to produce lactate. This glycolytic reprogramming promotes the proliferation and migration of PASMCs, ultimately contributing to PVR. The image was created by Figdraw.com. LONP1, Lon protease 1; MPC1, mitochondrial pyruvate carrier 1; OXPHOS, oxidative phosphorylation; PASMCs, pulmonary artery smooth muscle cells; PH, pulmonary hypertension; PVR, pulmonary vascular remodeling.

Similar articles

References

    1. Ruopp N.F., Cockrill B.A. Diagnosis and treatment of pulmonary arterial hypertension: a review. JAMA. 2022;327:1379–1391. doi: 10.1001/jama.2022.4402. - DOI - PubMed
    1. Hassoun P.M. Pulmonary arterial hypertension. N. Engl. J. Med. 2021;385:2361–2376. doi: 10.1056/NEJMra2000348. - DOI - PubMed
    1. Thenappan T., Ormiston M.L., Ryan J.J., Archer S.L. Pulmonary arterial hypertension: pathogenesis and clinical management. BMJ. 2018;360:j5492. doi: 10.1136/bmj.j5492. - DOI - PMC - PubMed
    1. GBD 2021 Pulmonary Arterial Hypertension Collaborators Global, regional, and national burden of pulmonary arterial hypertension, 1990-2021: a systematic analysis for the Global Burden of Disease Study 2021. Lancet Respir. Med. 2025;13:69–79. doi: 10.1016/S2213-2600(24)00295-9. - DOI - PMC - PubMed
    1. Xu W., Janocha A.J., Erzurum S.C. Metabolism in pulmonary hpertension. Annu. Rev. Physiol. 2021;83:551–576. doi: 10.1146/annurev-physiol-031620-123956. - DOI - PMC - PubMed

MeSH terms