. 2025 Apr 11;26(8):3604.
doi: 10.3390/ijms26083604.

Mutagenesis of Intrinsically Disordered Domain Impacts Topoisomerase IIα Catalytic Activity

Affiliations

Mutagenesis of Intrinsically Disordered Domain Impacts Topoisomerase IIα Catalytic Activity

Jeong Won Chang et al. Int J Mol Sci. .

Abstract

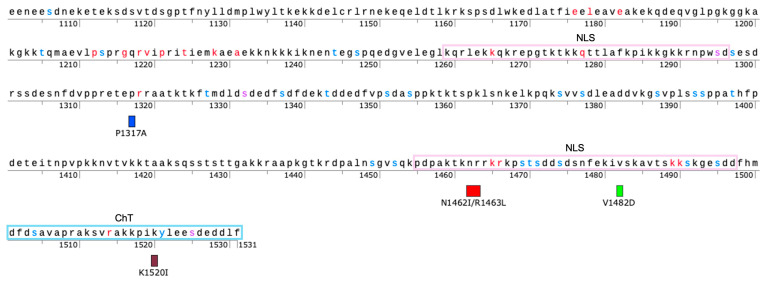
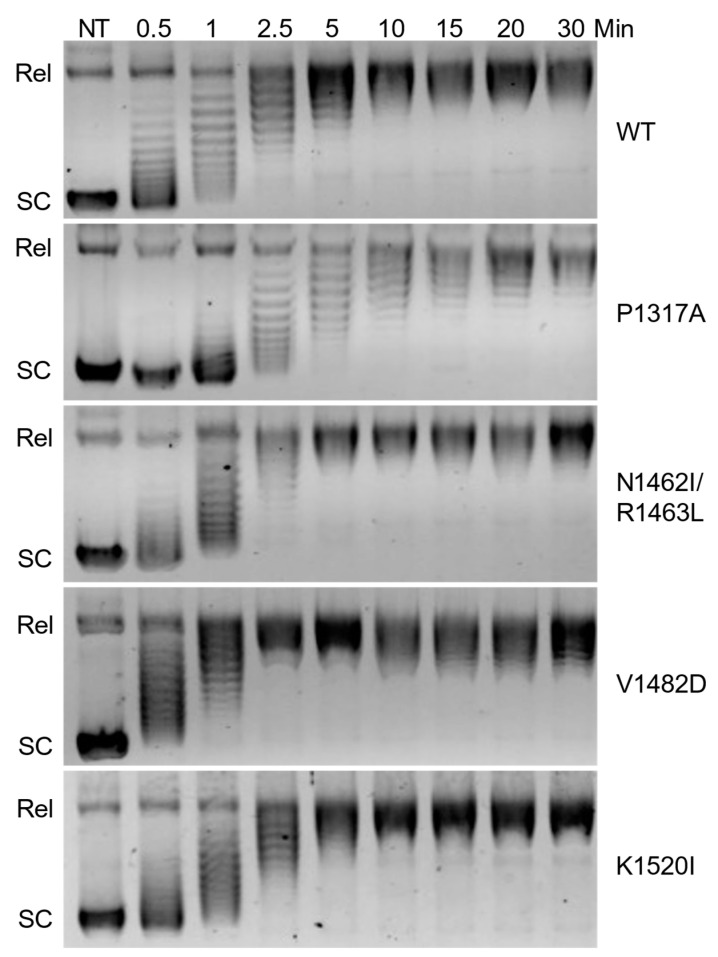
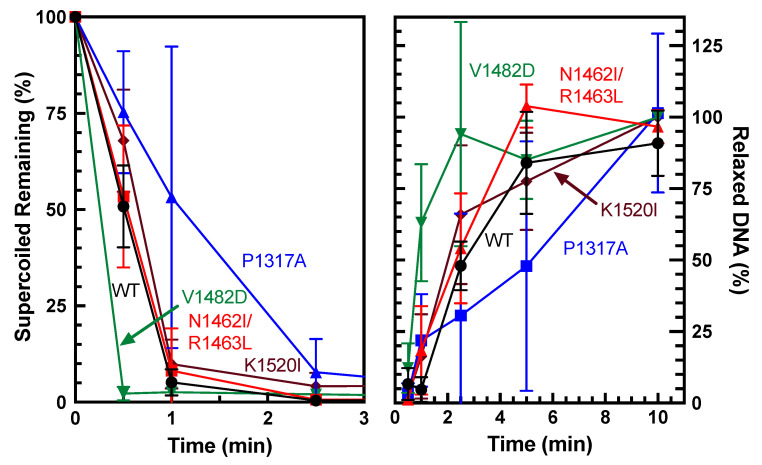
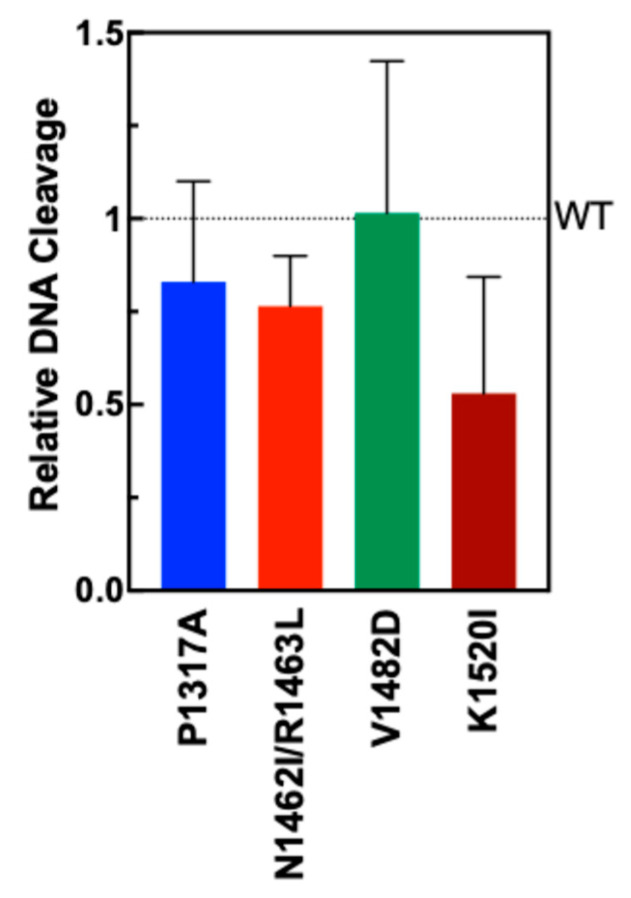
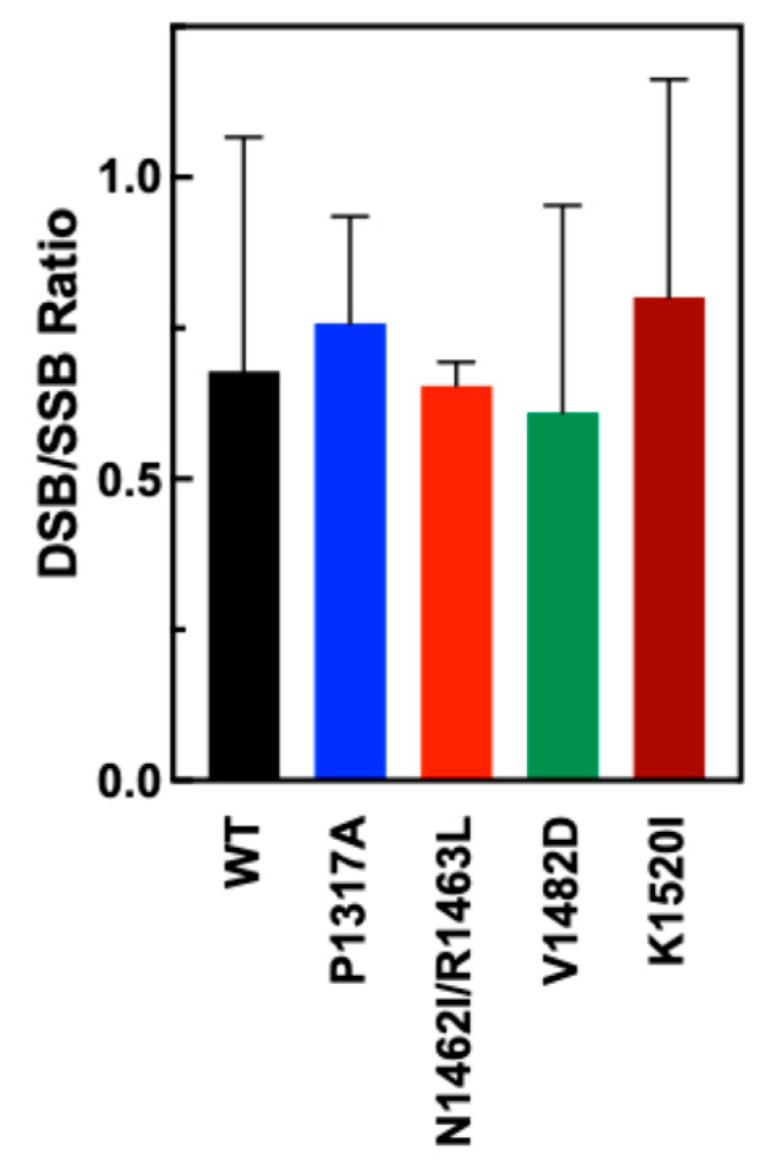
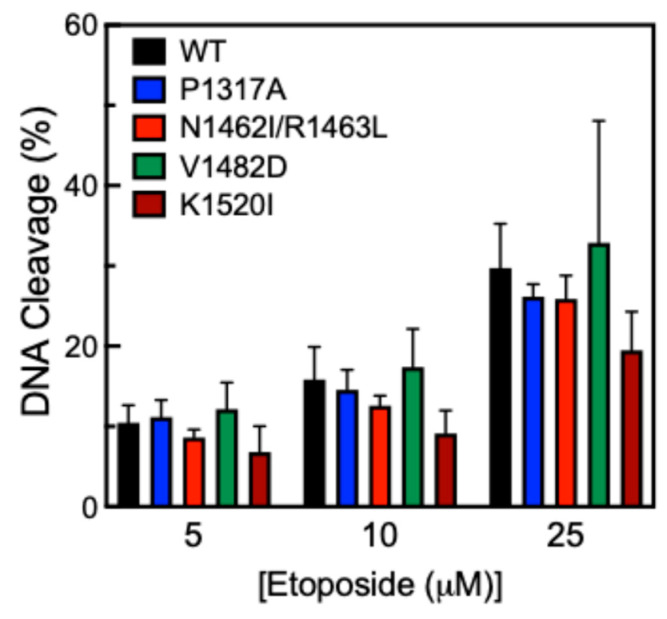
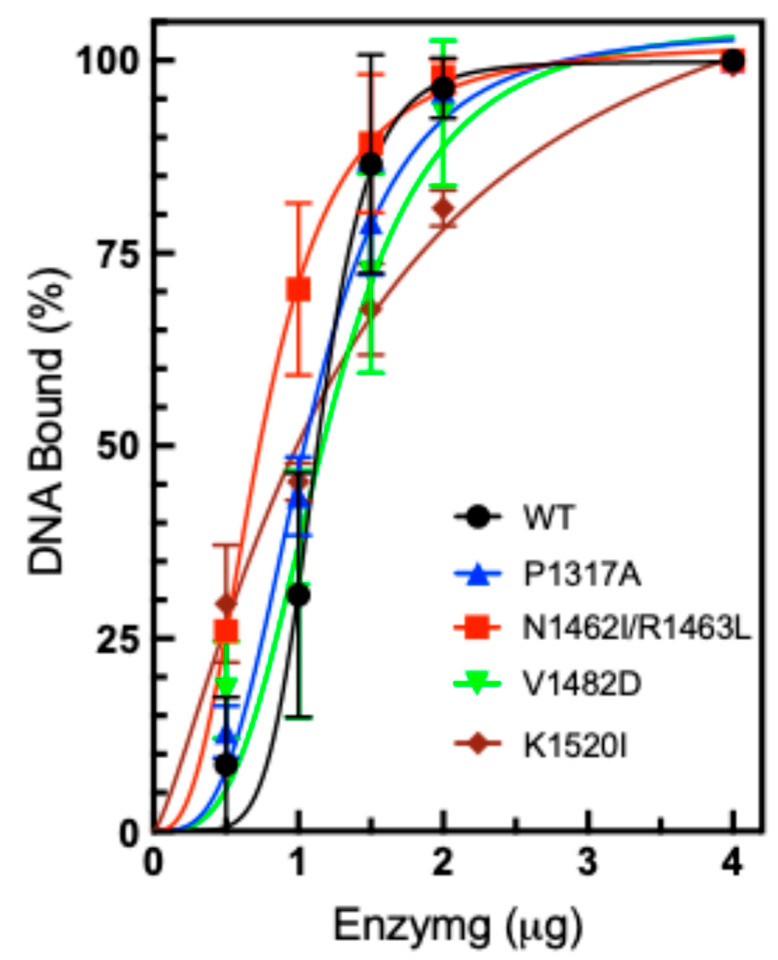
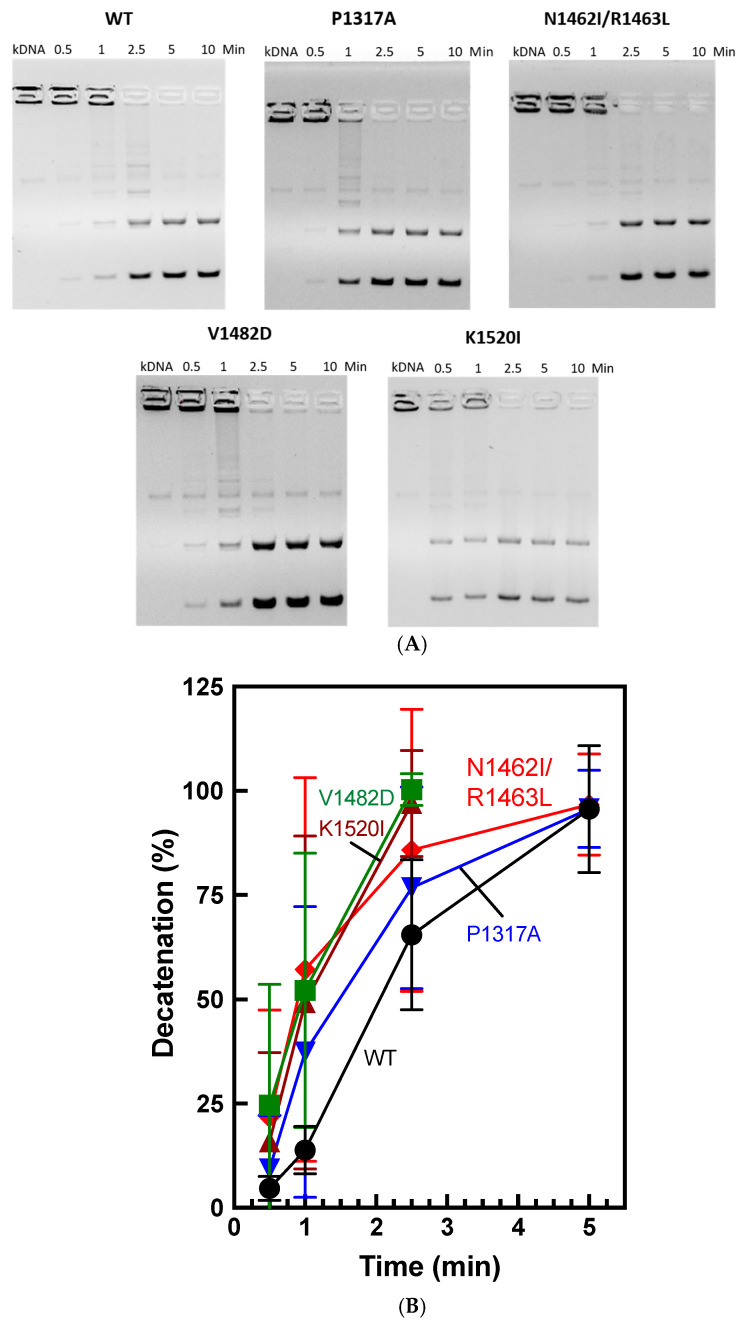
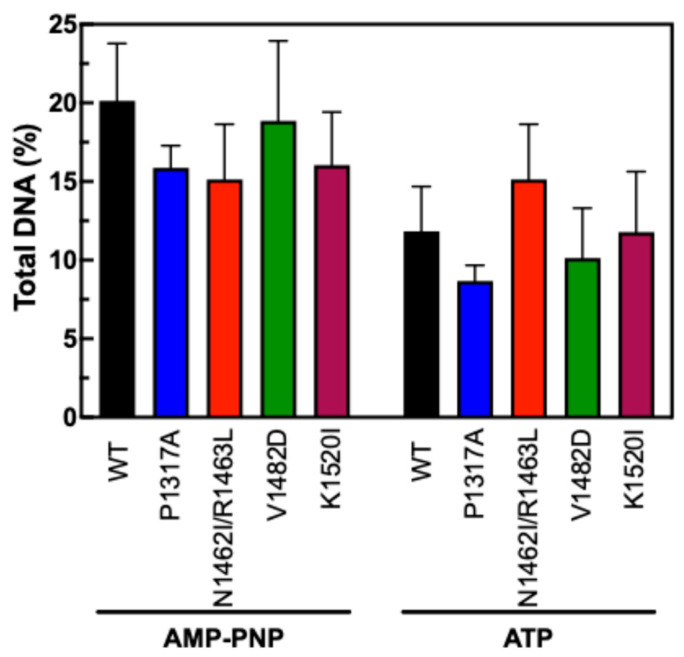
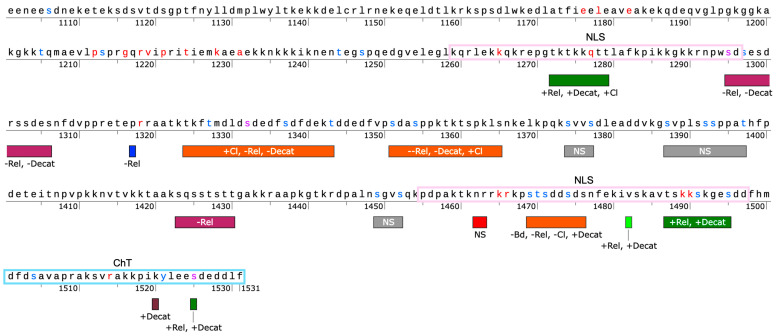
Human topoisomerase IIα and IIβ regulate DNA topology and knots in chromosomes during crucial cellular processes, making these enzymes common targets for anticancer drugs. However, selective inhibition of topoisomerase IIα (TOP2A) is desired to decrease adverse effects, which may be mediated by topoisomerase IIβ (TOP2B). The main region of difference between the two isoforms is the intrinsically disordered C-terminal domain (CTD), which is being studied as a target for selective inhibition. Our previous work examined several regions within the CTD to determine whether those regions impact biochemical function. In this current study, we designed and constructed four TOP2A mutants with amino acid substitutions in the CTD, which were then assessed for impact on biochemical activity. V1482D exhibited increased levels of relaxation, while both V1482D and K1520I exhibited increased levels of decatenation. No major impact on DNA cleavage or binding were observed with any of the mutants. The isolated impact of the changes on relaxation and decatenation supports the concept that the CTD can affect one aspect of the enzyme's function in an isolated manner, which was seen in our previous study. Taken together, these results suggest that modification of specific positions within the CTD affects substrate selection. These results are mapped onto the CTD for consideration of potential regions to target for inhibition of TOP2A.

Keywords: DNA; PSICalc; TOP2A; carboxy-terminal domain; cleavage; decatenation; intrinsically disordered domain; protein disorder; relaxation; topoisomerase IIα.


Conflict of interest statement

The authors declare no conflicts of interest.

Figures

Figure 1
Figure 1
Map of CTD Region of TOP2A with key features and mutant sites. Mutants are denoted by a box as P1317A (blue), N1462I/R1463L (red), V1482D (green), and K1520I (maroon). Nuclear localization signals (NLS, purple box) and Chromatin Tether (ChT, teal box) are denoted. Residues in red represent positions that are invariant among TOP2A [31], blue sites are known to be phosphorylated in association with mitosis [29,48], and purple represents sites that are both invariant and are known to be modified.
Figure 2
Figure 2
Relaxation time course of DNA by wild-type TOP2A (WT) and mutant TOP2A (P1317A, N1462I/R1463L, V1482D, and K1520I). Representative gel images show the migration of supercoiled plasmid in the absence of TOP2A (NT) as well as in the presence of TOP2A at increasing time points (0.5–30 min). The relaxed plasmid (Rel) migrates more slowly than supercoiled (SC) plasmid. Gel images are representative of three or more experiments.
Figure 3
Figure 3
Quantification of plasmid DNA relaxation by WT TOP2A and TOP2A mutants P1317A, N1462I/R1463L, V1482D, and K1520I. Relaxation was quantified both as a percentage of supercoiled remaining (left) and gain of relaxed DNA (right). Error bars represent the standard deviation of at least three experiments.
Figure 4
Figure 4
Plasmid DNA cleavage by WT TOP2A and TOP2A mutants P1317A, N1462I/R1463L, V1482D, and K1520I. Quantification represents the linearized plasmid in the gel (double-strand breaks). Error bars represent the standard deviation from four experiments.
Figure 5
Figure 5
Ratio of double-strand breaks (linear) and single-strand breaks (nicked) in DNA when cleaved by WT and mutant TOP2A. DSB/SSB ratios were created by quantifying double-stranded breaks compared to single-strand breaks. A higher DSB/SSB ratio indicates increased coordination of the enzyme. Error bars show the standard deviation of at least four experiments.
Figure 6
Figure 6
Etoposide titration cleavage of pHOT1 DNA by WT TOP2A and TOP2A mutants P1317A, N1462I/R1463L, V1482D, and K1520I. Etoposide concentration is represented in µM. Error bars indicate the standard deviation of at least four experiments.
Figure 7
Figure 7
Plasmid DNA binding by TOP2A. Plasmid DNA was incubated in the presence of increasing concentrations of purified WT or mutant TOP2A, P1317A, N1462I/R1463L, V1482D, and K1520I (0.5–4 µg). Results are shown as a percentage of SC DNA remaining unshifted by binding to TOP2A. Error bars represent the standard deviation of three experiments.
Figure 8
Figure 8
Decatenation of kinetoplast DNA (kDNA) using WT and mutant TOP2A. (A) Gel images show catenated (cat) kDNA in the absence of TOP2A (NT) as well as catenated kDNA as it is being decatenated (decat) at time points ranging from 0.5–10 min. Decatenation activity is shown for WT and mutants P1317A, N1462I/R1463L, V1482D, and K1520I. Gels are representative of four or more independent experiments. (B) Quantification of decatenated kDNA (lowest two bands) from 0.5–5 min. Error bars represent standard deviation of at least four experiments.
Figure 9
Figure 9
N-Terminal ATPase clamp stabilization. Results show the level of DNA bound to TOP2A enzymes following salt washes in the presence of AMP-PNP or ATP. Error bars represent the standard deviation of four experiments.
Figure 10
Figure 10
Map of TOP2A CTD mutation effects. The map above shows the region from amino acid 1100–1531 of TOP2A. Mutants from the current study are shown in blue (P1317A), red (N1462I/R1463L), bright green (V1482D), and maroon (K1520I). Mutants from a previous CTD study [30] are also mapped as regions in green (increased activity), purple (decreased activity), orange (mixed effects), or gray (no significant effects, NS). Activities are abbreviated as follows: + = increased activity, - = decreased activity, -- = strongly decreased activity; Rel = relaxation; Decat = decatenation; Cl = DNA cleavage; Bd = DNA binding; NS = no significant effects. Other features denoted include the Nuclear Localization Sequences (NLS, light purple box) and the Chromatin Tether Domain (ChT, teal box). Residues in red represent positions that are invariant among TOP2A [31], blue sites are known to be phosphorylated in association with mitosis [29,48], and purple represents sites that are both invariant and are known to be modified.

Similar articles

References

    1. Iakoucheva L.M., Radivojac P., Brown C.J., O’Connor T.R., Sikes J.G., Obradovic Z., Dunker A.K. The importance of intrinsic disorder for protein phosphorylation. Nucleic Acids Res. 2004;32:1037–1049. doi: 10.1093/nar/gkh253. - DOI - PMC - PubMed
    1. Dyson H.J., Wright P.E. Intrinsically unstructured proteins and their functions. Nat. Rev. Mol. Cell Biol. 2005;6:197–208. doi: 10.1038/nrm1589. - DOI - PubMed
    1. van der Lee R., Buljan M., Lang B., Weatheritt R.J., Daughdrill G.W., Dunker A.K., Fuxreiter M., Gough J., Gsponer J., Jones D.T., et al. Classification of intrinsically disordered regions and proteins. Chem. Rev. 2014;114:6589–6631. doi: 10.1021/cr400525m. - DOI - PMC - PubMed
    1. Biesaga M., Frigolé-Vivas M., Salvatella X. Intrinsically disordered proteins and biomolecular condensates as drug targets. Curr. Opin. Chem. Biol. 2021;62:90–100. doi: 10.1016/j.cbpa.2021.02.009. - DOI - PMC - PubMed
    1. Holehouse A.S., Kragelund B.B. The molecular basis for cellular function of intrinsically disordered protein regions. Nat. Rev. Mol. Cell Biol. 2024;25:187–211. doi: 10.1038/s41580-023-00673-0. - DOI - PMC - PubMed

MeSH terms

LinkOut - more resources