. 2025 Apr 13;26(8):3677.
doi: 10.3390/ijms26083677.

Paeoniflorin Directly Targets ENO1 to Inhibit M1 Polarization of Microglia/Macrophages and Ameliorates EAE Disease

Affiliations

Paeoniflorin Directly Targets ENO1 to Inhibit M1 Polarization of Microglia/Macrophages and Ameliorates EAE Disease

Ying Sun et al. Int J Mol Sci. .

Abstract

The chronic autoimmune disease multiple sclerosis (MS) now remains incurable. Paeoniflorin (PF), which is a monoterpene glucoside obtained from Paeonia lactiflora Pall, is recognized for neuroprotective and anti-inflammatory properties. However, the precise mechanism by which PF regulates MS is unclear. This work aims to elucidate the underlying mechanisms of PF in EAE, a well established animal model of MS, and to discover the target proteins that PF directly acts on. Our results revealed that PF administration can significantly attenuate the clinical symptoms of EAE and alleviate the central nervous system (CNS) inflammatory environment by inhibiting M1-type microglia/macrophages. Mechanistically, PF was found to directly interact with the glycolytic enzyme α-enolase (ENO1), inhibiting its enzymatic activity and expression to impair glucose metabolism, thereby suppressing microglia/macrophage M1 polarization and ameliorating CNS inflammation. Significantly, Eno1 knockdown in microglia/macrophages diminished their pro-inflammatory phenotype, while treatment with ENOBlock or the specific knockout of Eno1 in microglia led to EAE remission, underscoring the critical role of ENO1 in EAE progression. This study uncovers the molecular mechanism of PF in treating EAE, linking the anti-inflammatory property of PF to the glucose metabolism process, which will broaden the prospective applications of PF.

Keywords: EAE; ENO1; glucose metabolism; microglia/macrophage polarization; paeoniflorin.


Conflict of interest statement

The authors declare no conflict of interest.

Figures

Figure 1
Figure 1
PF administration alleviates clinical symptoms, CNS inflammation, and demyelination in EAE mice. (A) Schematic diagram of MOG-induced EAE and PF administration. (B,C) Clinical scores (B) and body weights (C) of wild-type control mice (n = 3), vehicle PBS-treated EAE mice and PF-treated EAE mice (100 mg/kg, 150 mg/kg, 200 mg/kg) (n = 6), PF and PBS treatment initiated from day 0 post immunization. (D) Representative H&E staining and LFB staining of lumbar spinal cords obtained from wild-type control mice (n = 3) and EAE mice treated with PBS or PF on day 16 post immunization (n = 4) (scale bar: 50 μm), red arrows indicate immune cell infiltration and yellow arrows indicate demyelination. (E) Quantitative pathology scores for inflammation (H&E) and demyelination (LFB). Data are presented as mean ± SEM. * p < 0.05, ** p < 0.01, *** p < 0.001; ns, no significance.
Figure 2
Figure 2
PF inhibits the M1-type polarization of microglia/macrophages in vitro. (AC) The CNS mononuclear cells were isolated from EAE mice treated with PBS or PF (150 mg/kg) on day 16 post immunization (n = 3). (A) Heatmap of the representative up- and downregulated mRNA of CNS mononuclear cells. (B) Volcano diagram of the top upregulated and downregulated genes and (C) representative GSEA plot (compared to EAE-PBS group) from RNA-seq analysis. (DH) BMDMs and BV2 cells were treated with PF in M1 polarization condition (LPS 100 ng/mL) or M2 polarization condition (IL-4 20 ng/mL) for 24 h. The percentages of CD86+ M1 BMDMs (D) were analyzed by flow cytometry (n = 3). The mRNA levels of Il-6 and Il-1β in M1 BMDMs (E) or M1 BV2 cells (G), and Arg-1 and Tgf-β in M2 BMDMs (F) or M2 BV2 cells (H) were analyzed by qPCR (n = 3). (I,J) CXCL10 and CCL2 secretion in supernatants of M1-polarized BMDMs (I) and BV2 cells (J) with or without PF treatment for 24 h, measured by ELISA (n = 3). Data are expressed as the mean ± SEM. * p < 0.05, ** p < 0.01, *** p < 0.001, **** p < 0.0001; ns, no significance.
Figure 3
Figure 3
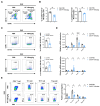
PF reduces the percentages of M1 microglia/macrophages and pathogenic T cells in the CNS of EAE mice. The CNS mononuclear cells were isolated from the EAE-PBS and EAE-PF group mice on day 16 post immunization. (A,B) Flow cytometry analysis of CD45int CD11b+ microglia cells and CD45high CD11b+ macrophages in CNS from the two group mice (n = 4). (C) Flow cytometry analysis of CD86+ or CD206+ cells in CD11b+ cells from the two group mice (n = 4). (D) The mRNA expression levels of cytokines and chemokines in CNS mononuclear cells from the two group mice were determined by qPCR (n = 4). (E) The percentage of CD4+ T cells and T-helper cells such as Th1, Th17, and Treg cells in the CNS were analyzed by flow cytometry (n = 4). Data are expressed as the mean ± SEM. * p < 0.05, ** p < 0.01, **** p < 0.0001; ns, no significance.
Figure 4
Figure 4
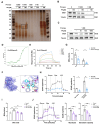
PF targets ENO1 and reduces enzyme activity as well as glycolysis status. (A) DARTS assay and silver staining were performed to detect changed protein bands upon PF incubation in Pronase digested BV2 cell lysates. The changed protein bands (black-boxed) were processed for mass spectrometry. (B,C) PF-ENO1 binding was validated by DARTS and WB. (D) Binding of PF to ENO1 was determined with MST assay. (E) SPR assay tested the binding affinity of PF to ENO1. (F) Molecular docking results of ENO1 with PF. The model image was generated by PyMOL version 2.5.0 (Schrödinger, LLC, New York, NY, USA). ENO1 was shown as a slate cartoon, PF as a cyan stick, and binding site residues as magenta sticks. Hydrogen bonds were depicted with yellow dashed lines. (G) CD11b+ cells were isolated from CNS mononuclear cells or spleen cells in PBS-EAE or PF-EAE mice on day 16 after immunization. Enolase enzyme activity was monitored by the Enolase Activity Assay Kit (n = 4). (H) CD11b+ cells were isolated from CNS mononuclear cells in PBS-EAE or PF-EAE mice on day 16 after immunization. Glycolysis status of isolated CD11b+ cells were monitored by ECAR assay. (I,J) The enolase enzyme activity of BV2 cells was analyzed by the Enolase Activity Assay Kit (I) and the glycolysis status were monitored by ECAR assay (J) (n = 4). Data are presented as the mean ± SEM. * p < 0.05, ** p < 0.01, *** p < 0.001. **** p < 0.0001; ns, no significance.
Figure 5
Figure 5
PF inhibits ENO1 expression in M1 microglia/macrophages accompanied by decreased IL-1β expression. (A,B) CD11b+ cells were isolated from spleen cells of wild-type mice, EAE-PBS and EAE-PF (150 mg/kg) group mice. ENO1 protein expression levels were analyzed through western blot (n = 3). (C,D) CD11b+ cells were isolated from CNS mononuclear cells in EAE-PBS and EAE-PF (150 mg/kg) group mice on day 16 post immunization. The expression levels of ENO1 protein were detected by western blot (n = 3). (E,F) The mRNA expression of Eno1 in LPS-stimulated BMDMs (E) and BV2 cells (F) after PF treatment were analyzed by qPCR (n = 4). (G) Protein localization of ENO1 in LPS-stimulated BMDMs were detected by immunofluorescence (scale bar: 25 μm). (HK) RAW 264.7 cells were transfected with si-NC or si-Eno1 and control plasmid or Eno1 overexpression (OE) plasmid for 48 h, then the cells were collected after stimulation by LPS and PF treatment for 24 h. ENO1 protein expression levels were analyzed through western blot (H,J), and the mRNA expression levels of IL-1β were analyzed by qPCR (I,K). Data are presented as the mean ± SEM. * p < 0.05, ** p < 0.01, *** p < 0.001, **** p < 0.0001.
Figure 6
Figure 6
ENOBlock treatment or specific knockout of Eno1 in microglia inhibits M1 polarization and alleviates EAE progression. (A,B) BMDMs were treated with ENOBlock (20 μM) in M1 polarization condition (LPS 100 ng/mL) for 24 h (n = 3). The percentage of CD86+ M1 BMDMs was analyzed by flow cytometry (A), and the mRNA expression of Il-6 and Il-1β in M1 BMDMs was analyzed by qPCR (B). (C) The clinical score of MOG-induced EAE mice treated with DMSO vehicle or ENOBlock (5 mg/kg) intraperitoneally from day 5 post immunization (n = 6). (D) Flow cytometry analysis of CNS mononuclear cells isolated from DMSO vehicle and ENOBlock-treated mice on day 16 post immunization. Representative data and percentages of CD86+ or CD206+ cells in CD11b+ cells in CNS from the two group mice (n = 6). (E) The clinical score of MOG-induced Eno1fl/fl and Eno1 fl/fl Cx3cr1-Cre EAE mice (n = 6). (F) CNS mononuclear cells isolated from Eno1fl/fl and Eno1fl/fl Cx3cr1-Cre EAE group mice on day 16 post immunization were analyzed by flow cytometry. Representative data and percentages of CD86+ or CD206+ cells in CNS from the two group mice (n = 6). Data are presented as the mean ± SEM. * p < 0.05, ** p < 0.01, **** p < 0.0001; ns, no significance.

Similar articles

References

    1. Wallin M.T., Culpepper W.J., Nichols E., Bhutta Z.A., Gebrehiwot T.T., Hay S.I., Khalil I.A., Krohn K.J., Liang X., Naghavi M., et al. Global, regional, and national burden of multiple sclerosis 1990-2016: A systematic analysis for the Global Burden of Disease Study 2016. Lancet Neurol. 2019;18:269–285. doi: 10.1016/S1474-4422(18)30443-5. - DOI - PMC - PubMed
    1. Konen F.F., Mohn N., Witte T., Schefzyk M., Wiestler M., Lovric S., Hufendiek K., Schwenkenbecher P., Suhs K.W., Friese M.A., et al. Treatment of autoimmunity: The impact of disease-modifying therapies in multiple sclerosis and comorbid autoimmune disorders. Autoimmun. Rev. 2023;22:103312. doi: 10.1016/j.autrev.2023.103312. - DOI - PubMed
    1. Harding K., Williams O., Willis M., Hrastelj J., Rimmer A., Joseph F., Tomassini V., Wardle M., Pickersgill T., Robertson N., et al. Clinical Outcomes of Escalation vs Early Intensive Disease-Modifying Therapy in Patients with Multiple Sclerosis. JAMA Neurol. 2019;76:536–541. doi: 10.1001/jamaneurol.2018.4905. - DOI - PMC - PubMed
    1. Palace J., Duddy M., Bregenzer T., Lawton M., Zhu F., Boggild M., Piske B., Robertson N.P., Oger J., Tremlett H., et al. Effectiveness and cost-effectiveness of interferon beta and glatiramer acetate in the UK Multiple Sclerosis Risk Sharing Scheme at 6 years: A clinical cohort study with natural history comparator. Lancet Neurol. 2015;14:497–505. doi: 10.1016/S1474-4422(15)00018-6. - DOI - PubMed
    1. Van Kaer L., Postoak J.L., Wang C., Yang G., Wu L. Innate, innate-like and adaptive lymphocytes in the pathogenesis of MS and EAE. Cell Mol. Immunol. 2019;16:531–539. doi: 10.1038/s41423-019-0221-5. - DOI - PMC - PubMed

MeSH terms

LinkOut - more resources