. 2025 Apr 14;26(8):3695.
doi: 10.3390/ijms26083695.

NPC86 Increases LncRNA Gas5 In Vivo to Improve Insulin Sensitivity and Metabolic Function in Diet-Induced Obese Diabetic Mouse Model

Affiliations

NPC86 Increases LncRNA Gas5 In Vivo to Improve Insulin Sensitivity and Metabolic Function in Diet-Induced Obese Diabetic Mouse Model

Anna Kharitonova et al. Int J Mol Sci. .

Abstract

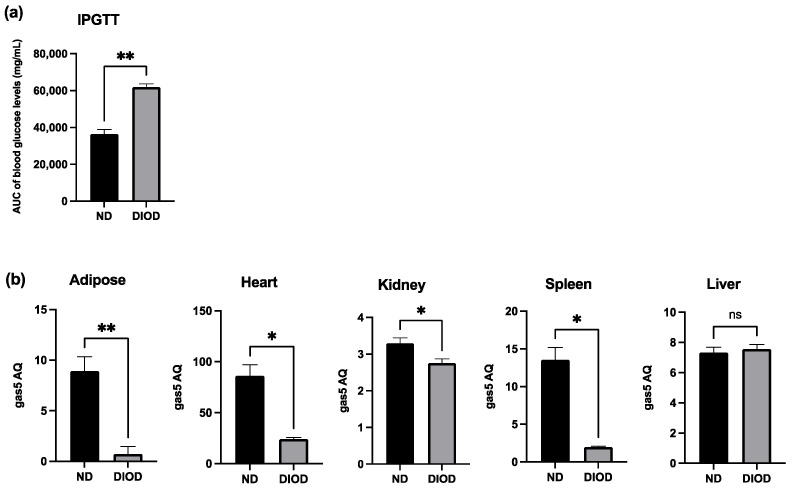
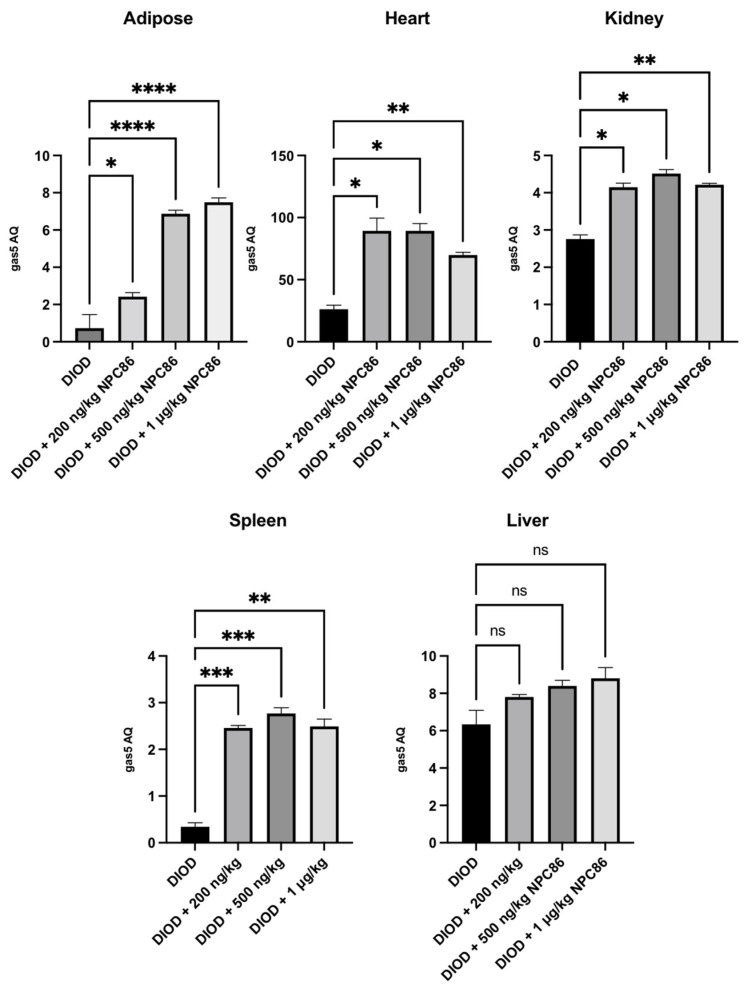
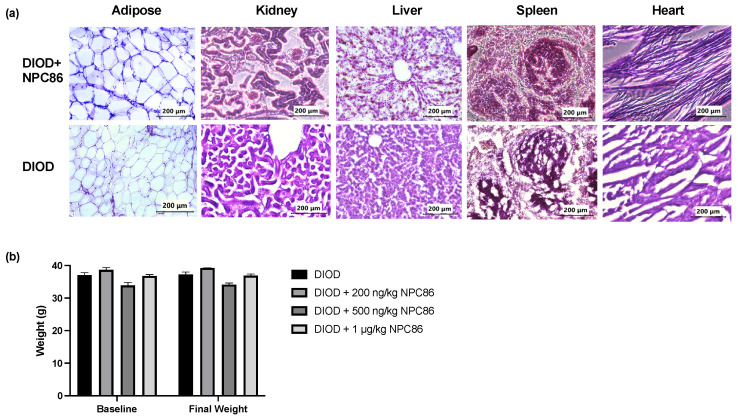
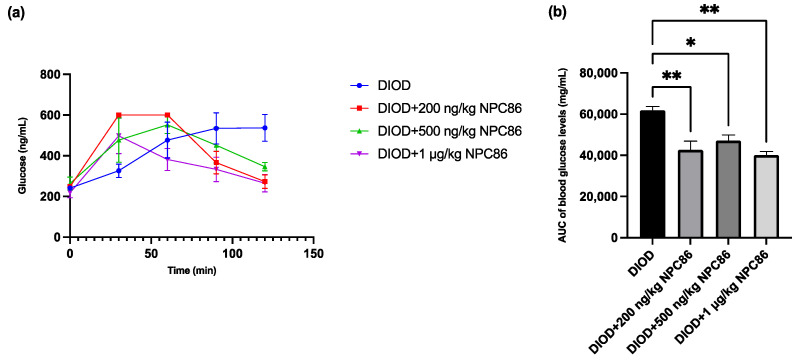
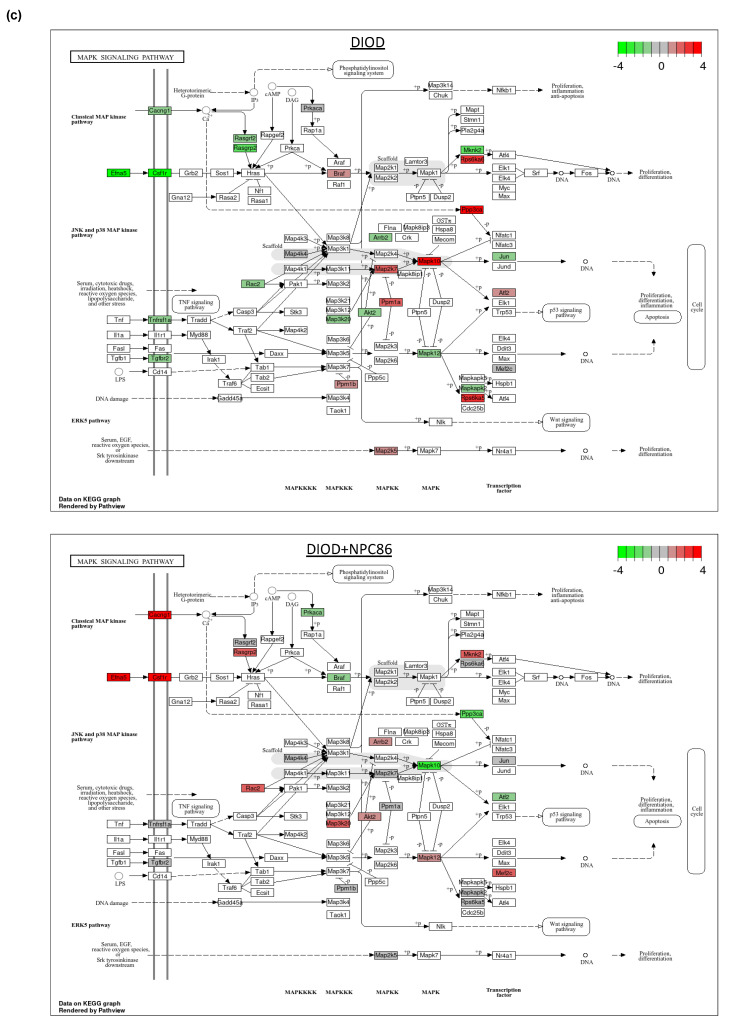
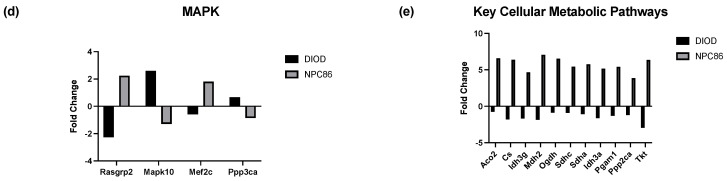
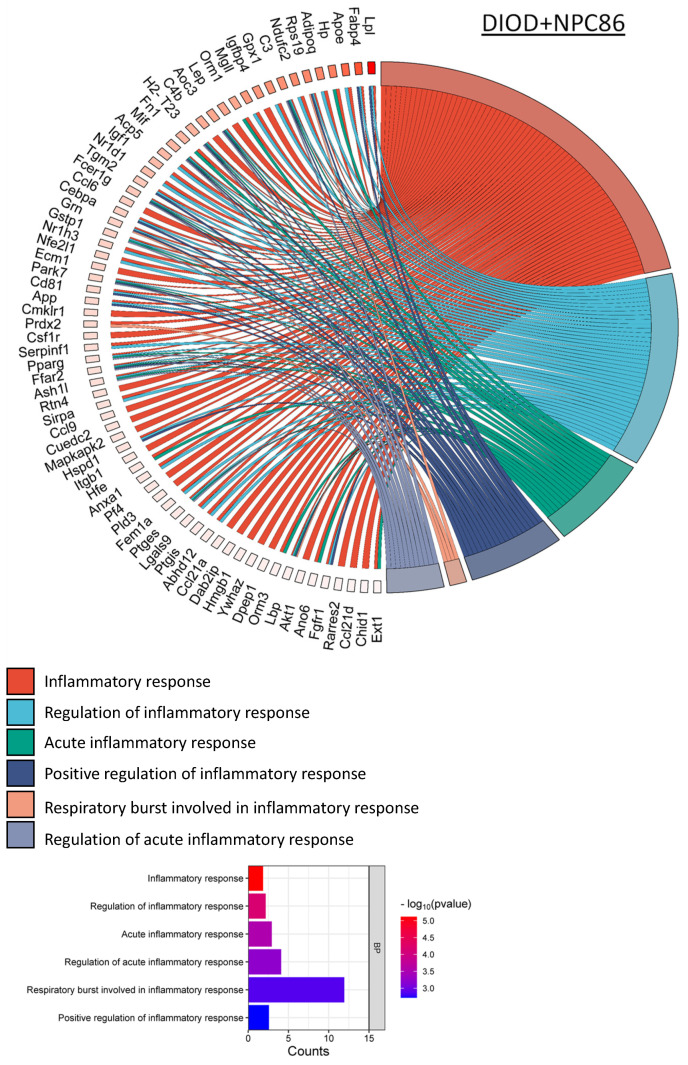
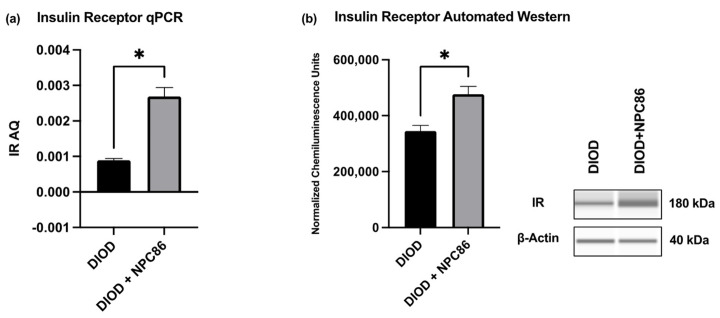
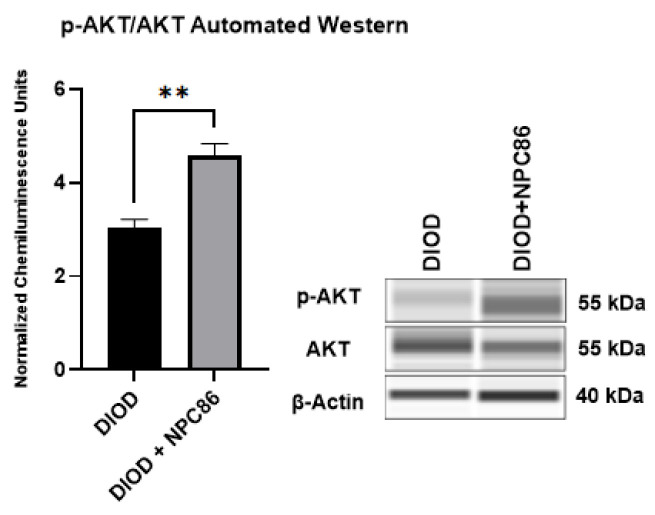
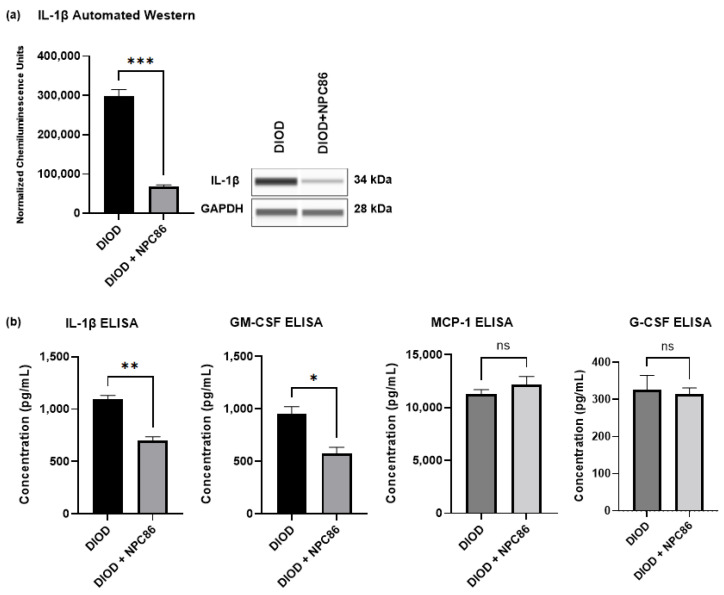
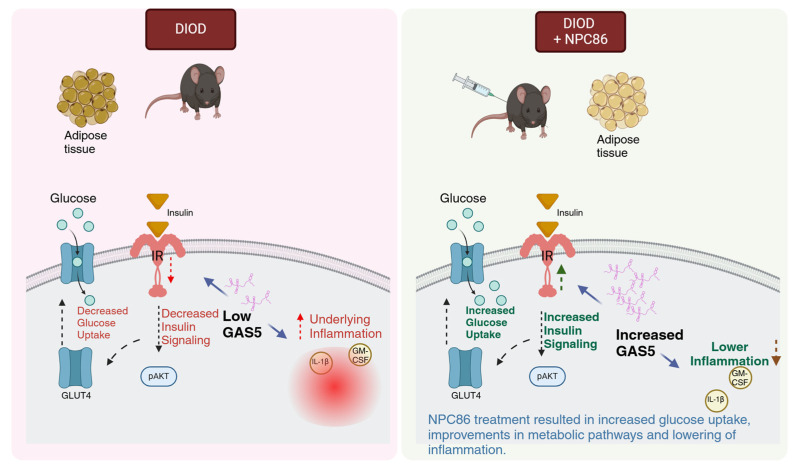
In the United States, an estimated 38 million individuals (10% of the population) have type 2 diabetes mellitus (T2D), while approximately 97.6 million adults (38%) have prediabetes. Long noncoding RNAs (lncRNAs) are critical regulators of gene expression and metabolism. We were the first to demonstrate that lncRNA Growth Arrest-Specific Transcript 5 (GAS5 (human)/gas5 (mouse)) is decreased in the serum of T2D patients and established GAS5 as a biomarker for T2D diagnosis and onset prediction, now validated by other groups. We further demonstrated that GAS5 depletion impaired glucose uptake, decreased insulin receptor levels, and inhibited insulin signaling in human adipocytes, highlighting its potential as a therapeutic target in T2D. To address this, we developed NPC86, a small-molecule compound that stabilizes GAS5 by disrupting its interaction with UPF-1, an RNA helicase involved in nonsense-mediated decay (NMD) that regulates RNA stability. NPC86 increased GAS5 and insulin receptor (IR) levels, enhanced insulin signaling, and improved glucose uptake in vitro. In this study, we tested the efficacy of NPC86 in vivo in a diet-induced obese diabetic (DIOD) mouse model, and NPC86 treatment elevated gas5 levels, improved glucose tolerance, and enhanced insulin sensitivity, with no observed toxicity or weight changes. A transcriptomics analysis of adipose tissue revealed the upregulation of insulin signaling and metabolic pathways, including oxidative phosphorylation and glycolysis, while inflammatory pathways were downregulated. These findings highlight NPC86's therapeutic potential in T2D.

Keywords: NPC86; RNA sequencing (RNAseq); diet-induced obese diabetic (DIOD); gas5; glucose metabolism; inflammation and insulin signaling; insulin resistance; long noncoding RNA (lncRNA); metabolic pathways; type 2 diabetes mellitus (T2D).


Conflict of interest statement

The authors declare no conflicts of interest regarding this manuscript. The patents are not yet licensed, and the authors have no financial conflicts of interest.

Figures

Figure 1
Figure 1
DIOD impairs glucose tolerance and downregulates gas5 expression in multiple tissues. (a) Intraperitoneal Glucose Tolerance Test (IPGTT) in ND and DIOD C57BL/6J mice after an 8 h fast followed by intraperitoneal glucose injection (2 g/kg body weight). The area under the curve (AUC) was calculated to quantify glucose exposure over time using the trapezoidal rule, following the formula: AUC (mmol/L*min) = 1/2 × (BG 0 min + BG 30 min) × 30 min + 1/2 × (BG 30 min + BG 60 min) × 30 min + 1/2 × (BG 60 min + BG 90 min) × 30 + 1/2 × (BG 90 min + BG 120 min) × 30 min, where BG represents blood glucose values at each respective time point. A statistical analysis was performed in GraphPad Prism using an unpaired t-test. The data are presented as mean ± SEM; n = 3 per group; ** p < 0.01. (b) Total RNA was extracted from the adipose tissue of the ND and DIOD mice (n = 3 per group). Real-time qPCR was performed in triplicate using SYBR Green to measure the absolute quantification of gas5 expression and normalized to GAPDH. A statistical analysis was performed in GraphPad Prism using unpaired t-test. The data are presented as mean ± SEM; n = 3 per group; * p < 0.05, ** p < 0.01; ns = not significant.
Figure 2
Figure 2
Total RNA was extracted from the kidney, spleen, heart, adipose, and liver tissues of DIOD and DIOD + NPC86 (200 ng/kg, 500 ng/kg, or 1 μg/kg) mice. Real-time qPCR was performed in triplicate using SYBR Green to measure the absolute quantification of gas5 expression and normalized to GAPDH. A statistical analysis was performed using a one-way ANOVA in GraphPad Prism. The data are presented as mean ± SEM; n = 3 per group; * p < 0.05, ** p < 0.01, *** p < 0.001 **** p < 0.0001; ns = not significant.
Figure 3
Figure 3
NPC86 treatment shows no signs of toxicity and does not alter body weight. (a) Representative hematoxylin and eosin (H&E)-stained sections of adipose, kidney, liver, spleen, and heart tissues from DIOD mice (bottom row) and NPC86-treated (500 ng/kg b.w.) DIOD mice (top row). (b) Body weight was measured at baseline and following a 5-day treatment regime with NPC86 treatment (200 ng/kg, 500 ng/kg, and 1 µg/kg) in DIOD mice. A statistical analysis was performed in GraphPad Prism using paired t-test. The data are presented as mean ± SEM; n = 3 per group.
Figure 4
Figure 4
NPC86 improves glucose clearance in DIOD mice. (a) Blood glucose levels were measured during an intraperitoneal glucose tolerance test (IPGTT) following an 8 h fasting period. The mice received an intraperitoneal injection of D-glucose (2 g/kg body weight), and blood glucose levels were recorded at 0, 30, 60, 90, and 120 min post-injection. Data are presented as mean ± SEM (n = 3 per group). (b) The area under the curve (AUC) was calculated to quantify glucose exposure over time using the trapezoidal rule, following the formula: AUC (mmol/L*min) = 1/2 × (BG 0 min + BG 30 min) × 30 min + 1/2 × (BG 30 min + BG 60 min) × 30 min + 1/2 × (BG 60 min + BG 90 min) × 30 + 1/2 × (BG 90 min + BG 120 min) × 30 min, where BG represents blood glucose values at each respective time point. Statistical comparisons between groups were performed using one-way ANOVA, n = 3 per group. Statistical significance is indicated as * p < 0.05 and ** p < 0.01.
Figure 5
Figure 5
Distance heatmap, hierarchical clustering, differential gene expression, and pathway enrichment analysis of RNAseq data. (a) Distance heatmap showing the correlation of samples within their respective groups. The color scale ranges from blue (low correlation) to red (high correlation), with hierarchical clustering applied to group samples with similar transcriptomic signatures. (b) Hierarchical clustering heatmap of differentially expressed genes across experimental conditions. Rows represent genes, and columns represent individual samples. The expression values are Z-score-normalized, with red indicating upregulation and yellow indicating downregulation. The clustering demonstrates that the NPC86-treated (500 ng/kg b.w. and 1 μg/kg b.w.) DIOD mice exhibit a gene expression profile distinct from that of the untreated DIOD mice and more closely aligned with that of the ND controls, suggesting that NPC86 treatment reprograms the transcriptome toward a metabolically healthier state. (c) Venn diagram illustrating the overlap of differentially expressed genes (DEGs) among the experimental groups. The analysis shows that 1006 genes were downregulated in the DIOD mice compared to in the ND controls, while NPC86 treatment (500 ng/kg b.w. and 1 μg/kg b.w.) upregulated 517 genes, indicating a partial reversal of DIOD-associated transcriptional changes. Additionally, 555 genes that were upregulated in the DIOD mice compared to the ND controls were significantly downregulated following NPC86 treatment. A total of 534 genes overlapped between the groups, representing core transcriptional changes induced by NPC86 to promote metabolic balance. (d) Pathway enrichment heatmap displaying differentially regulated metabolic, inflammatory, and signaling pathways across experimental groups. The color scale represents log-transformed false discovery rate (FDR) −adjusted p-values, indicating pathway significance. Key metabolic pathways such as insulin signaling, AMPK signaling, and the biosynthesis of amino acids were enriched, suggesting that NPC86 plays a role in restoring metabolic homeostasis in DIOD mice.
Figure 6
Figure 6
Impact of NPC86 on insulin signaling and inflammatory pathways in adipose tissue. (a) KEGG pathway diagrams illustrating changes in the insulin signaling pathway in the DIOD (top) and DIOD + NPC86 (500 ng/kg b.w. and 1 μg/kg b.w.; bottom) groups. The color gradient represents log2 fold changes in gene expression, with red indicating upregulation and green indicating downregulation. (b) Bar plot illustrating fold-change values of differentially expressed genes (DEGs) involved in insulin signaling (DIOD vs. DIOD + NPC86 (500 ng/kg b.w. and 1 μg/kg b.w.) mice). The x-axis represents the log2 fold-change in gene expression between the DIOD and NPC86-treated mice. Positive values indicate genes that are upregulated following NPC86 treatment, whereas negative values represent genes that are downregulated. (c) KEGG pathway analysis of the MAPK signaling pathway in DIOD (left) and NPC86-treated (500 ng/kg b.w. and 1 μg/kg b.w.; right) mice. Colored boxes indicate log2 fold-change values, with red representing upregulation and green representing downregulation of gene expression. (d) Bar plot showing fold-change values of genes involved in the MAPK signaling pathway between DIOD and DIOD + NPC86 mice (500 ng/kg b.w. and 1 μg/kg b.w.). Positive values indicate upregulation, while negative values indicate downregulation following NPC86 treatment, highlighting its regulatory effects on MAPK-related gene expression. (e) Bar plot showing the number of upregulated and downregulated genes involved in key cellular metabolic pathways in DIOD vs. DIOD + NPC86-treated mice (500 ng/kg b.w. and 1 μg/kg b.w.). The x-axis represents the number of differentially expressed genes (DEGs), while the bars indicate whether genes were upregulated or downregulated following NPC86 treatment.
Figure 6
Figure 6
Impact of NPC86 on insulin signaling and inflammatory pathways in adipose tissue. (a) KEGG pathway diagrams illustrating changes in the insulin signaling pathway in the DIOD (top) and DIOD + NPC86 (500 ng/kg b.w. and 1 μg/kg b.w.; bottom) groups. The color gradient represents log2 fold changes in gene expression, with red indicating upregulation and green indicating downregulation. (b) Bar plot illustrating fold-change values of differentially expressed genes (DEGs) involved in insulin signaling (DIOD vs. DIOD + NPC86 (500 ng/kg b.w. and 1 μg/kg b.w.) mice). The x-axis represents the log2 fold-change in gene expression between the DIOD and NPC86-treated mice. Positive values indicate genes that are upregulated following NPC86 treatment, whereas negative values represent genes that are downregulated. (c) KEGG pathway analysis of the MAPK signaling pathway in DIOD (left) and NPC86-treated (500 ng/kg b.w. and 1 μg/kg b.w.; right) mice. Colored boxes indicate log2 fold-change values, with red representing upregulation and green representing downregulation of gene expression. (d) Bar plot showing fold-change values of genes involved in the MAPK signaling pathway between DIOD and DIOD + NPC86 mice (500 ng/kg b.w. and 1 μg/kg b.w.). Positive values indicate upregulation, while negative values indicate downregulation following NPC86 treatment, highlighting its regulatory effects on MAPK-related gene expression. (e) Bar plot showing the number of upregulated and downregulated genes involved in key cellular metabolic pathways in DIOD vs. DIOD + NPC86-treated mice (500 ng/kg b.w. and 1 μg/kg b.w.). The x-axis represents the number of differentially expressed genes (DEGs), while the bars indicate whether genes were upregulated or downregulated following NPC86 treatment.
Figure 7
Figure 7
NPC86 modulates inflammatory gene networks in adipose tissue. Chord diagrams depict gene-pathway interactions related to inflammatory responses in DIOD (left) and NPC86-treated (right) mice. Each arc represents a gene associated with a specific inflammatory pathway, color-coded according to its pathway classification. Compared to the DIOD mice, the NPC86-treated mice exhibit a pronounced downregulation of genes involved in acute inflammation, respiratory burst, and immune activation. The pathway enrichment analysis highlights the significant repression of key inflammatory pathways, including cytokine signaling and stress-response pathways, in the NPC86-treated mice. The bar plot illustrates the enrichment of inflammatory response-related pathways. The x-axis represents the number of DEGs associated with each pathway, while the color gradient represents the statistical significance (−log10(p-value)). NPC86 treatment significantly downregulated pathways related to inflammation, including acute inflammatory response and positive regulation of inflammatory response, supporting its role in mitigating inflammation-associated dysregulation.
Figure 7
Figure 7
NPC86 modulates inflammatory gene networks in adipose tissue. Chord diagrams depict gene-pathway interactions related to inflammatory responses in DIOD (left) and NPC86-treated (right) mice. Each arc represents a gene associated with a specific inflammatory pathway, color-coded according to its pathway classification. Compared to the DIOD mice, the NPC86-treated mice exhibit a pronounced downregulation of genes involved in acute inflammation, respiratory burst, and immune activation. The pathway enrichment analysis highlights the significant repression of key inflammatory pathways, including cytokine signaling and stress-response pathways, in the NPC86-treated mice. The bar plot illustrates the enrichment of inflammatory response-related pathways. The x-axis represents the number of DEGs associated with each pathway, while the color gradient represents the statistical significance (−log10(p-value)). NPC86 treatment significantly downregulated pathways related to inflammation, including acute inflammatory response and positive regulation of inflammatory response, supporting its role in mitigating inflammation-associated dysregulation.
Figure 8
Figure 8
NPC86 enhances insulin receptor expression in DIOD mice. (a) Total RNA was extracted from the adipose tissue of DIOD and DIOD + NPC86 mice (200 ng/kg b.w.). Real-time qPCR was performed in triplicate using SYBR Green to measure the absolute quantification of IR expression and normalized to GAPDH. A statistical analysis was performed in GraphPad Prism using an unpaired t-test (n = 3 per group). The data are presented as mean ± SEM; * p < 0.05. (b) An automated Western blot analysis using JESS was performed on adipose tissue from DIOD and DIOD + NPC86 (200 ng/kg b.w.) mice using antibodies against IR and β-actin. Representative blots and the quantification of chemiluminescence units are shown. A statistical analysis was performed in GraphPad Prism using an unpaired t-test (n = 3 per group). The data are presented as mean ± SEM, with statistical significance indicated as * p < 0.05.
Figure 9
Figure 9
NPC86 treatment increases pAKT/AKT in DIOD mice. An automated Western blot analysis using JESS was performed on adipose tissue from DIOD and DIOD + NPC86 mice using antibodies against p-AKT (Ser473), total AKT (1/2/3), and β-actin. The phosphorylated AKT to total AKT (p-AKT/AKT) ratio is significantly elevated following NPC86 treatment (1 μg/kg b.w.). Representative blots and quantification are provided. A statistical analysis was performed in GraphPad Prism using an unpaired t-test (n = 3 per group). The data are presented as mean ± SEM, with statistical significance indicated as ** p < 0.01.
Figure 10
Figure 10
NPC86 reduces IL-1β protein levels. (a) An automated Western blot analysis using JESS was performed on adipose tissue from DIOD and DIOD + NPC86 (500 ng/kg b.w.) mice using antibodies against IL-1β and GAPDH. Representative blots and quantification are displayed. A statistical analysis was performed in GraphPad Prism using an unpaired t-test (n = 3 per group). The data are presented as mean ± SEM, with statistical significance indicated as *** p < 0.001. (b) The serum concentrations of IL-1β, GM-CSF, G-CSF, and MCP-1 were measured by ELISA in DIOD and DIOD + NPC86 (500 ng/kg and 1 μg/kg b.w.) mice. A statistical analysis was performed in GraphPad Prism using an unpaired t-test (n = 3 per group). The data are presented as mean ± SEM, with statistical significance indicated as * p < 0.05, ** p < 0.01.
Figure 11
Figure 11
Schematic illustrating how increased GAS5 levels enhance insulin signaling and glucose uptake while concurrently reducing inflammatory responses, created in BioRender. Patel, N. (2025). Reprinted with permission from Patel, N (2025). Copyright 2025, Patel, N.

Similar articles

References

    1. Stratton I.M., Adler A.I., Neil H.A.W., Matthews D.R., Manley S.E., Cull C.A., Hadden D., Turner R.C., Holman R.R. Association of glycaemia with macrovascular and microvascular complications of type 2 diabetes (UKPDS 35): Prospective observational study. BMJ. 2000;321:405–412. doi: 10.1136/bmj.321.7258.405. - DOI - PMC - PubMed
    1. CDC A Report Card: Diabetes in the United States Infographic, Diabetes. [(accessed on 29 January 2025)];2024 Available online: https://www.cdc.gov/diabetes/communication-resources/diabetes-statistics....
    1. Centers for Disease Control and Prevention . National Diabetes Statistics Report, 2023: Estimates of Diabetes and Its Burden in the United States. U.S. Department of Health and Human Services; Nov, 2023. [(accessed on 8 April 2025)]. Available online: https://nationaldppcsc.cdc.gov/s/article/CDC-National-Diabetes-Statistic....
    1. Rowley W.R., Bezold C., Arikan Y., Byrne E., Krohe S. Diabetes 2030: Insights from Yesterday, Today, and Future Trends. Popul. Health Manag. 2017;20:6–12. doi: 10.1089/pop.2015.0181. - DOI - PMC - PubMed
    1. Chamine I., Hwang J., Valenzuela S., Marino M., Larson A.E., Georgescu J., Latkovic-Taber M., Angier H., DeVoe J.E., Huguet N. Acute and Chronic Diabetes-Related Complications Among Patients With Diabetes Receiving Care in Community Health Centers. Diabetes Care. 2022;45:e141–e143. doi: 10.2337/dc22-0420. - DOI - PMC - PubMed

LinkOut - more resources