. 2025 Apr 14;26(8):3704.
doi: 10.3390/ijms26083704.

Liraglutide Attenuates FFA-Induced Retinal Pigment Epithelium Dysfunction via AMPK Activation and Lipid Homeostasis Regulation in ARPE-19 Cells

Affiliations

Liraglutide Attenuates FFA-Induced Retinal Pigment Epithelium Dysfunction via AMPK Activation and Lipid Homeostasis Regulation in ARPE-19 Cells

Sing-Hua Tsou et al. Int J Mol Sci. .

Abstract

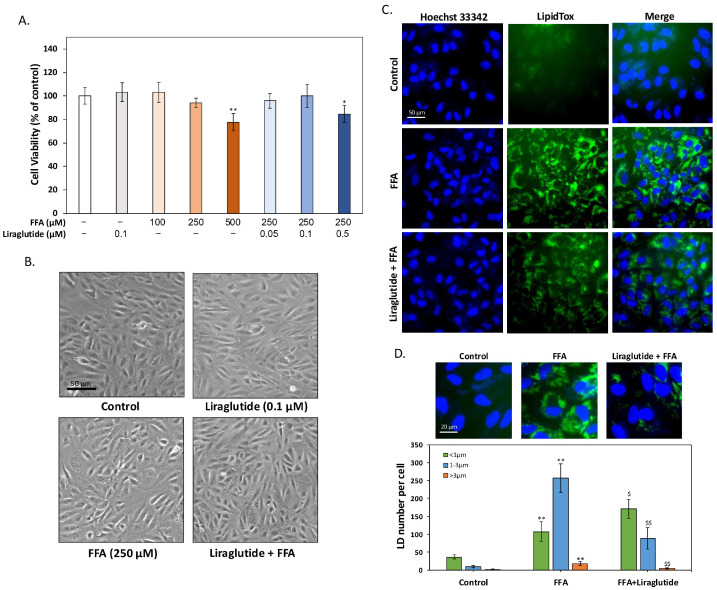
Age-related macular degeneration (AMD) is a leading cause of irreversible vision loss in the elderly, and it is characterized by oxidative stress, lipid dysregulation, and dysfunction of the retinal pigment epithelium (RPE). A hallmark of AMD is the presence of drusen, extracellular deposits rich in lipids, proteins, and cellular debris, which are secreted by the RPE. These deposits impair RPE function, promote chronic inflammation, and accelerate disease progression. Despite advancements in understanding AMD pathogenesis, therapeutic strategies targeting lipid dysregulation and oxidative damage in RPE cells remain limited. This study evaluated the effects of liraglutide, a glucagon-like peptide-1 receptor agonist (GLP-1RA), on free fatty acid (FFA)-induced damage in ARPE-19 cells, a widely used in vitro model of RPE dysfunction. FFA treatment induced lipid droplet accumulation, oxidative stress, and epithelial-mesenchymal transition (EMT), which are processes implicated in AMD progression. Liraglutide significantly reduced lipid droplet accumulation, mitigated oxidative stress, and suppressed EMT, as demonstrated by high-content imaging, immunocytochemistry, and molecular assays. Mechanistic analyses revealed that liraglutide activates AMP-activated protein kinase (AMPK), enhancing lipophagy and restoring lipid homeostasis. Furthermore, liraglutide influenced exosome secretion, altering paracrine signaling and reducing EMT markers in neighboring cells. These findings underscore liraglutide's potential to address critical mechanisms underlying AMD pathogenesis, including lipid dysregulation, oxidative stress, and EMT. This study provides foundational evidence supporting the development of GLP-1 receptor agonists as targeted therapies for AMD.

Keywords: AMP-activated protein kinase (AMPK); epithelial-mesenchymal transition (EMT); free fatty acid (FFA); lipid droplet (LD); liraglutide; retinal pigment epithelium (RPE).


Conflict of interest statement

The authors declare no conflicts of interest.

Figures

Figure 1
Figure 1
Liraglutide mitigates LD accumulation in ARPE-19 cells induced by FFA. (A) MTT assay results showing the effects of different concentrations of FFA and liraglutide on cell viability in ARPE-19 cells after 24 h. While 100 μM and 250 μM FFA did not affect cell viability, 500 μM significantly reduced viability. Liraglutide alone at 0.1 μM had no effect, but 0.5 μM liraglutide significantly reduced viability when combined with 250 μM FFA. Based on these results, 250 μM FFA and 0.1 μM liraglutide were used for subsequent experiments. (B) Bright-field images showed no visible changes in cell morphology or viability after treatment with 250 μM FFA, 0.1 μM liraglutide, or their combination. (C) LipidTox staining revealed significant intracellular LD accumulation in ARPE-19 cells treated with 250 μM FFA for 24 h. Co-treatment with 0.1 μM liraglutide effectively reduced LD accumulation. (D) High-content analysis (HCA) quantified LD size and distribution. FFA treatment significantly increased the number of LDs larger than 1 μm in diameter. Co-treatment with liraglutide reduced the total number of LDs and those ≥1 μm, while increasing the number of smaller LDs (<1 μm). These results suggest that liraglutide promotes LD degradation and mitigates FFA-induced lipid overload. All experiments were independently repeated at least three times. For HCA analysis, a minimum of 100 cells per condition were analyzed to ensure statistical robustness. All data are presented as mean ± SD. An asterisk (*) indicates a significant difference compared with the control group (* p < 0.05 and ** p < 0.01), and a dollar sign ($) indicates a significant difference compared with the FFA-treatment group ($ p < 0.05 and $$ p < 0.01).
Figure 2
Figure 2
Liraglutide mitigates tight junction disruption and EMT in ARPE-19 cells induced by FFA. (A) Immunocytochemistry staining of ZO-1, a tight junction marker, in ARPE-19 cells treated with FFA (250 μM) and/or liraglutide (0.1 μM) for 24 h. FFA treatment significantly reduced ZO-1 expression at the cell membrane, particularly in regions with increased LD accumulation, as shown by LipidTox staining. Co-treatment with liraglutide restored ZO-1 expression to control levels. Scale bar = 100 μm. (B) Western blot analysis of epithelial marker E-cadherin, mesenchymal marker vimentin, and EMT-associated phosphorylated Smad2/3. FFA treatment reduced E-cadherin expression and increased vimentin and pSer-Smad2/3 levels. Liraglutide co-treatment reversed these changes, restoring E-cadherin and reducing vimentin and pSer-Smad2/3 expression. β-actin was used as a loading control. The bar graph shows relative protein expression normalized to β-actin. (C) Immunocytochemistry staining of E-cadherin and vimentin further supports the Western blot results. FFA treatment reduced E-cadherin and increased vimentin expression, both of which were reversed with liraglutide co-treatment. Scale bar = 100 μm. (D) Quantitative PCR analysis of EMT-related transcription factors, including Snail, Twist1, Twist2, and Slug. FFA significantly upregulated these transcription factors, indicating EMT induction, while liraglutide co-treatment suppressed their expression. All data were collected from at least three independent experiments and are presented as mean ± SD. An asterisk (*) indicates a significant difference compared with the control group (* p < 0.05 and ** p < 0.01), and a dollar sign ($) indicates a significant difference compared with the FFA-treatment group ($ p < 0.05 and $$ p < 0.01).
Figure 3
Figure 3
Liraglutide counteracts FFA-induced autophagy suppression and enhances lipophagy in ARPE-19 cells. (A) AO staining of ARPE-19 cells treated with FFA (250 μM) and/or liraglutide (0.1 μM) for 24 h. FFA significantly reduced the expression of AVOs, indicating suppressed autophagy, while liraglutide co-treatment restored AVO expression. Scale bar = 50 μm. (B) HCA quantification of AVOs. FFA reduced the number of AVOs to ~10% of control levels, while liraglutide co-treatment recovered AVOs to ~50% of control levels. (C) Western blot analysis of pThr172-AMPK, LC3-II, p62, and pSer2448-mTOR in ARPE-19 cells. FFA significantly decreased pThr172-AMPK and LC3-II expression and increased p62 levels, consistent with autophagy suppression. Additionally, FFA markedly elevated p-mTOR levels, indicating mTOR activation and the further inhibition of autophagy. Liraglutide co-treatment reversed these effects, restoring pThr172-AMPK and LC3-II levels while reducing p62 accumulation, and suppressing mTOR phosphorylation, suggesting the activation of AMPK-mediated autophagy through inhibition of the mTOR pathway. (D) Immunocytochemistry staining of PLIN2 in ARPE-19 cells. FFA markedly reduced PLIN2 expression, while liraglutide restored it. Co-localization of PLIN2 with LDs suggests that liraglutide promotes lipophagy and enhances LD degradation. Scale bar = 20 μm. (E) Quantitative PCR analysis of lipophagy and lysosomal degradation-related genes, including autophagy related 5 (ATG5), lysosomal acid lipase (LIPA), ras-related protein 7A (RAB7A), and lysosomal-associated membrane protein 2 (LAMP2). FFA significantly downregulated these genes, indicating suppressed LD degradation pathways, whereas liraglutide restored their expression levels. All data were collected from at least three independent experiments and are presented as mean ± SD. For the HCA quantification of AVOs, a minimum of 100 cells per condition were analyzed to ensure statistical robustness. An asterisk (*) indicates a significant difference compared with the control group (** p < 0.01), and a dollar sign ($) indicates a significant difference compared with the FFA-treatment group ($ p < 0.05 and $$ p < 0.01).
Figure 4
Figure 4
AMPK activation mediates liraglutide’s protective role in ARPE-19 cells under FFA-induced stress. (A) DCFH-DA staining of ARPE-19 cells treated with FFA (250 μM), liraglutide (0.1 μM), and/or compound C (CC, 10 μM) for 24 h. FFA significantly increased intracellular ROS, as indicated by enhanced DCFH fluorescence. Liraglutide reduced ROS accumulation, while CC co-treatment abrogated this effect. Scale bar = 50 μm. (B) The quantification of ROS levels using a fluorescence microplate reader. Intracellular ROS levels were quantified by measuring the fluorescence intensity of the DCFH-DA dye at excitation/emission wavelengths of 485/528 nm. FFA increased ROS levels approximately seven-fold compared to controls, whereas liraglutide reduced ROS by two-thirds. This reduction was reversed by CC co-treatment. (C) Western blot analysis of autophagy markers (pThr172-AMPK, LC3-II, p62) and EMT markers (E-cadherin, vimentin). FFA suppressed phosphorylated AMPK and LC3-II levels while increasing p62, indicating reduced autophagy. It also decreased E-cadherin and increased vimentin, confirming EMT induction. Liraglutide reversed these effects, but CC co-treatment reduced liraglutide’s protective impact. (D) Nile red staining of intracellular lipid. FFA increased lipid accumulation, while liraglutide reduced intracellular lipid levels. CC co-treatment reversed liraglutide’s effect on lipid reduction. Scale bar = 100 μm. All data were collected from at least three independent experiments and are presented as mean ± SD. An asterisk (*) indicates a significant difference compared to the control group (** p < 0.01), a dollar sign ($) indicates a significant difference compared to the FFA-treatment group ($ p < 0.05 and $$ p < 0.01), and a pound sign (#) indicates a significant difference compared to the FFA and liraglutide co-treatment group (## p < 0.01).
Figure 5
Figure 5
Liraglutide regulates exosome characteristics in ARPE-19 cells. (A) The NTA results of EVs secreted by ARPE-19 cells under the following treatment conditions are recorded: control, FFA (250 μM), FFA + liraglutide (0.1 μM), and FFA + liraglutide + GW4869 (10 μM). FFA significantly increased EV secretion, while liraglutide reduced this effect. GW4869, an exosome biogenesis/release inhibitor, drastically decreased EV secretion. (B) Quantification of EV concentration from NTA data. FFA increased EV concentration approximately 10-fold compared to the control. Liraglutide reduced EV levels to approximately eight times the control, while GW4869 significantly suppressed EV secretion. (C) Analysis of EV particle size distribution from NTA data revealed that FFA significantly increased the average diameter of EVs. Liraglutide did not alter the mean diameter but significantly reduced the median diameter (D50), the 90th percentile (D90), and the mode diameter of EVs. (D) EVs isolated from conditioned media were standardized to a concentration of 5 × 10⁷ particles/mL and were co-cultured with FFA-treated ARPE-19 cells for 24 h. Immunocytochemistry analysis revealed that EVs derived from the control and FFA + liraglutide groups enhanced E-cadherin expression and suppressed vimentin expression, indicating anti-EMT effects. EVs from the FFA group also reduced EMT but to a lesser extent compared to the control and FFA + liraglutide groups. Scale bar = 100 μm. All data were collected from at least three independent experiments and are presented as mean ± SD. An asterisk (*) indicates a significant difference compared to the control group (** p < 0.01), a dollar sign ($) indicates a significant difference compared to the FFA-treatment group ($ p < 0.05 and $$ p < 0.01), and a pound sign (#) indicates a significant difference compared to the FFA and liraglutide co-treatment group (## p < 0.01).

Similar articles

References

    1. Kim J., Lee Y.J., Won J.Y. Molecular Mechanisms of Retinal Pigment Epithelium Dysfunction in Age-Related Macular Degeneration. Int. J. Mol. Sci. 2021;22:12298. doi: 10.3390/ijms222212298. - DOI - PMC - PubMed
    1. Li C., Zhou L., Sun H., Yang M.M. Age-Related Macular Degeneration: A Disease of Cellular Senescence and Dysregulated Immune Homeostasis. Clin. Interv. Aging. 2024;19:939–951. doi: 10.2147/CIA.S463297. - DOI - PMC - PubMed
    1. Maurya M., Bora K., Blomfield A.K., Pavlovich M.C., Huang S., Liu C.H., Chen J. Oxidative stress in retinal pigment epithelium degeneration: From pathogenesis to therapeutic targets in dry age-related macular degeneration. Neural Regen. Res. 2023;18:2173–2181. doi: 10.4103/1673-5374.369098. - DOI - PMC - PubMed
    1. Wong J.H.C., Ma J.Y.W., Jobling A.I., Brandli A., Greferath U., Fletcher E.L., Vessey K.A. Exploring the pathogenesis of age-related macular degeneration: A review of the interplay between retinal pigment epithelium dysfunction and the innate immune system. Front. Neurosci. 2022;16:1009599. doi: 10.3389/fnins.2022.1009599. - DOI - PMC - PubMed
    1. Somasundaran S., Constable I.J., Mellough C.B., Carvalho L.S. Retinal pigment epithelium and age-related macular degeneration: A review of major disease mechanisms. Clin. Experiment. Ophthalmol. 2020;48:1043–1056. doi: 10.1111/ceo.13834. - DOI - PMC - PubMed

MeSH terms

LinkOut - more resources