Bioinformatics Analysis Reveals the Evolutionary Characteristics of the Phoebe bournei ARF Gene Family and Its Expression Patterns in Stress Adaptation
- PMID: 40332368
- PMCID: PMC12027883
- DOI: 10.3390/ijms26083701
Bioinformatics Analysis Reveals the Evolutionary Characteristics of the Phoebe bournei ARF Gene Family and Its Expression Patterns in Stress Adaptation
Abstract
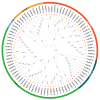
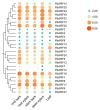
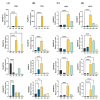
Auxin response factors (ARFs) are pivotal transcription factors that regulate plant growth, development, and stress responses. Yet, the genomic characteristics and functions of ARFs in Phoebe bournei remain undefined. In this study, 25 PbARF genes were identified for the first time across the entire genome of P. bournei. Phylogenetic analysis categorized these genes into five subfamilies, with members of each subfamily displaying similar conserved motifs and gene structures. Notably, Classes III and V contained the largest number of members. Collinearity analysis suggested that segmental duplication events were the primary drivers of PbARF gene family expansion. Structural analysis revealed that all PbARF genes possess a conserved B3 binding domain and an auxin response element, while additional motifs varied among different classes. Promoter cis-acting element analysis revealed that PbARF genes are extensively involved in hormonal responses-particularly to abscisic acid and jasmonic acid and abiotic stresses-as well as abiotic stresses, including heat, drought, light, and dark. Tissue-specific expression analysis showed that PbARF25, PbARF23, PbARF19, PbARF22, and PbARF20 genes (class III), and PbARF18 and PbARF11 genes (class V) consistently exhibited high expression levels in the five tissues. In addition, five representative PbARF genes were analyzed using qRT-PCR. The results demonstrated significant differences in the expression of PbARF genes under various abiotic stress conditions (drought, salt stress, light, and dark), indicating their important roles in stress response. This study laid a foundation for elucidating the molecular evolution mechanism of ARF genes in P. bournei and for determining the candidate genes for stress-resistance breeding.
Keywords: ARF; Phoebe bournei; expansion; gene family; stress response.
Conflict of interest statement
The authors declare no conflicts of interest.
Figures


Similar articles
-
Genome Identification and Expression Profiling of the PIN-Formed Gene Family in Phoebe bournei under Abiotic Stresses.Int J Mol Sci. 2024 Jan 25;25(3):1452. doi: 10.3390/ijms25031452. Int J Mol Sci. 2024. PMID: 38338732 Free PMC article.
-
Comprehensive Expression Analysis of the WRKY Gene Family in Phoebe bournei under Drought and Waterlogging Stresses.Int J Mol Sci. 2024 Jul 2;25(13):7280. doi: 10.3390/ijms25137280. Int J Mol Sci. 2024. PMID: 39000387 Free PMC article.
-
Identification and Characterization of the DOF Gene Family in Phoebe bournei and Its Role in Abiotic Stress-Drought, Heat and Light Stress.Int J Mol Sci. 2024 Oct 17;25(20):11147. doi: 10.3390/ijms252011147. Int J Mol Sci. 2024. PMID: 39456929 Free PMC article.
-
Genome-Wide Identification, Characterization, and Expression Analysis of the BES1 Family Genes under Abiotic Stresses in Phoebe bournei.Int J Mol Sci. 2024 Mar 6;25(5):3072. doi: 10.3390/ijms25053072. Int J Mol Sci. 2024. PMID: 38474317 Free PMC article.
-
Genome-Wide Identification of GATA Family Genes in Phoebe bournei and Their Transcriptional Analysis under Abiotic Stresses.Int J Mol Sci. 2023 Jun 19;24(12):10342. doi: 10.3390/ijms241210342. Int J Mol Sci. 2023. PMID: 37373489 Free PMC article.
References
MeSH terms
Substances
LinkOut - more resources
Full Text Sources

