. 2025 Apr 15;26(8):3732.
doi: 10.3390/ijms26083732.

Gene Expression Profile of Cultured Human Coronary Arterial Endothelial Cells Exposed to Serum from Chronic Kidney Disease Patients: Role of MAPK Signaling Pathway

Affiliations

Gene Expression Profile of Cultured Human Coronary Arterial Endothelial Cells Exposed to Serum from Chronic Kidney Disease Patients: Role of MAPK Signaling Pathway

Angélica Rangel-López et al. Int J Mol Sci. .

Abstract

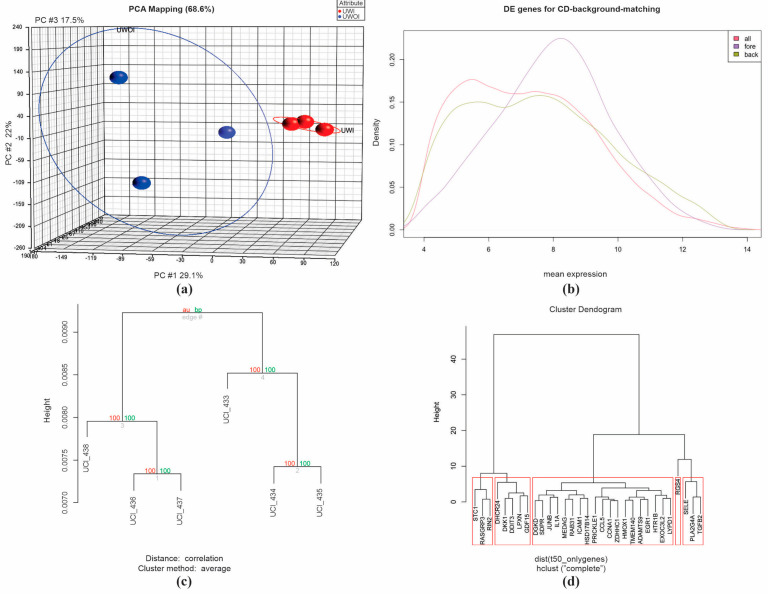
Patients with end-stage renal disease (ESRD) are at increased risk of cardiovascular disease (CVD), such as myocardial infarction (MI). Uremic toxins and endothelial dysfunction are central to this process. In this exploratory study, we used the Affymetrix GeneChip microarray to investigate the gene expression profile in uremic serum-induced human coronary arterial endothelial cells (HCAECs) from ESRD patients with and without MI (UWI and UWOI groups) as an approach to its underlying mechanism. We also explored which pathways are involved in this process. We found 100 differentially expressed genes (DEGs) among the conditions of interest by supervised principal component analysis and hierarchical cluster analysis. The expressions of four major DEGs were validated by quantitative RT-PCR. Pathway analysis and molecular network were used to analyze the interaction and expression patterns. Ten pathways were identified as the main enriched metabolic pathways according to the transcriptome profiling analysis, which were, among others, positive regulation of inflammatory response, positive regulation of extracellular signal-regulated kinases 1 and 2 (ERK1/2) cascade, cardiac muscle cell development, highlighting positive regulation of mitogen-activated protein kinase (MAPK) activity (p = 0.00016). Up- and down-regulation of genes from HCAECs exposed to uremic serum could contribute to increased endothelial dysfunction and CVD in ESRD patients. Our study suggests that inflammation and the ERK-MAPK pathway are highly enriched in kidney disease patients with MI, suggesting their role in ESRD pathology. Further studies and approaches based on MAPK pathway interfering strategies are needed to confirm these data.

Keywords: chronic kidney disease; end-stage renal disease; endothelial cell dysfunction; gene expression profile; human coronary arterial endothelial cells; microarrays; myocardial infarction; uremia; uremic toxins.


Conflict of interest statement

The authors declare no conflicts of interest.

Figures

Figure 1
Figure 1
Graphical representation of quality control evaluation of microarrays (a) MA plots of six microarrays corresponding to the samples of the uremia without infarction (UWOI) and uremia with infarction (UWI) groups. Each dot represents a gene. The M-values are centered at zero, which, like (b), means that there is no dependence between the intensities and the logarithmic relationship. (c) Box plots of intensity level and probe density distribution among microarrays. (d) Density plot of the median intensities of the six microarrays.
Figure 2
Figure 2
Principal component analysis (PCA) and comparison of gene expression profiles across hierarchical groups. (a) PCA describing the associated profile in the groups. In blue is the UWOI group, and in red is the UWI group. This panel (a) shows the difference in gene expression between the two study groups. Patients with uremia and infarction (UWI) showed more intergroup-related gene expression, unlike the uremia without infarction group (UWOI). (b) Plot of differentially expressed genes between density versus mean expression. All genes (red line), fore (purple line), and back (green line). (c,d) Dendrograms based on the expression of 100 and 50 genes, respectively. We used these genes as target genes for gene ontology and annotation analysis based on the expression of 50 genes (d) and 100 genes (c) involved in UWI visualized through a hierarchical clustering dendrogram of the expression profile.
Figure 3
Figure 3
Volcano plot of genes that qualified as differentially expressed (DEGs) between UWOI and UWI groups in HCAECs. Blue dots in the upper left quadrant represent down-regulated genes, red dots in the upper right quadrant represent up-regulated genes, and black dots present stable genes (p < 0.05).
Figure 4
Figure 4
Hierarchical cluster. DEG heatmap of supervised analysis of 100 differentially expressed genes between UWOI (orange upper bar) and UWI (dark green upper bar) groups in HCAECs. The upper left quadrant shows the color key and histogram representing the behavior of DEGs for the UWOI and UWI groups in the HCAEC model. The samples are in the columns, and the genes are in the rows. Red color represent up regulated genes, and blue color represent down-regulated genes with different expression intensity.
Figure 5
Figure 5
A map of the best enriched GO hierarchies according to the criterion of the classic Fisher test, defining the ten most significant enriched DEG term nodes (represented in red squares). In this figure, some categories are very general and do not mention the genes they include, but it can be seen that the MAPK category is the most enriched. The interpretation of Table 2 is greatly complemented by Figure 5.
Figure 6
Figure 6
Molecular networks of HCAECs exposed to uremic serum. Associated genes derived from String were based on correlations in order to characterize cellular and molecular functions and identify enriched canonical pathways/networks for the list of selected candidate genes, according to Gen Ontology data. The solid lines represent the interactions between genes, and the nodes (spheres) represent the proteins that are associated with the respective genes. Each color of the nodes represents evidence of protein–protein interaction. Pink indicates experimentally determined/post-translational modifications; blue indicates gene co-occurrence; green indicates gene neighborhood; black indicates co-expression; red indicates gene fusion. Nodes with ribbon-like structures represent the availability of 3D structural information of the protein being predicted.

Similar articles

References

    1. Bikbov B., Purcell C., Levey A.S., Smith M., Abdoli A., Abebe M., Adebayo O.M., Afarideh M., Agarwal S.K., Ahmaidan E., et al. Global, regional, and national burden of chronic kidney disease, 1990–2017: A systematic analysis for the Global Burden of Disease Study 2017. Lancet. 2020;395:709–733. doi: 10.1016/S0140-6736(20)30045-3. - DOI - PMC - PubMed
    1. Kovesdy C.P. Epidemiology of Chronic Kidney Disease: An Update 2022. Kidney Int. Suppl. 2022;12:7–11. doi: 10.1016/j.kisu.2021.11.003. - DOI - PMC - PubMed
    1. Thompson S., James M., Wiebe N., Hemmelgarn B., Manns B., Klarenbach S., Tonelli M., Network A.K.D. Cause of Death in Patients with Reduced Kidney Function. J. Am. Soc. Nephrol. 2015;26:2504–2511. doi: 10.1681/ASN.2014070714. - DOI - PMC - PubMed
    1. Moradi H., Sica D.A., Kalantar-Zadeh K. Cardiovascular burden associated with uremic toxins in patients with chronic kidney disease. Am. J. Nephrol. 2013;38:136–148. doi: 10.1159/000351758. - DOI - PubMed
    1. Menon V., Gul A., Sarnak M.J. Cardiovascular risk factors in chronic kidney disease. Kidney Int. 2005;68:1413–1418. doi: 10.1111/j.1523-1755.2005.00551.x. - DOI - PubMed

LinkOut - more resources