. 2025 Apr 16;26(8):3753.
doi: 10.3390/ijms26083753.

The Protective Effect of Topical PACAP38 in Retinal Morphology and Function of Type 2 Diabetic Retinopathy

Affiliations

The Protective Effect of Topical PACAP38 in Retinal Morphology and Function of Type 2 Diabetic Retinopathy

Lina Li et al. Int J Mol Sci. .

Abstract

The continuously growing diabetes population is a significant concern with type 2 diabetic retinal disease (T2DRD), which is a leading cause of permanent blindness. However, the underlying pathophysiological mechanism of T2DRD has not yet been fully understood. Pituitary adenylate cyclase-activating polypeptide (PACAP) was first isolated from the ovine hypothalamus based on its stimulating effect on the adenylate cyclase enzyme in anterior pituitary cells. PACAP38 (PACAP with 38 amino acids) activates anti-apoptotic pathways, inhibits pro-apoptotic signaling, and creates an anti-inflammatory environment in the retina. The aim of the present study was to test the possible retinoprotective effect of the topical administration of PACAP38 in a type 2 diabetic animal model induced by a high-fat diet and the intraperitoneally injected low-dose streptozotocin (STZ). Wistar rats were divided into four groups: the control, control + PACAP38, diabetes, and diabetes + PACAP38 groups randomly. Type 2 diabetes was induced with the combination of STZ (30 mg/kg) and a high-fat diet. All rats were treated topically two times a day for 16 weeks: the control + PACAP38 and diabetes + PACAP38 groups were applied with PACAP38 eye drops (1 µg/drop), while the control and diabetes groups were administered using vehicles (artificial tears). The diabetes model was validated by a fasting oral glucose tolerance test (OGTT) and C-peptide ELISA test. Animals were monitored during the whole experiment for the progression of the disease using electroretinography (ERG) and optical coherence tomography (OCT). Post-mortem immunohistochemistry and a vessel analysis were performed in the retina samples after 16 weeks. An OGTT, a C-peptide ELISA test, and the investigation of blood parameters proved the development of type 2 diabetes. Significant differences could be detected in visual function between the two diabetic groups at week 16 (in the a-wave, b-wave, and OP amplitudes), where the diabetes PACAP38-treated group was similar to the control ones. OCT measurements correlated with ERG data, where the total retinal thickness was preserved in the diabetes + PACAP38 group. PACAP38 also protected the microvascular structure in the retina. Topically administered PACAP38 has potent neuroprotective effects against type 2 diabetic retinal disease; therefore, it could be a promising therapeutic approach for the treatment of T2DRD.

Keywords: ERG; OCT; PACAP; eye drops; type 2 diabetic retinal disease.


Conflict of interest statement

The authors declare no conflicts of interest.

Figures

Figure 1
Figure 1
Effects of PACAP treatment on blood sugar response, fasting glucose levels, and high triglycerides in type 2 diabetes. (A) Recording of glucose tolerance test (intraperitoneal) 8 weeks after streptozotocin (STZ). Both the diabetes and diabetes + PACAP groups exhibited a significant rise in glucose levels compared to the control group (diabetes: * p = 0.005, diabetes + PACAP: * p = 0.004. The lower dashed line represents the normal fasting glucose level (7.8 mmol/L), while the upper dashed line indicates the 2-hour glucose threshold (11.1 mmol/L). (B) Longitudinal analysis of fasting glucose levels. Diabetic rats displayed a progressive elevation in glucose levels compared to the control group (8th weeks: * p = 0.004, 16th weeks: * p = 0.004). The dashed line represents the fasting glucose level (7.8 mmol/L). (C) Longitudinal analysis of triglyceride levels. The diabetes and diabetes + PACAP groups showed a significant elevation in triglyceride levels compared to the control group (diabetes: * p = 0.033, diabetes + PACAP: * p = 0.023). The dashed line represents the normal triglyceride level (0.79 mmol/L). (D) Analysis of C-peptide levels in control, control + PACAP, diabetes, and diabetes + PACAP groups after 8 weeks of STZ treatment. No statistical significance was observed between the groups. Significant difference compared to the control group (* p < 0.05). Abbreviations: PACAP: pituitary adenylate cyclase-activating polypeptide.
Figure 2
Figure 2
Protective effect of PACAP eye drops on vision. (A) Representative recordings of scotopic ERG in the control, control + PACAP, diabetes, and diabetes + PACAP groups at the endpoint of the experiment. (B) Analysis of a-wave amplitude. Diabetic rats exhibited a significant reduction in a-wave amplitude compared to controls (* p = 0.023). (C) Analysis of b-wave amplitude. Diabetic rats showed statistical significance in b-wave amplitude compared to control (* p < 0.001, # p = 0.015). (D) Investigation of oscillatory potential wave amplitude also revealed statistical significance between diabetes and control (* p < 0.001), and diabetes and diabetes + PACAP (# p = 0.045). *: significant difference compared to the control group; #: significant difference compared to the diabetes group (p < 0.05). Abbreviations: OP: oscillatory potential; PACAP: pituitary adenylate cyclase-activating polypeptide.
Figure 3
Figure 3
Histological effects of PACAP eye drops treatment. Representative OCT images comparing retinal thickness 16 weeks after STZ injection. (A) Magnified view of the retinal structure highlighting the different histological layers. (B) Representative cross-sectional B-scans from the control, control + PACAP, diabetes, and diabetes + PACAP groups, showing retinal thickness (mm). Abbreviations: PACAP: pituitary adenylate cyclase-activating polypeptide, GCL: ganglion cell layer; IPL: inner plexiform layer; INL: inner nuclear layer; OPL: outer plexiform layer; ONL: outer nuclear layer; IS: inner segment; OS: outer segment; PE: pigment epithelium; TRT: total retinal thickness. Scale bar: 100 µm.
Figure 4
Figure 4
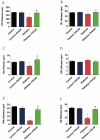
Effects of PACAP eye drop treatment on retinal layer thicknesses. Statistical analysis of retinal thickness was performed using OCT B-scan images 16 weeks after STZ injection. Diabetes resulted in a significant reduction in total retinal thickness (TRT) compared to the control group (* p < 0.001). However, the diabetes + PACAP group exhibited significantly thicker TRT than the diabetes group (# p < 0.001) (A). Diabetes showed significant thinning retinal layers compared to the control group in the outer segment (OS) (* p < 0.001) (F), outer nuclear layer (ONL) (* p = 0.02) (E), inner nuclear layer (INL) (* p = 0.02) (C), and in the inner plexiform layer (IPL) (* p = 0.005) (B). In contrast, the diabetes + PACAP group demonstrated significantly greater thickness than the diabetes group in OS (# p < 0.001) (F), ONL (# p = 0.005) (E), and INL (# p = 0.005) (C). Interestingly, the outer plexiform layer (OPL) in the diabetic group appeared potentially thicker than both the control and diabetes + PACAP groups (D). *: vs. control; #: vs. diabetes group (p < 0.05). Abbreviations: PACAP: pituitary adenylate cyclase-activating polypeptide, TRT: total retinal thickness; IPL: inner plexiform layer; INL: inner nuclear layer; OPL: outer plexiform layer; ONL: outer nuclear layer; OS: outer segment.
Figure 5
Figure 5
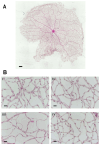
Microvascular histopathology after PACAP treatment. (A) Normal whole retinal vessel architecture in rats. (B) Representative images of the retinal microvascular system in the four groups ((I): control; (II): control + PACAP; (III): diabetes; and (IV): diabetes + PACAP), using the retina-trypsin digestion flat-mount approach and stained with hematoxylin and eosin. Scale bar: 500 µm (A), and 100 µm (B).
Figure 6
Figure 6
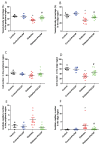
Impact of PACAP treatment on microvascular histopathology. Analysis of the vessel density (VD), and number of pericytes and acellular capillaries (ACs). Diabetic retinas exhibited a significant decrease in VD in the peripheral (* p = 0.002) (A) and edge (* p = 0.003) (B) regions compared to the control group. However, PACAP-treated diabetic retinas showed a statistically significant increase in VD (peripheral: # p = 0.008; edge: # p = 0.02). Regarding the number of pericytes, significant differences were observed between the disease and control group in the edge region (* p = 0.005) (D), but not in the peripheral region (p > 0.05) (C). In contrast, diabetes was associated with a significantly higher number of acellular capillaries compared to the control group in the edge region (* p = 0.01) (F), but not in the peripheral region (p > 0.05) (E). Notably, the diabetes + PACAP group demonstrated a substantially lower number of AC compared to the diabetes group in the edge region (# p = 0.01) (F). Symbols represent the number of elements in the different groups investigated. *: vs. control; #: vs. diabetes group (p < 0.05). Abbreviations: PACAP: pituitary adenylate cyclase-activating polypeptide.

References

    1. Atlas I.D. Global diabetes data report 2000–2045. 2023. [(accessed on 9 September 2024)]. Available online: https://diabetesatlas.org/data/en/world/
    1. Di Leo M.A.S., Caputo S., Falsini B., Porciatti V., Greco A.V., Ghirlanda G. Presence and further development of retinal dysfunction after 3-year follow up in IDDM patients without angiographically documented vasculopathy. Diabetologia. 1994;37:911–916. doi: 10.1007/BF00400947. - DOI - PubMed
    1. Sohn E.H., Van Dijk H.W., Jiao C., Kok P.H.B., Jeong W., Demirkaya N., Garmager A., Wit F., Kucukevcilioglu M., van Velthoven M.E.J., et al. Retinal neurodegeneration may precede microvascular changes characteristic of diabetic retinopathy in diabetes mellitus. Proc. Natl. Acad. Sci. USA. 2016;113:E2655–E2664. doi: 10.1073/pnas.1522014113. - DOI - PMC - PubMed
    1. Abràmoff M.D., Lavin P.T., Birch M., Shah N., Folk J.C. Pivotal trial of an autonomous AI-based diagnostic system for detection of diabetic retinopathy in primary care offices. npj Digit. Med. 2018;1:39. doi: 10.1038/s41746-018-0040-6. - DOI - PMC - PubMed
    1. Jonsson K.B., Frydkjaer-Olsen U., Grauslund J. Vascular Changes and Neurodegeneration in the Early Stages of Diabetic Retinopathy: Which Comes First? Ophthalmic Res. 2016;56:1–9. doi: 10.1159/000444498. - DOI - PubMed

MeSH terms

Substances

LinkOut - more resources