. 2025 Apr 16;26(8):3763.
doi: 10.3390/ijms26083763.

Lapatinib-Resistant HER2+ Breast Cancer Cells Are Associated with Dysregulation of MAPK and p70S6K/PDCD4 Pathways and Calcium Management, Influence of Cryptotanshinone

Affiliations

Lapatinib-Resistant HER2+ Breast Cancer Cells Are Associated with Dysregulation of MAPK and p70S6K/PDCD4 Pathways and Calcium Management, Influence of Cryptotanshinone

Jorge Hernández-Valencia et al. Int J Mol Sci. .

Abstract

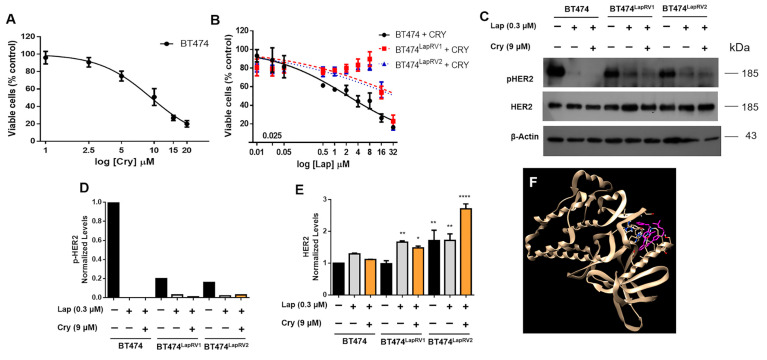
Resistance to HER2 tyrosine-kinase inhibitor Lapatinib (Lap) is one of the leading causes of cancer treatment failure in HER2+ breast cancer (BC), associated with an aggressive tumor phenotype. Cryptotanshinone (Cry) is a natural terpene molecule that could function as a chemosensitizer by disturbing estrogen receptor (ERα) signaling and inhibiting the protein translation factor-4A, eIF4A. Therefore, we evaluated Cry dual regulation on eIF4A and ERα. This study aimed to elucidate the underlying mechanisms of Lap chemoresistance and the impact of Cry on them. We generated two Lap-resistant BT474 cell HER2+ variants named BT474LapRV1 and BT474LapRV2 with high chemoresistance levels, with 7- and 11-fold increases in EC50, respectively, compared to BT474 parental cells. We found a PDCD4-p70S6Kβ axis association with Lap chemoresistance. However, a concomitant down-regulation of the RAF-MEK-ERK cell survival pathway and NF-κB was found in the chemoresistant cell variants; this phenomenon was exacerbated by joint treatment of Cry and Lap under a Lap plasmatic reported concentration. Optimized calcium management was identified as a compensatory mechanism contributing to chemoresistance, as determined by the higher expression of calcium pumps PMCA1/4 and SERCA2. Contrary to expectations, a combination of Lap and Cry did not affect the chemoresistance despite the ERα down-regulation; Cry-eIF4A binding possibly dampens this condition. Results indicated the pro-survival eIF4A/STAT/Bcl-xl pathway and that the down-regulation of the MAPK-NF-κB might function as an adaptive mechanism; this response may be compensated by calcium homeostasis in chemoresistance, highlighting new adaptations in HER2+ cells that lead to chemoresistance.

Keywords: breast cancer HER2+; calcium homeostasis; chemoresistance; cryptotanshinone; lapatinib.


Conflict of interest statement

The authors declare no conflicts of interest.

Figures

Figure 1
Figure 1
Schematic representation of the generation of Lap-resistant BT474LapRV1 and BT474LapRV2 cells. (A) Process for generation of variant denominated BT474LapRV1 by stimulation with high lapatinib dose (1 µM) and later a gradual reduction. (B) Variant BT474LapRV2 was generated with an increased range stimulation of lapatinib (0.1–0.25 µM).
Figure 2
Figure 2
Characterization of Lapatinib-resistant BT474 cell variants. (A) Cell viability was evaluated by the MTT assay; BT474 (parental), BT474LapRV1, and BT474LapRV2 cells were treated with increasing concentrations of Lap for 48 h. Each data point is the mean of three independent experiments ± SD. IC50 values for Lap treatment. (B) Colony formation assay of parental and Lap-resistant BT474LapRV1 and BT474LapRV2 cells seeded in 20 mm plates and treated with Lap (0.3 μM); images correspond to MTT-stained cells.
Figure 3
Figure 3
Cryptotanshinone (Cry) maintains chemoresistance in Lapatinib-resistant BT474 cell variants. Cell viability tested by MTT assay; (A) Parental cells (BT474) were treated with increasing Cry concentrations (0–20 μM) for 48 h; (B) Parental, BT474LapRV1, and BT474LapRV2 cells were incubated with increasing Lap concentrations and 9 μM Cry for 48 h. Each data point is the mean of three independent experiments ± SD. (C) Immunoblot analyses of HER2 and p-HER2 in cells treated with 0.3 μM of Lap and Cry (9 µM) in cell variants. Densitometry analysis of p-HER2 (D) and HER2 (E) after β-actin normalization; black bar without treatment; grey bar Lap treatment; orange bar Lap plus Cry treatment. Results are presented as the mean of three experiments ± SD. * p < 0.05; ** p < 0.01; **** p < 0.001. (F) Docking of lapatinib in the HER2 tyrosine kinase domain (PDB 3PP0). HER2 is shown in beige and lapatinib in magenta.
Figure 4
Figure 4
The axis p70S6K-PDCD4 is activated in chemoresistant cells. Chemoresitant cell variants BT474LapRV1, BT474LapRV2, and BT474 cells were treated under the scheme of Lap (0.3 µM) and Cry (9 µM). Western blot characterization of p70SK6α and p-p70SK6α (A), p70SK6β, and PDCD4 (B). (C) Densitometry analysis of PDCD4; black bar without treatment; grey bar Lap treatment; orange bar Lap plus Cry treatment; results are reported as the mean ± SD (n = 3) and expressed as normalized levels against β-actin. * p < 0.05; ** p < 0.01; *** p < 0.001.
Figure 5
Figure 5
eIF4A Cry treatment. (A) Characterization of eIF4A and STAT1 in parental and resistant cells treated with Lap (0.3 μM) and joint Cry (9 µM) for 24 h. (B) Densitometric analysis of eIF4A after β-actin normalization. Results are presented as the mean of three independent experiments ± SD. *** p < 0.001; **** p < 0.0001. (C) Structure of terpene molecule Cryptotanshinone. (D) eIF4A purification. Lane 1: total lysate; Lane 2: total lysate throughout Ni-NTA column; Lane 3: eluate recovery 1; Lane 4: eluate recovery 2; Lane 5: eluate recovery 3; Lane 6: eluate recovery 4. (E) eIF4A Cry binding fluorescence assay.
Figure 6
Figure 6
Cry induces estrogen receptor (ERα) down-regulation. (A) Expression levels of ERα and Bcl-xL under joint treatment of Lap (0.3 µM) and Cry (9 µM) in BT474, BT474LapRV1, and BT474LapRV2 cells. (B) Densitometry analysis of ERα; black bar without treatment; grey bar Lap treatment; orange bar Lap plus Cry treatment; results are reported as the mean ± SD (n = 3); * p < 0.05, ** p < 0.01, *** p < 0.001 and **** p < 0.0001 concerning the control. (C) Docking experimentation of Cry in the ER structure (PDB ID: 3ERT). ER is shown in beige, and Cry in green. (D) Docking of Fulvestrant in the ER structure. ER is shown in beige and fulvestrant in blue.
Figure 7
Figure 7
Dysregulation of survival pathways RAF-MEK-ERK in chemoresistance variants. (A) Under the scheme of Lap (0.3 µM) and Cry (9 µM) treatment, Western blot of B-Raf in BT474 and BT474LapRV2 cells. (B) Densitometry analysis of B-Raf; results are reported as the mean ± SD (n = 3) and expressed as fold change concerning loading control; * p < 0.05, ** p < 0.01, and *** p < 0.001. Bar colors represent the several treatments. Under the same scheme of Lap (0.3 µM) and Cry (9 µM) treatments, the characterization of pERK1, ERK1, and ERK2 (C), as well as XIAP (D). β-actin and GAPDH were used as loading controls.
Figure 8
Figure 8
Chemoresistance is associated with optimized calcium management. (A) Effect of joint treatment Lap (0.3 µM) and Cry (9 µM) on PMCA1/4 expression in BT474 and BT474LapRV2 cells; (B) under the same scheme, densitometry analysis of PMCA1/4, results are reported as the mean ± SD (n = 3) and expressed as fold change regarding loading control; * p < 0.05, ** p < 0.01 with regard to control. (C) Quantification of intracellular [Ca2+] under Lap and Cry treatments in BT474 and BT474LapRV2 cells. * p < 0.05 with regard to control. Under the same conditions, characterization of SERCA2 by Western blot (D), and densitometry analysis of SERCA2 (E), results are reported as the mean ± SD (n = 3) and expressed as fold change with regard to loading control; * p < 0.001 with respect to control. Bar colors represent the different treatments in (B,C,E).
Figure 9
Figure 9
NF-κB down-regulation is associated with chemoresistance. (A) Expression of the targets NF-κB and C-Myc in BT474 cells and brain tissue. (B) Effect of the Lap (0.3 µM) and Cry (9 µM) joint treatment on the expression of NF-κB and C-Myc in BT474 and BT474LapRV2 cells; (C) Under the same scheme, densitometry analysis of NF-κB, results are reported as the mean ± SD (n = 3) and expressed as fold change regard to loading control; * p < 0.05, ** p < 0.01, and *** p < 0.005 with regard to control. (D) Detection of PKCε under Lap and Cry treatments in BT474 and BT474LapRV2 cells. β-actin and GAPDH were used as a loading control. Bar colors represent the different treatments.

Similar articles

References

    1. Zhang L., Huang Y., Zhuo W., Zhu Y., Zhu B., Chen Z. Identification and characterization of biomarkers and their functions for Lapatinib-resistant breast cancer. Med. Oncol. 2017;34:89. doi: 10.1007/s12032-017-0953-y. - DOI - PubMed
    1. Rexer B.N., Arteaga C.L. Intrinsic and acquired resistance to HER2-targeted therapies in HER2 gene-amplified breast cancer: Mechanisms and clinical implications. Crit. Rev. Oncog. 2012;17:1–16. doi: 10.1615/CritRevOncog.v17.i1.20. - DOI - PMC - PubMed
    1. D’Amato V., Raimondo L., Formisano L., Giuliano M., De Placido S., Rosa R., Bianco R. Mechanisms of lapatinib resistance in HER2-driven breast cancer. Cancer Treat. Rev. 2015;41:877–883. doi: 10.1016/j.ctrv.2015.08.001. - DOI - PubMed
    1. Sridharan S., Basu A. Distinct Roles of mTOR Targets S6K1 and S6K2 in Breast Cancer. Int. J. Mol. Sci. 2020;21:1199. doi: 10.3390/ijms21041199. - DOI - PMC - PubMed
    1. Malka-Mahieu H., Newman M., Desaubry L., Robert C., Vagner S. Molecular Pathways: The eIF4F Translation Initiation Complex-New Opportunities for Cancer Treatment. Clin. Cancer Res. 2017;23:21–25. doi: 10.1158/1078-0432.CCR-14-2362. - DOI - PubMed

MeSH terms