. 2025 Apr 17;26(8):3821.
doi: 10.3390/ijms26083821.

Targeting the Ischemic Core: A Therapeutic Microdialytic Approach to Prevent Neuronal Death and Restore Functional Behaviors

Affiliations

Targeting the Ischemic Core: A Therapeutic Microdialytic Approach to Prevent Neuronal Death and Restore Functional Behaviors

May-Jywan Tsai et al. Int J Mol Sci. .

Abstract

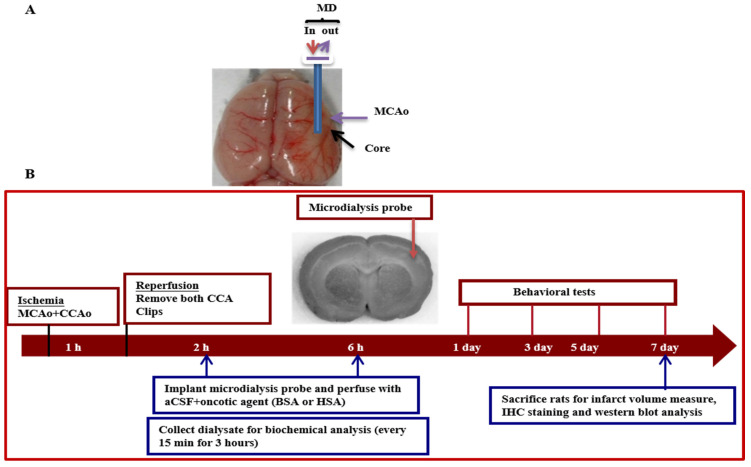
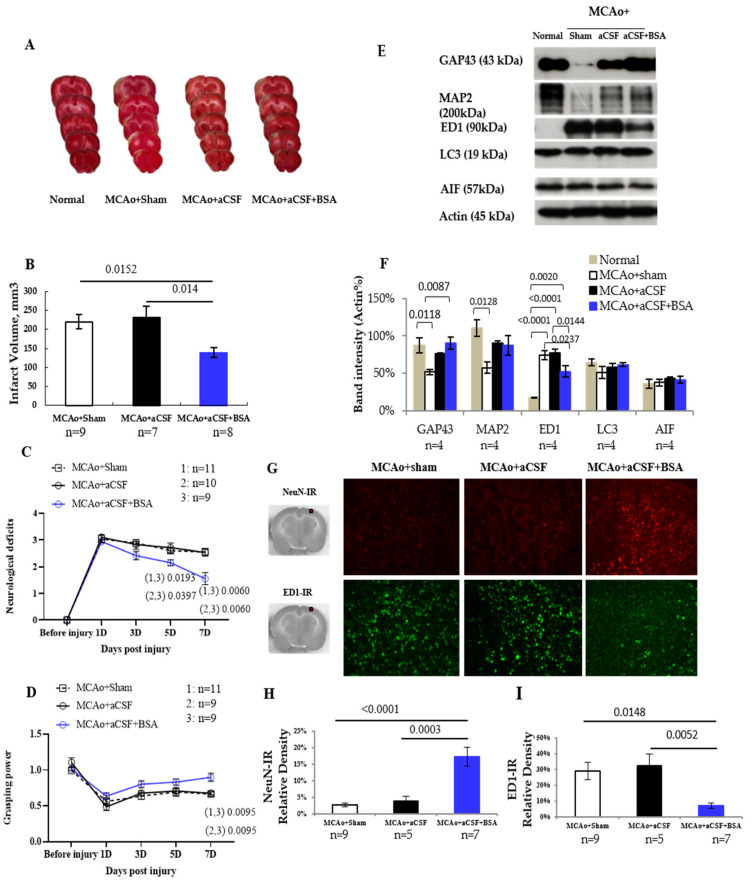
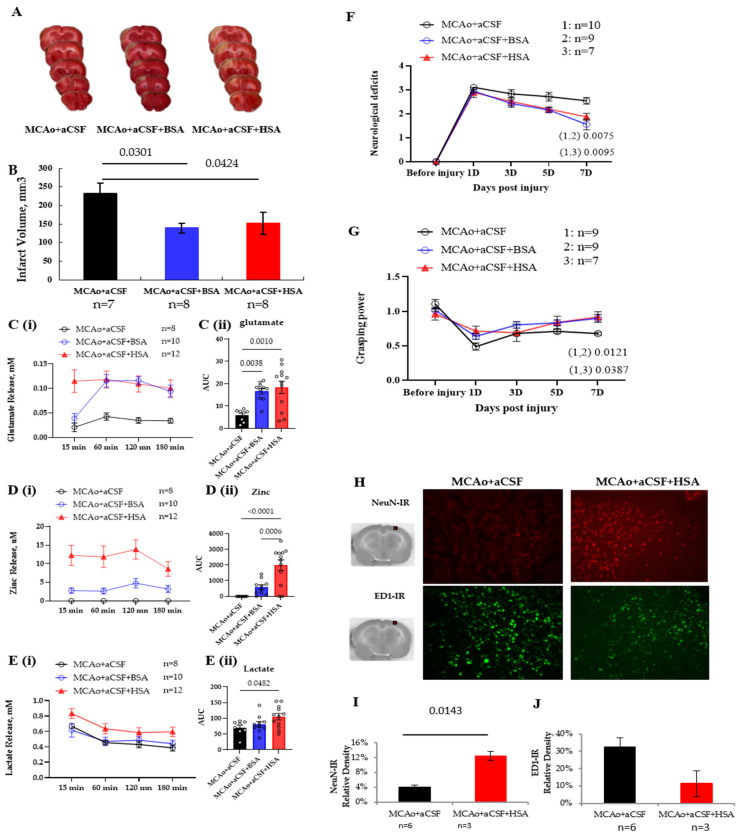
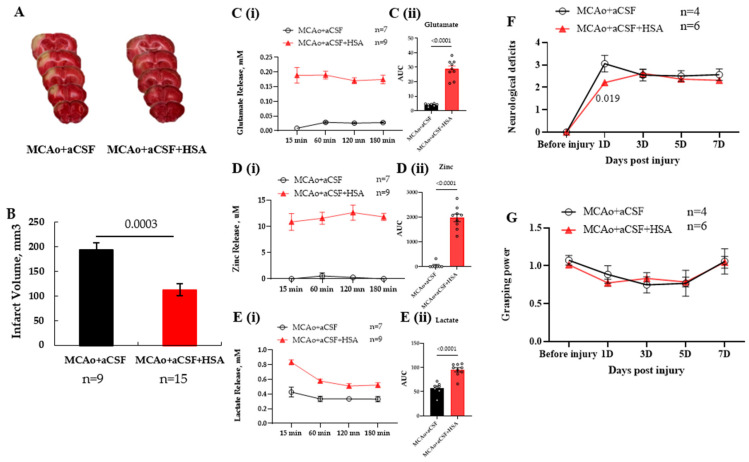
Ischemic stroke leads to cerebral ionic imbalance, increases acidosis, oxidative stress and release of glutamate and inflammatory mediators. Removing solute or stimulants from the ischemic core may block cell-damaging events and confer neuroprotection. In this study, we developed a minimally invasive therapeutic microdialysis (tMD) method, choosing to include serum albumin in the buffer because it is a multifunctional protein with osmotic properties. Aiming at the ischemic core, continuous perfusion of buffer supplemented with osmotic agents removes mediators of inflammation/cell damage/death from the lesion. This tMD treatment significantly removed the glutamate and zinc ions from the core, thereby reducing infarct volumes and affording high-grade neurobehavioral protection against ischemic stroke. The tMD treatment effectively protected neurons and reduced microglial activation. Furthermore, this tMD approach extended the therapeutic window to protect beyond 6 h after stroke onset. These findings support the potential clinical feasibility of applying tMD to patients with ischemic stroke, potentially without adverse effects.

Keywords: cerebral ischemia; microdialysis; neuroprotection; serum albumin.


Conflict of interest statement

The authors declare no conflicts of interest.

Figures

Scheme 1
Scheme 1
Protocol for application of therapeutic microdialysis (tMD) in ischemic rat brains after ischemia-reperfusion. (A) rat brain with a MD probe pre-equilibrated with buffer was inserted to the ischemic core. (B) A microdialysis probe pre-equilibrated with an aCSF-based dialytic buffer, was inserted into the ischemic core at 2 or 6 h after ischemic-reperfusion and microdialysis persisted for 3 h. Experimental rats were allowed to survive for one week. Rat brains were then removed for infarct volume analysis, morphology, and Western blot analysis.
Figure 1
Figure 1
Effect of tMD at 2 h post-injury on brain infarction and behavioral performance in MCAo rats. (A) TTC staining of brain sections for measurement of infarct size after stroke and treatment. Negative TTC stained area denotes the infarct area in ischemic brains. (B) Brain infarcted volume (mm3) in ischemic brain tissues (n = 9, 7, 8 rats for sham, aCSF, aCSF+BSA, respectively); significance at p = 0.014, aCSF vs. aCSF+BSA; p = 0.0152, sham vs. aCSF+BSA. (C) Neurological deficit scores in rats surviving one week after cerebral ischemia (n = 11, 10, 9 rats for sham, aCSF, aCSF+BSA, respectively). Five days behavioral significance at p = 0.0193, sham vs. aCSF+BSA; p = 0.0397 aCSF vs. aCSF+BSA; 7 days behavioral significance at p = 0.006, sham vs. aCSF+BSA; p = 0.006, aCSF vs. aCSF+BSA; (D) grasping power, which was evaluated by grip test on right forelimbs (unaffected side) and left forelimbs (stroke-affected side) in MCAo rats (n = 11, 9, 9 rats for sham, aCSF, aCSF+BSA, respectively); 7 days behavioral significance at p = 0.0095, sham vs. aCSF+BSA; p = 0.0095, aCSF vs. aCSF+HSA. Behavioral data were analyzed by two-way ANOVA followed by Holm–Sidak’s test. (E) Western blot analysis of rat brain lysates at 1 week post-injury. (F) Quantification of blots, normalized to internal control (actin), for cell markers GAP43, MAP-2, and ED1; for autophagy-related processes LC3, and for apoptosis-inducing factor (AIF). (G) Representative micrographs of NeuN and ED1 immunoreactive (IR) cells for neurons and activated microglia, respectively, in mid-infarct cortex, indicated by a red square in the subfigure, at 1 week after MCAo. Scale bar: 100 μm. (H) Histogram for quantitation of NeuN-IR density of images in panel G from n = 9, 5, 7 rats for sham, aCSF, aCSF+BSA, respectively. Significance at p = 0.0003, aCSF vs. aCSF+BSA; p < 0.0001, sham vs. aCSF+BSA by one-way ANOVA followed by Holm–Sidak’s test. (I) Histogram for quantitation of ED1-IR density of images in panel G from n = 9, 5, 7 rats for sham, aCSF, aCSF + BSA, respectively. Significance at p = 0.0052, aCSF vs. aCSF+BSA; p < 0.0148, sham vs. aCSF+BSA by one-way ANOVA followed by Holm–Sidak’s test. A microdialysis probe was implanted in the ischemic nidus at 2 h post-injury, and microdialysis persisted for 3 h. Data are expressed as the mean ± SEM.
Figure 2
Figure 2
Human serum albumin (HSA) was as effective as BSA in working as an oncotic agent for tMD in MCAo rats. (A) Representative images of TTC staining of ischemic brain tissues after 1 week of reperfusion. (B) Infarcted volume (mm3) in ischemic brain tissues (n = 7, 8, 8 rats for aCSF, aCSF+BSA, aCSF+HSA, respectively); significance at p = 0.0301, aCSF vs. aCSF+BSA; p = 0.0424, aCSF vs. aCSF+HSA. (C) Glutamate levels in the microdialysate of MCAo rats between 2 and 5 h post-injury (n = 8, 10, 12 rats for aCSF, aCSF+BSA, aCSF+HSA, respectively). The change in glutamate levels in the microdialysate were plotted (line chart, left panel), and the area under the curve was analyzed (bar chart with symbol which shows individual data). Quantification of the area under curve (AUC) showing significance at p = 0.0038, aCSF vs. aCSF+BSA; p = 0.001 aCSF vs. aCSF+HSA. (D) Zinc release to the microdialysate of MCAo rats between 2 and 5 h post-injury. The change in zinc release levels in the microdialysate were plotted and the individual AUC was analyzed, indicating significance p = 0.0006, aCSF vs. aCSF+HSA; p = 0.0001, aCSF+BSA vs. aCSF+HSA. (E) Lactate release to the microdialysate of MCAo rats between 2 and 5 h post-injury. The change in lactate release levels in the microdialysate was plotted and the individual AUC was analyzed, showing significance at p = 0.0482, aCSF vs. aCSF+HSA. Data from the AUC are the mean ± SEM. A significant difference was accepted at p < 0.05 by one-way ANOVA followed by Holm–Sidak’s test. (F) Neurological deficit scores in MCAo rats (n = 10, 9, 7 rats for aCSF, aCSF+BSA, aCSF+HSA, respectively); 7 days behavioral significance at p = 0.0075, aCSF vs. aCSF+BSA; p = 0.0095, aCSF vs. aCSF+HSA. (G) Grasping power, which was evaluated by grip test on right forelimbs (unaffected side) and left forelimbs (stroke-affected side) in MCAo rats (n = 9, 9, 7 rats for aCSF, aCSF+BSA, aCSF+HSA, respectively); 7 days behavioral significance at p = 0.0121, aCSF vs. aCSF+BSA; p = 0.0387, aCSF vs. aCSF+HSA. Behavioral data were analyzed by two-way ANOVA followed by Holm–Sidak’s test. (H) Representative micrographs of NeuN- or ED1-immunoreactive cells in mid-infarct cortex, shown by a red square in the subfigure, at 1 week after injury. Scale bar: 100 μm. (I) Histogram for quantitation of NeuN-IR density in the panel H images; n = 6, 3 rats for aCSF, aCSF+HAS, respectively; significance at p = 0.0143 by one-way ANOVA followed by Holm–Sidak’s test. (J) Histogram for quantitation of ED1-IR density in the panel H images. Data are expressed as the mean ± SEM.
Figure 3
Figure 3
Effect of intervention at 6 h post-injury with tMD on brain infarction, secreted stimulants, and behavioral performance in MCAo rats. (A) Representative TTC-staining images of brain slices from MCAo rats of various groups at 1 week post-injury. (B) Brain infarcted volume (mm3) in ischemic rats (n = 9, 15 rats for aCSF, aCSF+HSA, respectively); significance at p = 0.0003. (C) Glutamate release to the microdialysate of MCAo rats between 6 and 9 h post-injury (n = 7, 9 rats for aCSF, aCSF+HSA, respectively). The change of glutamate release in the microdialysate was plotted as a line chart (left panel) and the area under the curve (AUC) was analyzed (bar chart, right panel, with symbol of individual data). Quantification of the AUC shows significance at p < 0.0001, aCSF vs. aCSF+HSA. (D) Zinc release to the microdialysate of MCAo rats between 6 and 9 h post-injury (n = 7, 9 rats for aCSF, aCSF+HSA, respectively). The change in zinc release levels in the microdialysate was plotted and the AUC was analyzed with a significant result, p < 0.0001, aCSF vs. aCSF+HSA. (E) Lactate release to the microdialysate of MCAo rats between 6 and 9 h post-injury (n = 7, 9 rats for aCSF, aCSF+HSA, respectively). The change in lactate release in the microdialysate was plotted and the AUC was analyzed with significance at p < 0.0001, aCSF vs. aCSF+HSA. Data are the mean ± SEM. A significant difference was accepted at p < 0.05 by one-way ANOVA followed by Holm–Sidak’s test. (F) Neurological deficit scores in rats surviving one week after cerebral ischemia (n = 4, 6 rats for aCSF, aCSF+HSA, respectively). Day one behavioral significance at p = 0.019, aCSF vs. aCSF+HSA. (G) Grasping power by grip test on unaffected forelimbs and stroke-affected forelimbs in MCAo rats (n = 4, 6 rats for aCSF, aCSF+HSA, respectively). Behavioral data were analyzed by the generalized estimating equation (GEE) in which adjustments are made within or between groups. Data are expressed as the mean ± SEM.

Similar articles

References

    1. Kriz J., Lalancette-Hebert M. Inflammation, plasticity and real-time imaging after cerebral ischemia. Acta Neuropathol. 2009;117:497–509. doi: 10.1007/s00401-009-0496-1. - DOI - PubMed
    1. Feigin V.L., Owolabi M.O., World Stroke Organization-Lancet Neurology Commission Stroke Collaboration Group Pragmatic solutions to reduce the global burden of stroke: A World Stroke Organization-Lancet Neurology Commission. Lancet Neurol. 2023;22:1160–1206. doi: 10.1016/S1474-4422(23)00277-6. - DOI - PMC - PubMed
    1. Prust M.L., Forman R., Ovbiagele B. Addressing disparities in the global epidemiology of stroke. Nat. Rev. Neurol. 2024;20:207–221. doi: 10.1038/s41582-023-00921-z. - DOI - PubMed
    1. Mendelson S.J., Prabhakaran S. Diagnosis and Management of Transient Ischemic Attack and Acute Ischemic Stroke: A Review. JAMA. 2021;325:1088–1098. doi: 10.1001/jama.2020.26867. - DOI - PubMed
    1. Kong J., Zhang D. Current status and quality of radiomics studies for predicting outcome in acute ischemic stroke patients: A systematic review and meta-analysis. Front. Neurol. 2023;14:1335851. doi: 10.3389/fneur.2023.1335851. - DOI - PMC - PubMed

LinkOut - more resources