. 2025 May 7;184(6):327.
doi: 10.1007/s00431-025-06153-1.

Dynamics of Multisystem Inflammatory Syndrome in Children (MIS-C) associated to COVID-19: steady severity despite declining cases and new SARS-CoV-2 variants-a single-center cohort study

Affiliations

Dynamics of Multisystem Inflammatory Syndrome in Children (MIS-C) associated to COVID-19: steady severity despite declining cases and new SARS-CoV-2 variants-a single-center cohort study

Thomas Carzaniga et al. Eur J Pediatr. .

Abstract

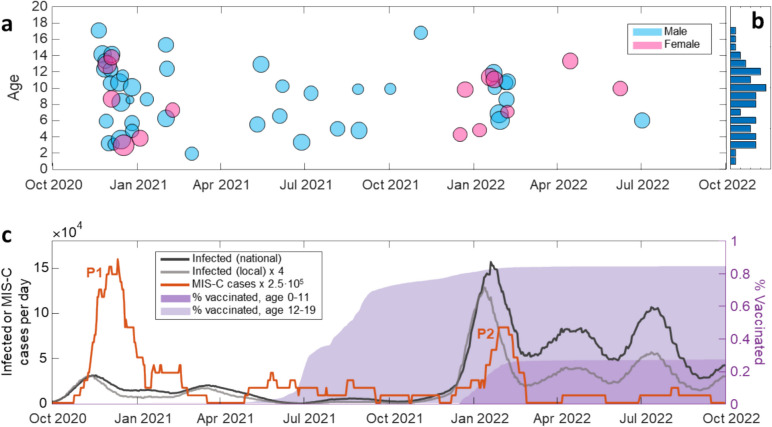
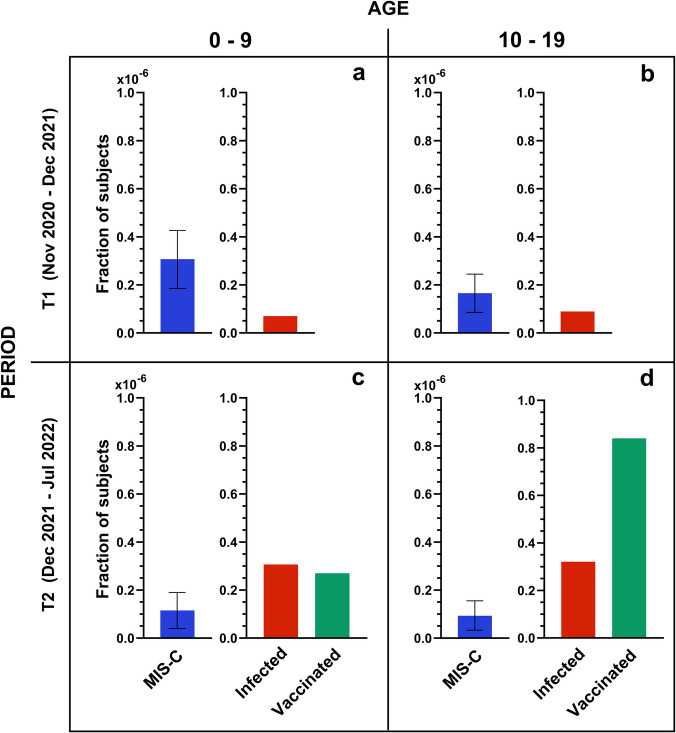
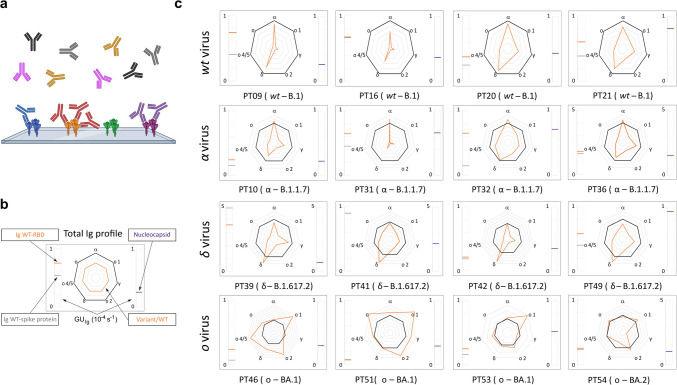
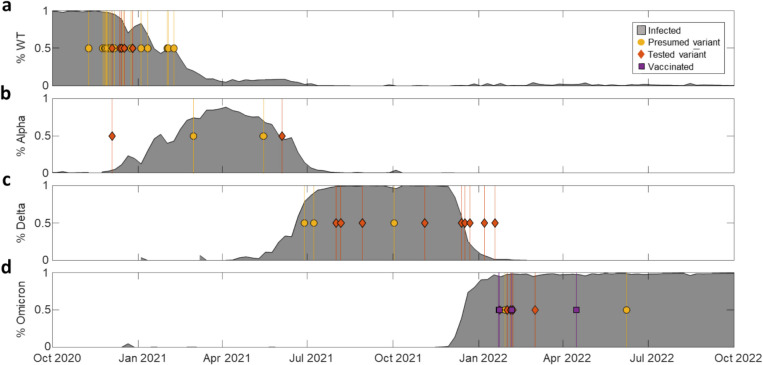
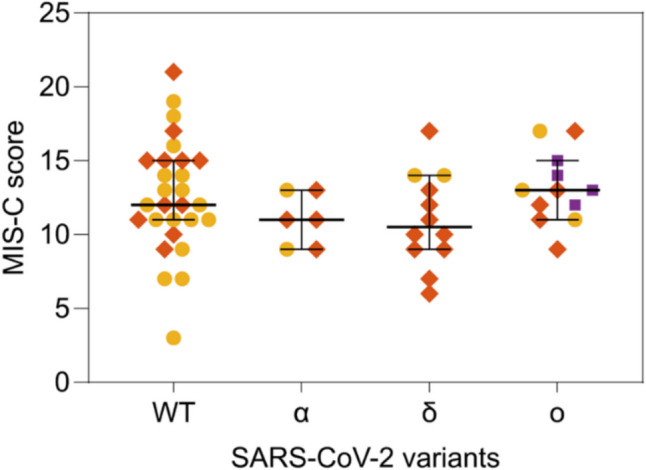
Multisystem Inflammatory Syndrome in Children (MIS-C) is a serious condition associated with SARS-CoV-2 infection. The relationship between SARS-CoV-2 variants of concern (VOCs) and the occurrence and severity of MIS-C is unknown. We analyzed the dynamics of MIS-C in the Milan metropolitan area (Italy) during the COVID-19 pandemic, focusing on the epidemiologic trends and disease severity in relation to different VOCs in a single-center study. Fifty-seven MIS-C patients (mean 8.3 ± 3.8 years) admitted to the Pediatric Department of Buzzi Children's Hospital in Milan, Italy, between November 2020 and July 2022, were retrospectively included in the study. The SARS-CoV-2 variant was retrospectively identified from serological fingerprinting (profiles of serum antibodies targeting different variants of SARS-CoV-2 obtained by a label-free microarray biosensor) or by the variant of prevalence. Two main periods of MIS-C case accumulation were observed. The peak of MIS-C cases rate in December 2020 reached 0.6 cases per day, which is nearly double the rate observed in February 2022, despite the larger number of infected subjects. Although the WT variant exhibited a broader range of severity score values, the score distributions for the different variants do not show statistically relevant differences.

Conclusion: The results clearly show a decrease in the incidence of MIS-C in relation to infections, but also support the concept that severity of MIS-C remained essentially unchanged across different virus variants, including Omicron. The course of MIS-C, once initiated, is independent from the characteristics of the triggering variants, although later variants may be considered less likely to induce MIS-C.

What is known: • MIS-C is a rare systemic inflammatory disorder that arises as a post-infectious complication temporally related to SARS-CoV-2 infection. • Fluctuations in MIS-C incidence were observed throughout the pandemic, with the latest variants associated with a lower incidence.

What is new: • The SARS-CoV-2 variant of infection can be retrospectively confirmed by serum antibody fingerprinting using a label-free microarray biosensor. • Despite the decreasing incidence, MIS-C severity has remained essentially unchanged across SARS-CoV-2 variants.

Keywords: Children; Infection; Label-free microarray biosensor; Multisystem inflammatory syndrome; SARS-CoV-2; Serum antibody fingerprint; Variants of concern.


Conflict of interest statement

Declarations. Ethics approval: The Ethics Committee Milano Area 1 (protocol number 0037072) granted approval for the study. The study was conducted according to the guidelines of the Declaration of Helsinki, and approved by the Institutional Review Board Territorial Area 1_Milano (Protocol number n. MI-1, n. 0034170; protocol number 2021/ST/138). Consent to participate: Informed consent was obtained from all parents and/or guardians involved in the study. Competing interests: The authors declare no competing interests.

Figures

Fig. 1
Fig. 1
Dynamics of MIS-C cases and SARS-CoV-2 infection. a Time distribution of MIS-C cases diagnosed at Pediatric Department of Buzzi Children’s Hospital in Milan, Italy. For each data point, the horizontal axis indicates the initial time of hospitalization, the vertical axis reports the age of the child, the color of the circle represents the sex (cyan for males and magenta for females), and the circle size indicates the severity score [15] assigned to each case. b Age distribution of MIS-C cases of panel a. Each abscissa tick represents 2 cases. c Time dependence of MIS-C cases reported in panel a (orange), and of SARS-CoV-2 infections in Italy (black) [23] and in Lombardy region (grey) [24], computed as 30-day moving averages of daily data. The data of MIS-C cases are multiplied by a factor 2.5 × 105 and the data of the number of infection in Lombardy are multiplied by a factor 4 to facilitate the comparison. The two peaks of MIS-C cases of December 2020 and February 2022 are indicated as P1 and P2, respectively. The shadow curves represent the percentage of vaccinated children in Lombardy with ages 0–11 (dark violet) and 12–19 (light violet)
Fig. 2
Fig. 2
MIS-C patients in relation to the pediatric population. The fraction of MIS-C cases (blue) diagnosed at Pediatric Department of Buzzi Children’s Hospital in Milan, Italy, relative to the population of Lombardy region [25], the fraction of subjects infected by SAR-CoV-2 (red) among the Italian population [24], and the fraction of vaccinated subjects (green) in Lombardy region [25] are reported for the age groups 0–9 (a, c) and 10–19 (b, d), and for the periods November 9, 2020–December 15, 2021 (a, b), and December 16, 2021–July 2, 2022 (c, d). The reported values represent the number of subjects divided by the corresponding cohort, i.e. the pediatric population of age 0–9 (a, c) and 10–19 (b, d) at February 2023 in Italy (red bars) or in Lombardy (blue and green bars). Error bars represent 95% confidence interval (see the “Methods” section). For data of infected and vaccinated subjects, the error bars are smaller than 1% (not displayed). The values of MIS-C cases are multiplied by 10−6 as indicated in the axis scale for direct comparison with the other data
Fig. 3
Fig. 3
Serum antibody fingerprints of MIS-C subjects against antigens of different SARS-CoV-2 variants. a Cartoon of the assay design: Ig antibodies bind the surface-immobilized antigens (i.e., RBD of spike protein or full spike protein). b Legend of the fingerprint diagram. The left-side meter reports the quantification of Ig in terms of GU of two WT antigen spots, as indicated. The right-side meter reports the quantification of anti-nucleocapsid antibodies expressed as GU. The radar chart reports the values of RGU for Alpha, Gamma, Delta, and four different Omicron RBD variants. The thick black contour line represents the amount of antibodies binding to WT-RBD taken as reference, hence corresponding to RGU = 1. c Selection of Ig fingerprints obtained for sixteen samples of subjects affected by MIS-C and infected with different variants of SARS-CoV-2, as indicated: WT (first row), Alpha (second row), Delta (third row) and Omicron (fourth row)
Fig. 4
Fig. 4
SARS-CoV-2 variants of infection of MIS-C cases. Percentage of infections by WT (a), Alpha (b), Delta (c), or Omicron (d) variants in Italy (grey shadow) [27]. Each panel also reports the MIS-C samples whose infection was ascribed to the corresponding variant. The data points and the vertical lines indicate the time of hospital admission of the subjects affected by MIS-C. The retrospective assignment of the variant of infection of MIS-C subjects was based on serum antibody fingerprinting (orange diamonds) or on variant prevalence (more than 50% incidence) at the time of hospital admission (yellow circles). Purple squares in panel d represent patients known to be vaccinated, which resulted as WT profile by serum antibody fingerprint
Fig. 5
Fig. 5
Comparison of the severity score of MIS-C with the SARS-CoV-2 variant of infection. The score assigned to each MIS-C case according to the progression of the disease is reported for the different variants responsible for the infection. For each case, the variant displayed in the abscissa was identified by serum antibody fingerprint (orange diamonds) or as the variant of prevalence at the date of hospitalization (yellow circles). Purple squares represent MIS-C subjects vaccinated before the infection. For each variant, the median and the 95% confidence interval are indicated by horizontal bars

Similar articles

References

    1. Davies P, Evans C, Kanthimathinathan HK, et al. (2020) Intensive care admissions of children with paediatric inflammatory multisystem syndrome temporally associated with SARS-CoV-2 (PIMS-TS) in the UK: a multicentre observational study. Lancet Child Adolesc Health 4(9):669–677. 10.1016/S2352-4642(20)30215-7 - PMC - PubMed
    1. Giraldo-Alzate C, Tamayo-Múnera C, López-Barón E, Caicedo-Baez MC, Piñeres-Olave BE (2022) Síndrome inflamatorio multisistémico en niños asociado a COVID-19. Revisión narrativa de la literatura a propósito de un caso. Acta Colombiana de Cuidado Intensivo 22(2):137–148. 10.1016/j.acci.2020.11.002
    1. Dufort EM, Koumans EH, Chow EJ et al (2020) Multisystem inflammatory syndrome in children in New York State. New England Journal of Medicine 383(4):347–358. 10.1056/NEJMoa2021756 - PMC - PubMed
    1. Lin J, Harahsheh AS, Raghuveer G, et al. (2023) Emerging insights into the pathophysiology of multisystem inflammatory syndrome associated with COVID-19 in children. Can J ardiol 39(6):793–802. 10.1016/j.cjca.2023.01.002 - PMC - PubMed
    1. Haslak F, Gunalp A, Kasapcopur O (2023) A cursed goodbye kiss from severe acute respiratory syndrome-coronavirus-2 to its pediatric hosts: multisystem inflammatory syndrome in children. Curr Opin Rheumatol 35(1):6–16. 10.1097/BOR.0000000000000910 - PubMed

Substances

Supplementary concepts