. 2025 May 1;66(5):15.
doi: 10.1167/iovs.66.5.15.

Glucagon-Like Peptide 1 Receptor Agonist Stimulation Inhibits Laser-Induced Choroidal Neovascularization by Suppressing Intraocular Inflammation

Affiliations

Glucagon-Like Peptide 1 Receptor Agonist Stimulation Inhibits Laser-Induced Choroidal Neovascularization by Suppressing Intraocular Inflammation

Akira Machida et al. Invest Ophthalmol Vis Sci. .

Abstract

Purpose: The glucagon-like peptide-1 receptor (GLP-1R), a diabetes therapy target, is expressed in multiple organs and is associated with neuroprotective, anti-inflammatory, and antitumor effects, particularly in cardiac and cerebral tissues. Although GLP-1's role in diabetic and ischemic retinopathies is well-studied, its influence on choroidal neovascularization (CNV) in exudative age-related macular degeneration (AMD) remains unclear. This study explored the effects of GLP-1 on CNV using a laser-induced mouse model.

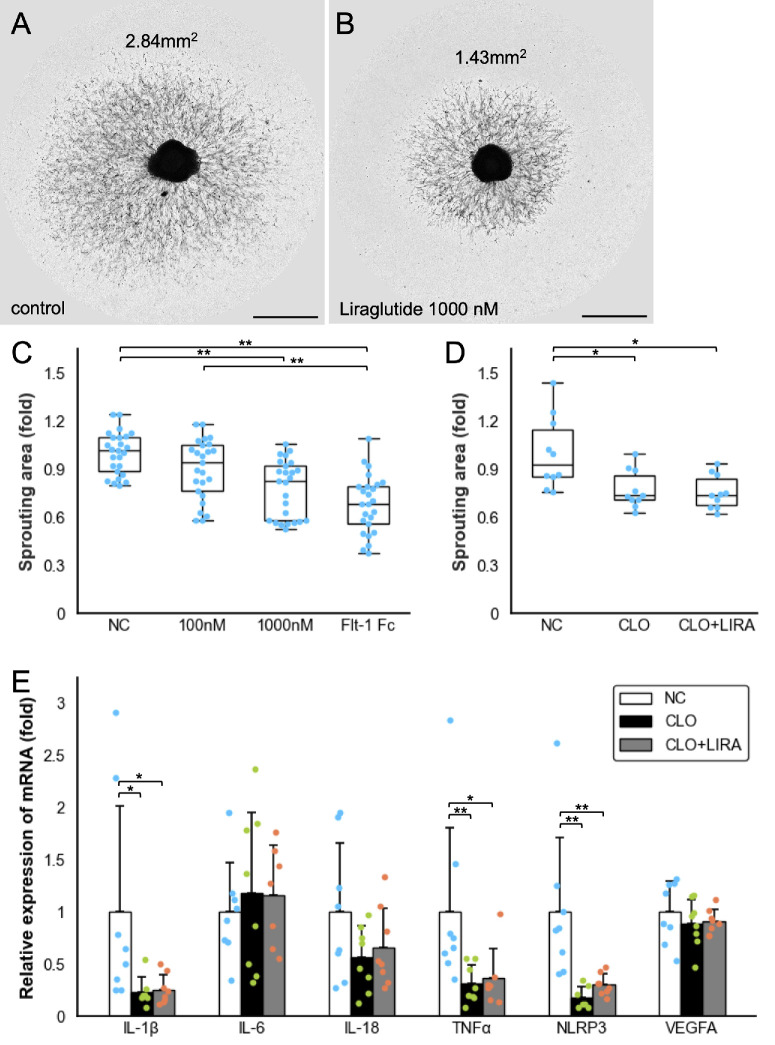
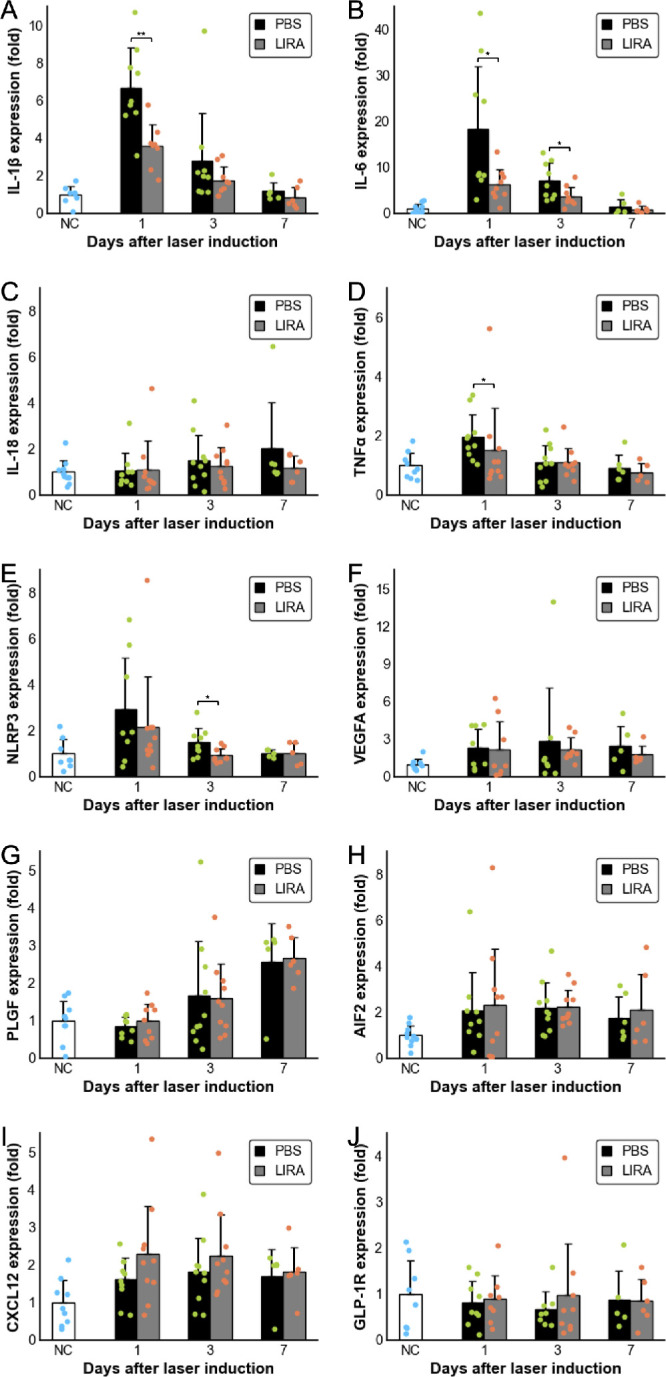
Methods: The anti-angiogenic effects of GLP-1 were tested using ex vivo sprouting assays in 3-week-old C57BL/6J mice. In 6-week-old mice, GLP-1R localization in laser-induced CNV lesions was analyzed via immunohistochemistry. Liraglutide, a GLP-1R agonist, was administered subcutaneously for 7 days or by single intravitreal injection post-laser. Eyeballs collected on days 1 to 7 post-laser were analyzed using RT-qPCR for GLP-1R expression and inflammatory cytokines.

Results: GLP-1R-positive cells were detected in CNV lesions and were expressed in Iba-1-positive activated microglia or macrophages. They also expressed in abnormal retinal pigment epithelial cells and surrounding normal endothelial cells. NOD-like receptor protein 3 (NLRP3) inflammasome signaling was observed near CNV. Liraglutide inhibited angiogenesis in ex vivo assays and significantly reduced CNV formation with both subcutaneous and intravitreal administration. Additionally, Liraglutide inhibited expression of NLRP3, IL-1β, IL-6, and TNF expression compared with healthy controls. Intravitreal GLP-1R antagonist reduced subcutaneous effects.

Conclusions: Liraglutide suppresses CNV formation, likely via NLRP3 inflammasome inhibition. Intraocular GLP-1R appears to mediate anti-CNV effects, supporting GLP-1R agonists as potential adjunctive therapy for exudative AMD and warranting further investigation into its safety and clinical feasibility.


Conflict of interest statement

Disclosure: A. Machida, Chugai Pharmaceutical Co., Ltd. (Tokyo, Japan) (F); K. Suzuki, None; T. Nakayama, None; S. Miyagi, None; Y. Maekawa, None; R. Murakami, None; M. Uematsu, None; T. Kitaoka, Bayer Yakuhin, Ltd. (Osaka, Japan) (F), Novartis Pharma K.K. (Tokyo, Japan) (F), and Santen Pharmaceutical Co., Ltd. (Tokyo, Japan) (F), Santen Pharmaceutical Co., Ltd. (Tokyo, Japan) (F); A. Oishi, Bayer Yakuhin, Ltd. (Osaka, Japan) (F), Santen Pharmaceutical Co., Ltd. (Tokyo, Japan) (F), and Novartis Pharma K.K. (Tokyo, Japan) (F), Santen Pharmaceutical (F), Chugai (F), and Kowa (F)

Figures

Figure 1.
Figure 1.
Representative images of RPE/choroid/sclera tissues and sprouting vessels on day 6 of culture. (A) Control group cultured in medium alone; sprouting area measured at 2.84 mm² using ImageJ software. (B) Group treated with 1000 nM Liraglutide; sprouting area measured at 1.43 mm². Scale bar = 1 mm. (C) Box-and-whisker plot comparing sprouting areas in the negative control (NC), Liraglutide (100 nM, and 1000 nM), and VEGFR1/Flt-1 Fc (100 µg/mL) groups (n = 25). Sprouting areas expressed as fold change versus control. Boxes show interquartile range (IQR); lines indicate median; whiskers extend to values within 1.5 × IQR. (D) Box-and-whisker plot comparing NC, clodronate liposomes (CLO, 100 µL/mL), and CLO + Liraglutide (1000 nM) groups (n = 10). (E) Bar chart of relative mRNA expression in sprouting tissues (RT-PCR) from the same groups as in D (n = 8). Data shown as mean ± SD. The P values were calculated using the Mann–Whitney U test with Bonferroni correction. *P < 0.05; **P < 0.01. IL, interleukin; NLRP3, NOD-like receptor protein 3; TNF, tumor necrosis factor; VEGFA, vascular endothelial growth factor A.
Figure 2.
Figure 2.
Fluorescent staining of paraffin-embedded mouse retina sections post-laser treatment shows isotype control images in panels (A to D), GLP-1R expression (red) in (E to L), and NLRP3 expression in (M–P); CK8/18 highlights RPE structure and rupture zones, with green, indicating CK8/18 or Iba-1 as labeled; magnified views in D, H, L, and P correspond to yellow-boxed regions in C, G, K, and O, respectively, and arrows in H and L mark representative spindle-shaped GLP-1R-positive cells in the CNV area; scale bars are 10 µm for D, H, L, and P, and 100 µm for the other panels. CK8/18, cytokeratin 8/18; CNV, choroidal neovascularization; GCL, ganglion cell layer; GLP-1R, glucagon-like peptide-1 receptor; Iba-1, ionized calcium-binding adapter molecule 1; INL, inner nuclear layer; NLRP3, NOD-like receptor protein 3; ONL, outer nuclear layer; RPE, retinal pigment epithelium.
Figure 3.
Figure 3.
Fluorescent images of paraffin-embedded flat-mounted mouse eye sections on day 7 post-laser show red staining for GLP-1R in (A–H) and for NLRP3 in (I–P); in C, CK8/18 highlights the RPE, and D provides a magnified view near the laser scar with arrowhead indicating GLP-1R-positive abnormal RPE; in E, endothelial cells are stained with CD31, and F shows a magnified view of GLP-1R-positive vascular endothelial cells; G shows Vim staining, and H highlights GLP-1R-positive cells within CNV (arrowheads); L, N, and P are magnified views illustrating NLRP3-positive cells at the laser scar with CK8/18, Iba-1, and Vim staining, respectively; arrowheads in L and N mark nuclei of abnormal RPE and NLRP3/Iba-1 co-expressing cells within the CNV; scale bars = 10 µm (magnified images), 100 µm (others). CD31, cluster of differentiation 31; CK8/18, cytokeratin 8/18; CNV, choroidal neovascularization; GLP-1R, glucagon-like peptide-1 receptor; Iba-1, ionized calcium-binding adapter molecule 1; NLRP3, NOD-like receptor protein 3; RPE, retinal pigment epithelium; Vim, vimentin.
Figure 4.
Figure 4.
Box-and-whisker plots showing CNV area changes 7 days after laser photocoagulation in the CNV mouse model (n = 19.3 ± 3.8 eyes, and 54.6 ± 4.5 scars per group). (A) Shows CNV area after daily subcutaneous injections (SCIs) of PBS or Liraglutide at 250, 500, and 1000 µg/kg, (B) shows CNV area after SCI of Liraglutide at 1000 µg/kg combined with a single intravitreal (IV) injection of PBS or GLP-1R antagonist Ex9 (Exendin 9-39 amide, 2 µg/eye), and (C) shows CNV area following single IV injections of PBS, Liraglutide (0.1, 0.6, or 6 µg), or Flt-1 Fc (VEGFR1/Flt-1 Fc chimera protein, 10 ng). Boxes represent the interquartile range (IQR); horizontal lines indicate the median; whiskers extend to values within 1.5 × IQR. Data are presented as means ± SD, with P values from Mann–Whitney U test and Bonferroni correction, and statistical significance indicated by *P < 0.05 and **P < 0.01; (D) presents representative flat-mounts stained with CD102 showing the optic nerve and CNV lesions, including three successful CNV formations and one failed scar due to incomplete Bruch's membrane disruption; (E–J) show magnified CNV lesions with areas of 30,103 µm² (E, control), 23,301 µm² (F, SCI 250 µg/kg), 12,592 µm² (G, SCI 1000 µg/kg), 24,618 µm² (H, SCI 1000 µg/kg and IV Ex9), 16,992 µm² (I, IV 6 µg), and 11,212 µm² (J, IV Flt-1 Fc); scale bar = 100 µm. CD102, cluster of differentiation 102; CNV, choroidal neovascularization; GLP-1R, glucagon-like peptide-1 receptor; ON, optic nerve; PBS, phosphate-buffered saline; VEGFR1, vascular endothelial growth factor receptor 1.
Figure 5.
Figure 5.
RT-qPCR analysis of inflammatory cytokines, migration-related proteins, GLP-1R, and NLRP3 expression in posterior ocular tissues of laser-induced CNV mice shows relative expression levels as bar graphs compared to untreated controls (day 0); black bars represent PBS-treated mice, and gray bars indicate mice treated daily with subcutaneous Liraglutide (1000 µg/kg) from post-laser day 0 to day 6; tissues were collected on days 1, 3 (n = 8–10), and 7 (n = 5–6); data are presented as mean ± SD, and differences between PBS and Liraglutide groups were assessed using the Mann–Whitney U test, with significance marked as *P < 0.05 and **P < 0.01. (A) IL-1β, (B) IL-6, (C) IL-18, (D) TNFα, (E) NLRP3, (F) VEGFA, (G) PLGF, (H) AIF2, (I) CXCL12, and (J) GLP-1R. AIF, apoptosis-inducing factor; CNV, choroidal neovascularization; CXCL12, C-X-C motif chemokine ligand 12; GLP-1R, glucagon-like peptide-1 receptor; IL, interleukin; NLRP3, NOD-like receptor protein 3; PBS, phosphate-buffered saline; PLGF, placental growth factor; RT-qPCR, reverse transcription polymerase chain reaction; SCI, subcutaneous injections; TNF, tumor necrosis factor; VEGFA, vascular endothelial growth factor A.
Figure 6.
Figure 6.
Changes in body weight (A) and blood glucose (B) over 7 days in mice administered PBS or subcutaneous Liraglutide (1000 µg/kg, n =10), with timepoint 0 marking the time of administration; body weight was recorded every 24 hours, whereas blood glucose was measured at 6, 12, 24, 36, and 48 hours, and then daily; solid lines represent the Liraglutide group (LIRA) means, dotted lines indicate PBS controls; data are shown as mean ± SD, and group differences were assessed by Mann–Whitney U test, with significance denoted as *P < 0.05 and **P < 0.01. PBS, phosphate-buffered saline.

Similar articles

References

    1. Bressler NM. Age-related macular degeneration is the leading cause of blindness. JAMA. 2004; 291: 1900–1901. - PubMed
    1. de Jong PT. Age-related macular degeneration. N Engl J Med. 2006; 355: 1474–1485. - PubMed
    1. Lim LS, Mitchell P, Seddon JM, Holz FG, Wong TY.. Age-related macular degeneration. Lancet. 2012; 379: 1728–1738. - PubMed
    1. Brown DM, Kaiser PK, Michels M, et al. .. Ranibizumab versus verteporfin for neovascular age-related macular degeneration. N Engl J Med. 2006; 355: 1432–1444. - PubMed
    1. Rosenfeld PJ, Brown DM, Heier JS, et al. .. Ranibizumab for neovascular age-related macular degeneration. N Engl J Med. 2006; 355: 1419–1431. - PubMed

MeSH terms

Substances

LinkOut - more resources