. 2025 Apr 17;16(4):424.
doi: 10.3390/insects16040424.

Centrifugation-Based Purification Protocol Optimization Enhances Structural Preservation of Nucleopolyhedrovirus Budded Virion Envelopes

Affiliations

Centrifugation-Based Purification Protocol Optimization Enhances Structural Preservation of Nucleopolyhedrovirus Budded Virion Envelopes

Yong Pan et al. Insects. .

Abstract

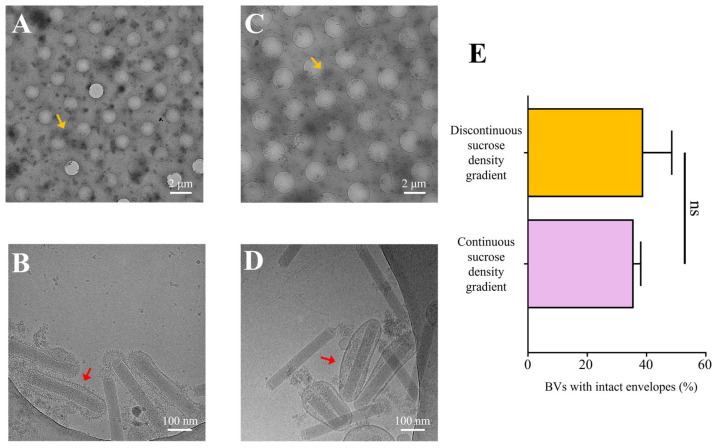
The structural integrity of viral envelopes is a critical determinant of infectivity for enveloped viruses, directly influencing vector stability, functional accuracy of surface-displayed epitopes, and preservation of native conformational states required for membrane protein studies. However, conventional purification methods often disrupt envelope integrity and cause envelope proteins to lose their activity. Here, we systematically compared discontinuous, continuous, and optimized continuous sucrose density gradient centrifugation protocols for purifying Autographa californica multiple nucleopolyhedrovirus (AcMNPV). Through cryo-EM, we demonstrated that our optimized continuous sucrose gradient protocol significantly increased the proportion of AcMNPV budded virions with intact envelopes from 36% to 81%, while preserving the metastable prefusion conformation of the fusion protein GP64. This advancement should prove useful for structural studies of viral envelope proteins and may enhance applications in gene therapy and vaccine development utilizing enveloped viruses.

Keywords: AcMNPV; Alphabaculovirus; baculovirus purification; cryo-EM; sucrose density gradient; viral envelope integrity; virion.


Conflict of interest statement

The authors declare no conflicts of interest.

Figures

Figure 1
Figure 1
Construction, amplification, and crude purification of the recombinant baculovirus. (A) Schematic representation of the pF-polh-eGFP transfer vector. (B–D) Fluorescence images of Sf9 cells infected with P1, P2, and P3 generations of recombinant baculovirus. (E,F) The negative-staining TEM images show at 2300× magnification (E) and 16,000× magnification (F) of BV particles following differential centrifugation.
Figure 2
Figure 2
Sucrose density gradient purification and negative-staining TEM images. (A) The positions of bands formed in the centrifuge tubes after discontinuous sucrose density gradient centrifugation at concentrations of 10%, 20%, 30%, 40%, and 50% (W/V). (B) Diagram illustrating the band positions and sucrose density boundaries from (A), with 30%, 40%, and 50% representing sucrose densities. The black lines indicate the band positions, and the red and orange boxes correspond to panels (C) and (D), respectively. (C,D) Negative-staining TEM images of the two bands shown in (B), 11,500× magnification. The red arrows indicate BV nucleocapsids, and the orange arrows indicate the aggregated nucleocapsids.
Figure 3
Figure 3
Continuous sucrose density gradient purification and negative-staining TEM images. (A) Positions of bands formed in the centrifuge tubes after continuous sucrose density gradient centrifugation at concentrations ranging from 10% to 60% (W/V). (B) Diagram illustrating the band positions from (A), with pink and turquoise boxes indicating Fraction 1 and Fraction 2, corresponding to panels (C) and (D), respectively. (C,D) Negative-staining TEM images of the two bands shown in (B), 11,500× magnification. The red arrows indicate BV nucleocapsids, and the orange arrows indicate the aggregated nucleocapsids.
Figure 4
Figure 4
Cryo-EM samples of BV particles purified by sucrose density gradient centrifugation. (A,C) Vitrified ice images of BV particles frozen after discontinuous and continuous sucrose density gradient purification, respectively (800× magnification). The orange arrows indicate aggregated BV particles. (B,D) Images showing the morphology of BV particles from (A) and (C), respectively (25,000× magnification). The red arrows indicate BV particles. (E) Average percentage of complete virus particles observed in random field of view from cryo-EM samples of BV particles purified by both discontinuous and continuous sucrose density gradients. Error bars represent the SD from the mean of independent replicates (n  =  3), (ns stands for not significant).
Figure 5
Figure 5
Optimized continuous sucrose gradient purification and cryo-EM analysis of intact virus particles. (A) Positions of the bands formed in the centrifuge tube after centrifugation of a continuous sucrose density gradient ranging from 10% to 50% (W/W). (B) Schematic representation of the band positions indicated in (A), with the band positions marked by the green box. (C) Vitrified ice image of the cryo-EM sample corresponding to the bands in (B), 800x magnification. The red arrows indicate uniformly distributed BV particles. (D) Proportion of intact BV particles in cryo-EM images after purification of discontinuous sucrose gradients of 10−50% (W/V), continuous sucrose gradients of 10−60% (W/V), and 15−50% (W/W). Error bars represent the SD from the mean of independent replicates (n  =  3), (* p < 0.05, ** p < 0.01). (E) Cyro-EM image of BV particles, 50,000× magnification. The red arrows indicate intact BV particles.
Figure 6
Figure 6
GP64 protein purification and cryo-EM data analysis. (A) Size-exclusion chromatography (SEC) profile of BV envelope. The X-axis represents elution volume in milliliters, while the Y-axis represents absorbance at 280 nm. Four representative peak fractions were marked. (B) Western blot analysis of the four peak fractions in the SEC profile. (C) Representative 2D class averages of particles for prefusion GP64.
Figure 7
Figure 7
Cryo-EM density maps corresponding to prefusion GP64 (PDB 8YG6). (A,B) Side and top view of prefusion GP64 density map. (C,D) Side and top views showing the fit of prefusion GP64 (PDB 8YG6) with this density map. The three chains of prefusion GP64 are marked in dodger blue, orange red, and cyan, respectively.

References

    1. Knipe D.M., Howley P.M. Fields Virology. 6th ed. Wolters Kluwer Health—Lippincott Williams & Wilkins; Philadelphia, PA, USA: 2013.
    1. Shulla A., Randall G. (+) RNA Virus Replication Compartments: A Safe Home for (Most) Viral Replication. Curr. Opin. Microbiol. 2016;32:82–88. doi: 10.1016/j.mib.2016.05.003. - DOI - PMC - PubMed
    1. Grove J., Marsh M. The Cell Biology of Receptor-Mediated Virus Entry. J. Cell Biol. 2011;195:1071–1082. doi: 10.1083/jcb.201108131. - DOI - PMC - PubMed
    1. Mateu M.G. Assembly, Stability and Dynamics of Virus Capsids. Arch. Biochem. Biophys. 2013;531:65–79. doi: 10.1016/j.abb.2012.10.015. - DOI - PubMed
    1. Jones J.E., Le Sage V., Lakdawala S.S. Viral and Host Heterogeneity and Their Effects on the Viral Life Cycle. Nat. Rev. Microbiol. 2021;19:272–282. doi: 10.1038/s41579-020-00449-9. - DOI - PMC - PubMed

LinkOut - more resources