. 2025 Apr 15;13(4):409.
doi: 10.3390/vaccines13040409.

Dynamics of SARS-CoV-2 IgG in Nursing Home Residents in Belgium Throughout Three BNT162b2 Vaccination Rounds: 19-Month Follow-Up

Affiliations

Dynamics of SARS-CoV-2 IgG in Nursing Home Residents in Belgium Throughout Three BNT162b2 Vaccination Rounds: 19-Month Follow-Up

Eline Meyers et al. Vaccines (Basel). .

Abstract

Background/objectives: This study mapped antibody dynamics across three COVID-19 vaccination rounds (primary course, first, and second booster with BNT162b2) in Belgian nursing home residents (NHRs).

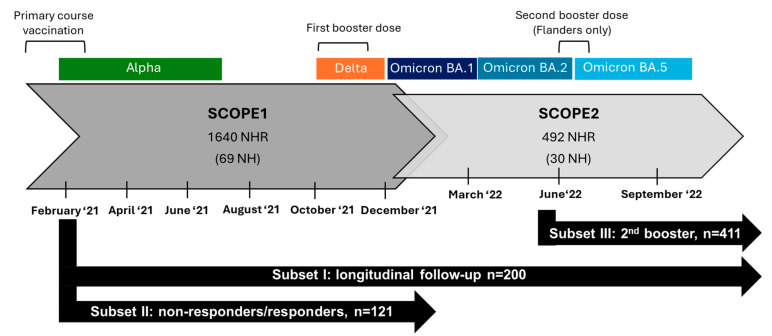
Methods: Within a national SARS-CoV-2 serosurveillance study (February 2021-September 2022) across Belgian nursing homes, dried blood spots were collected, on which anti-spike SARS-CoV-2 IgG antibodies were quantified by ELISA in international units/mL (IU/mL). Sociodemographic data were collected at the study start and infection history and vaccination data at each sampling round.

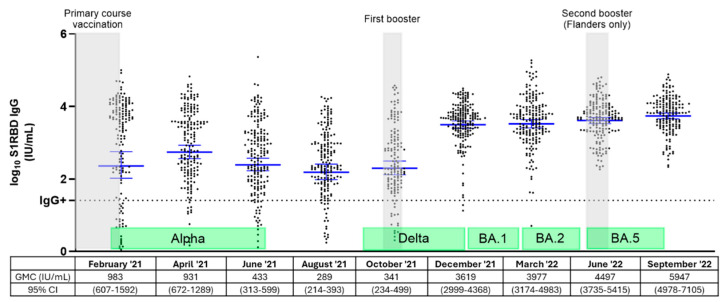
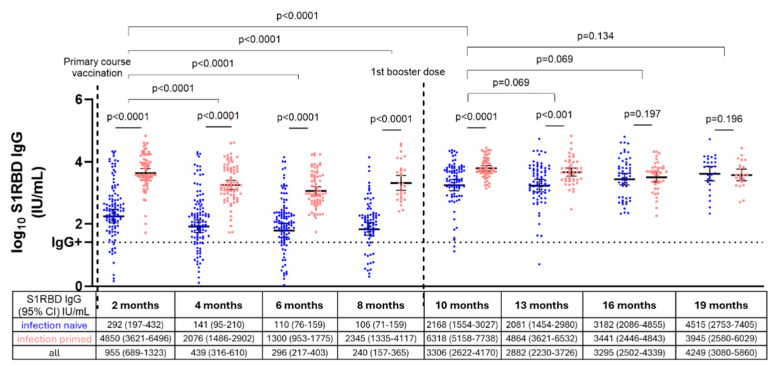
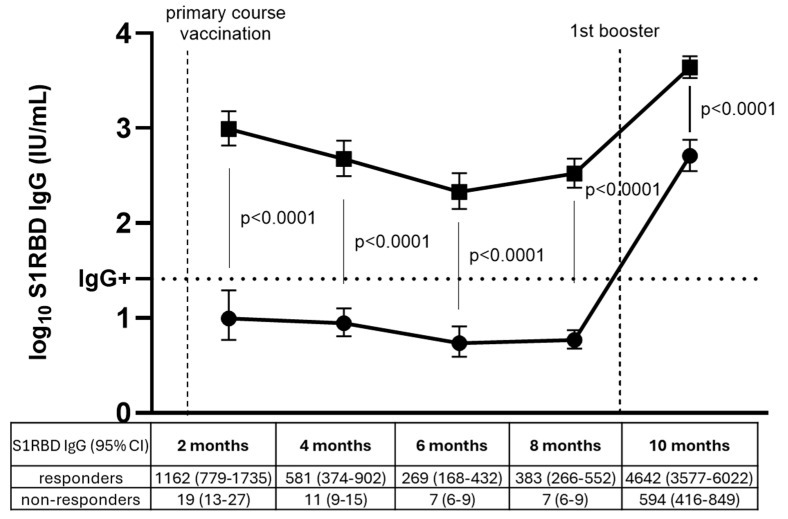
Results: Infection-naïve NHRs had low antibody levels after primary course vaccination (geometric mean concentration (GMC) 292 IU/mL, 95% confidence interval (95% CI): 197-432), but increased tenfold after first booster (GMC 2168 IU/mL, 95% CI: 1554-3027). While antibodies among NHRs significantly declined within six months after primary vaccination (p < 0.0001), they remained stable for nine months post-booster (p > 0.05). Among primary vaccine non-responders, 92% (95% CI: 82-97%) developed antibodies after the first booster (GMC 594 IU/mL, 95% CI: 416-849), though tenfold lower than initial responders (GMC 4642 IU/mL, 95% CI: 3577-6022).

Conclusions: These findings demonstrate that NHRs require tailored vaccination, prioritizing repeated immunization to improve serological outcomes in poor responders such as infection-naive NHRs. Regular immune monitoring could aid in implementing evidence-based vaccine strategies, ensuring optimal protection for vulnerable populations against SARS-CoV-2 and other infectious threats.

Keywords: COVID-19 vaccination; antibody dynamics; booster; nursing home residents.


Conflict of interest statement

The authors have no conflicts of interest to declare.

Figures

Figure 1
Figure 1
Overview of the subsets (black arrows) presented in this publication within a national SARS-CoV-2 serosurveillance study in Belgian nursing homes (grey arrows). Sampling times in the study, epidemiological waves in Belgium with respective dominant variant of concern [15,16], and timing of vaccination campaigns in nursing homes are presented. NHR: nursing home residents, NH: nursing homes.
Figure 5
Figure 5
S1RBD IgG antibody levels before and after administration of two booster doses versus a single booster dose in nursing home residents (Flanders versus Brussels/Wallonia), n = 411. Blue: nursing home residents (NHRs) who received a second booster dose in the summer of 2022 (Flanders); N= 181, NHRs who received a second booster before sampling in June 2022 (n = 69) and NHRs who had a breakthrough infection between June and September 2022 (n = 5) were excluded. Black: NHRs who did not receive a second booster dose in the summer of 2022 (Brussels/Wallonia); N = 230 NHRs who had a breakthrough infection between June and September 2022 (n = 7) were excluded. S1RBD IgG geometric mean concentrations (GMC) in IU/mL with 95% CI are presented below each timepoint per group. Log10 GMCs are presented by horizontal lines and error bars. The horizontal dashed line represents the cutoff for SARS-CoV-2 seropositivity (log10 26 IU/mL). CI: confidence interval. IU/mL: international units/mL.
Figure 2
Figure 2
Overview of S1RBD IgG antibody levels among NHRs (n = 200) in Belgium from February 2021 to September 2022. S1RBD IgG geometric mean antibody concentrations (GMC) in IU/mL and 95% confidence intervals are presented below each timepoint and presented as log10 GMCs by blue lines with error bars. The horizontal dashed line represents the cutoff for SARS-CoV-2 seropositivity (log10 26 IU/mL). Grey bars indicate the timing of the vaccination rounds in the nursing homes included in the subset. Green bars indicate epidemiological waves in Belgium with the respective dominant variant of concern [15,16]. IU/mL: international units/mL; CI: confidence interval. BA.1: Omicron BA.1; BA.2: Omicron BA.2; and BA.5: Omicron BA.5.
Figure 3
Figure 3
S1RBD IgG dynamics in infection-naive (n = 119) and infection-primed NHRs (n = 81) after primary course vaccination and first booster administration. Blue dots represent infection-naive NHRs, red dots represent infection-primed NHRs. S1RBD IgG geometric mean concentrations (GMC) in IU/mL with 95% CI are presented per timepoint for all subjects and separate for infection-naive/infection-primed subjects below the graph and log10 GMCs by horizontal lines and error bars for the latter. The mixed effects model and unpaired t-tests were applied. The first timepoint after vaccination was considered as baseline. The lower lines with p-values represent the comparison between infection-naive and infection-primed NHRs within one timepoint, while upper lines represent comparisons between timepoints for infection-naive and infection-primed NHRs combined. NHRs with a breakthrough infection and those who received a second booster were excluded at that respective timepoint. The horizontal dashed line represents the cutoff for SARS-CoV-2 seropositivity (log10 26 IU/mL). IU/mL: international units/mL. CI: confidence interval.
Figure 4
Figure 4
Geometric mean S1RBD IgG concentrations among responders (squares) (n = 60) and non-responders (dots) (n = 61) to primary course vaccination before and after first booster dose. Geometric mean S1RBD IgG concentrations (GMCs) in IU/mL with 95% confidence intervals are presented under each timepoint per group. Log10 GMCs are represented by dots among vaccine non-responders and squares among responders after primary course vaccination (month 2, 4, 6, and 8) and after the first booster dose (month 10) with error bars (95% CI). SARS-CoV-2 breakthrough cases were excluded from the analysis after the timepoint of infection (n = 23; 14 among non-responders, 9 among responders). Non-responders who remained seronegative after the first booster were excluded from this comparison for month 10. P-values are shown for the comparison between responders and non-responders per timepoint. The horizontal dashed line represents the cutoff for SARS-CoV-2 seropositivity (log10 26 IU/mL). IU/mL: international units/mL. CI: confidence interval.

Similar articles

References

    1. Zhang X., Dou Q., Zhang W., Wang C., Xie X., Yang Y., Zeng Y. Frailty as a Predictor of All-Cause Mortality Among Older Nursing Home Residents: A Systematic Review and Meta-analysis. J. Am. Med. Dir. Assoc. 2019;20:657–663.e654. doi: 10.1016/j.jamda.2018.11.018. - DOI - PubMed
    1. Leece P., Whelan M., Costa A.P., Daneman N., Johnstone J., McGeer A., Rochon P., Schwartz K.L., Brown K.A. Nursing home crowding and its association with outbreak-associated respiratory infection in Ontario, Canada before the COVID-19 pandemic (2014-19): A retrospective cohort study. Lancet Healthy Longev. 2023;4:e107–e114. doi: 10.1016/S2666-7568(23)00018-1. - DOI - PMC - PubMed
    1. Catteau D.S., Haarhuis L., Vandael F., Stouten E., Litzroth V., Wyndham A., Sciensano T.C. Surveillance van de COVID-19 Vaccinatie in Belgische Woonzorgcentra. Resultaten tot 24 Maart 2021. Sciensano; Brussels, Belgium: 2021.
    1. Meyers E., De Rop L., Engels F., Gioveni C., Coen A., De Burghgraeve T., Digregorio M., Van Ngoc P., De Clercq N., Buret L., et al. Follow-Up of SARS-CoV-2 Antibody Levels in Belgian Nursing Home Residents and Staff Two, Four and Six Months after Primary Course BNT162b2 Vaccination. Vaccines. 2024;12:951. doi: 10.3390/vaccines12080951. - DOI - PMC - PubMed
    1. Kolarić B., Ambriović-Ristov A., Tabain I., Vilibić-Čavlek T. Waning immunity six months after BioNTech/Pfizer COVID-19 vaccination among nursing home residents in Zagreb, Croatia. Croat. Med. J. 2021;62:630–633. doi: 10.3325/cmj.2021.62.630. - DOI - PMC - PubMed

LinkOut - more resources