. 2025 Apr 9;30(8):1684.
doi: 10.3390/molecules30081684.

Alteration of Sulfur-Bearing Silicate-Phosphate (Agri)Glasses in Soil Environment: Structural Characterization and Chemical Reactivity of Fertilizer Glasses: Insights from 'In Vitro' Studies

Affiliations

Alteration of Sulfur-Bearing Silicate-Phosphate (Agri)Glasses in Soil Environment: Structural Characterization and Chemical Reactivity of Fertilizer Glasses: Insights from 'In Vitro' Studies

Anna Berezicka et al. Molecules. .

Abstract

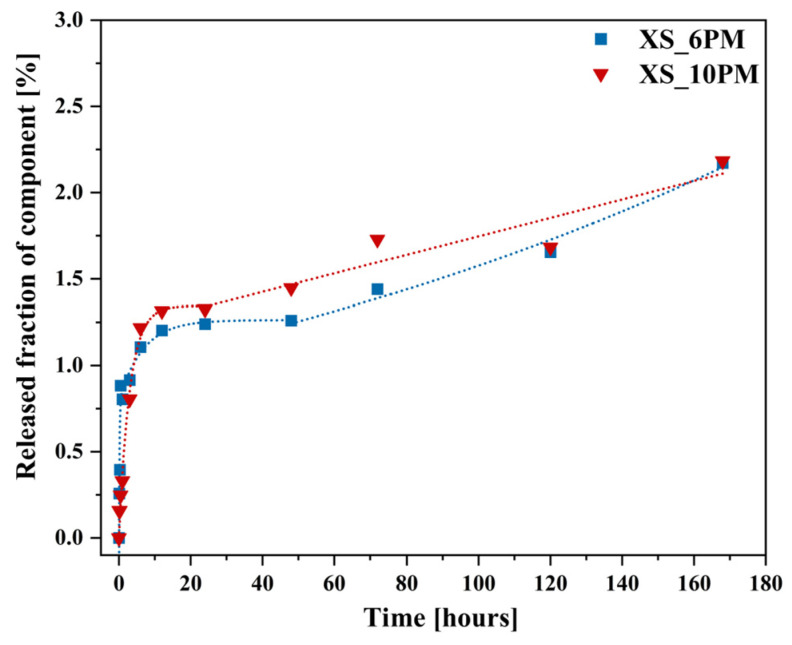
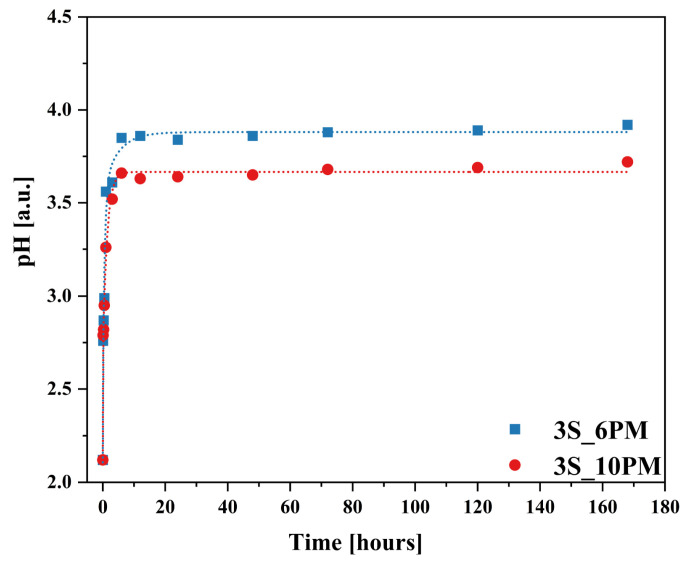
Vitreous carriers of essential nutrients should release elements in response to plant demand, minimizing over-fertilization risks. This study focused on designing and characterizing sulfate-bearing slow-release fertilizers based on four glass series (41SiO2∙6(10)P2O5∙20K2O-33(29)MgO/CaO/MgO + CaO) with increasing sulfate content. Structural analysis identified a network dominated by QSi2 units, with some QSi3 species and isolated QP0 units. This fragmented structure resulted in high solubility in acidic environments while maintaining water resistance. Such dual behavior is a direct consequence of the delicate balance between depolymerized silicate chains and isolated orthophosphate units, which ensure rapid ion exchange under acidic conditions while preventing uncontrolled leaching in neutral media. Nutrient leaching depended on SO3 content, affecting matrix rigidity, and on the type of alkaline earth modifier and P2O5 content. Dissolution kinetics showed an initial rapid release phase, followed by stabilization governed by silicate hydrolysis. Thermal analysis linked network flexibility to dissolution behavior-CaO promoted an open structure with high SiO2 release, MgO increased rigidity, while their co-addition reduced ion diffusion and silica dissolution. The thermal behavior of the glasses provided indirect insight into their structural rigidity, revealing how compositional variations influence the mechanical stability of the network. This structural rigidity, inferred from glass transition and crystallization phenomena, was found to correlate with the selective dissolution profiles observed in acidic versus neutral environments. These results reveal complex interactions between composition, structure, and nutrient release, shaping the agricultural potential of these glasses.

Keywords: dissolution kinetics; glass structure; nutrient leaching; slow-release fertilizers; sulfate-bearing glasses.


Conflict of interest statement

The authors declare no conflicts of interest.

Figures

Figure 1
Figure 1
Diffraction patterns of selected samples, including the base composition and those loaded with 3 mol.% sulfate species, from all tested glass formulations.
Figure 2
Figure 2
DSC curves of samples from all tested systems: base glasses and those doped with 3 mol.% sulfate. Note: Tg values were determined from the inflection points of the DSC signals (right upper corner).
Figure 3
Figure 3
Variation of the Angell parameter across the studied glass compositions. The nominal SO3 content is used on the x-axis as a reference to distinguish between the samples and does not represent the experimentally measured sulfur concentrations (see Table 3 in Section 4.1).
Figure 4
Figure 4
29Si (a) and 31P (b) MAS-NMR spectra of the studied glasses (base and those loaded with 3 mol.% sulfate species) for all tested compositions. Spinning sidebands are marked with asterisks.
Figure 5
Figure 5
Representative 29Si (a) and 31P (b) MAS-NMR spectra of the selected 3S_6PMC sample. The original experimental spectrum is shown in red, while the fitted envelope obtained from spectral deconvolution is marked in black.
Figure 5
Figure 5
Representative 29Si (a) and 31P (b) MAS-NMR spectra of the selected 3S_6PMC sample. The original experimental spectrum is shown in red, while the fitted envelope obtained from spectral deconvolution is marked in black.
Figure 6
Figure 6
Calculated network connectivity values for the studied glass compositions. The data are plotted against the nominal SO3 content, used here solely to distinguish between the samples. Please note that these values do not represent experimentally measured sulfur concentrations, which are provided in Table 3 (see Section 4.1). The NC value for the 5S_6PMC glass is not available due to the specimen’s instability, which prevented the acquisition of both 29Si and 31P MAS NMR spectra.
Figure 7
Figure 7
Percentage of SiO2 released into the citric acid solution for all studied systems.
Figure 8
Figure 8
Percentage of SO3 (a) and P2O5 (b) released into the citric acid solution for all studied systems.
Figure 8
Figure 8
Percentage of SO3 (a) and P2O5 (b) released into the citric acid solution for all studied systems.
Figure 9
Figure 9
Percentage of K2O (a) and MgO/CaO (b) released into the citric acid solution for all studied systems.
Figure 10
Figure 10
Percentages of glass elements released into distilled water for all studied systems.
Figure 11
Figure 11
Ion dissolution profiles of 3S_6PM (a) and 3S_10PM (b) glasses in 2% citric acid under dynamic leaching conditions as a function of immersion time, accompanied by micrographs from selected surface points, illustrating surface changes at various stages of the experiment. It should be stressed that the percentages of K2O and P2O5 released in the case of XS_6PM system were noted to slightly exceed 100% due to the limitations of the XRF analysis (in the pearl method used, the samples were heated to 1100 °C, potentially leading to the volatility of certain glass components and resulting in inaccuracies in the measured values). The micrographs were taken at 1000× magnification, with the scale bar corresponding to 100 µm.
Figure 12
Figure 12
Micrographs and corresponding EDS spectra of 3S_6PM (a) and 3S_10PM (b) samples at different stages of long-term dissolution in 2% citric acid under dynamic leaching conditions: 5 min, 1 h, and 168 h. The micrographs were taken at 10,000× magnification, with the scale bar corresponding to 20 µm. The colors of the EDS spectra (yellow and red) correspond to the marked points in the respective micrographs, where the analyses were performed.
Figure 13
Figure 13
SiO2 dissolution profiles of 3S_6PM and 3S_10PM glasses in 2% citric acid under dynamic leaching conditions as a function of immersion time.
Figure 14
Figure 14
Mass loss curves of 3S_6PM and 3S_10PM glasses under dynamic leaching in a citric acid solution as a function of immersion time.
Figure 15
Figure 15
pH-change profiles of 3S_6PM and 3S_10PM glasses under dynamic leaching in citric acid as a function of immersion time.
Figure 16
Figure 16
Ion dissolution profiles of 3S_6PM (a) and 3S_10PM (b) glasses in distilled water under dynamic leaching conditions as a function of immersion time, accompanied by micrographs and EDS data from selected surface points, illustrating surface changes at various stages of the experiment. The absence of [SO42−] ion release profiles in the case of the 3S_10PM sample was due to the concentrations of this component in its leachate being below the sulfur detection limit of the ICP-OES method. The micrographs were taken at 1000× magnification, with the scale bar corresponding to 100 µm.
Figure 16
Figure 16
Ion dissolution profiles of 3S_6PM (a) and 3S_10PM (b) glasses in distilled water under dynamic leaching conditions as a function of immersion time, accompanied by micrographs and EDS data from selected surface points, illustrating surface changes at various stages of the experiment. The absence of [SO42−] ion release profiles in the case of the 3S_10PM sample was due to the concentrations of this component in its leachate being below the sulfur detection limit of the ICP-OES method. The micrographs were taken at 1000× magnification, with the scale bar corresponding to 100 µm.
Figure 17
Figure 17
pH-change profiles of 3S_6PM and 3S_10PM glasses under dynamic leaching in distilled water as a function of immersion time.
Figure 18
Figure 18
Diffraction patterns of 1S_10PC and 1S_10PMC samples.

Similar articles

References

    1. Fiantis D., Ginting F.I., Gusnidar, Nelson M., Minasny B. Volcanic Ash, insecurity for the people but securing fertile soil for the future. Sustainability. 2019;11:3072. doi: 10.3390/su11113072. - DOI
    1. Neall V.E. Encyclopaedia of Life Support Systems. Volume 1. UNESCO; Paris, France: 2006. Land use and land cover; pp. 1–24.
    1. Stoch L., Wacławska I., Szumera M. Phospho-silicate glasses, self-degradable in environment conditions. Adv. Mater. Res. 2008;39–40:335–340. doi: 10.4028/www.scientific.net/AMR.39-40.335. - DOI
    1. Dakora F.D., Phillips D.A. Root exudates as mediators of mineral acquisition in low-nutrient environments. Plant Soil. 2002;245:35–47. doi: 10.1023/A:1020809400075. - DOI
    1. Vega N.W.O. A review on beneficial effects of Rhizosphere bacteria on soil nutrient availability and plant nutrient uptake. Nac. Agron.-Medellín. 2007;60:3621–3643.

LinkOut - more resources