. 2025 May 7;21(5):e1013027.
doi: 10.1371/journal.pcbi.1013027. eCollection 2025 May.

scSDNE: A semi-supervised method for inferring cell-cell interactions based on graph embedding

Affiliations

scSDNE: A semi-supervised method for inferring cell-cell interactions based on graph embedding

Chenchen Jia et al. PLoS Comput Biol. .

Abstract

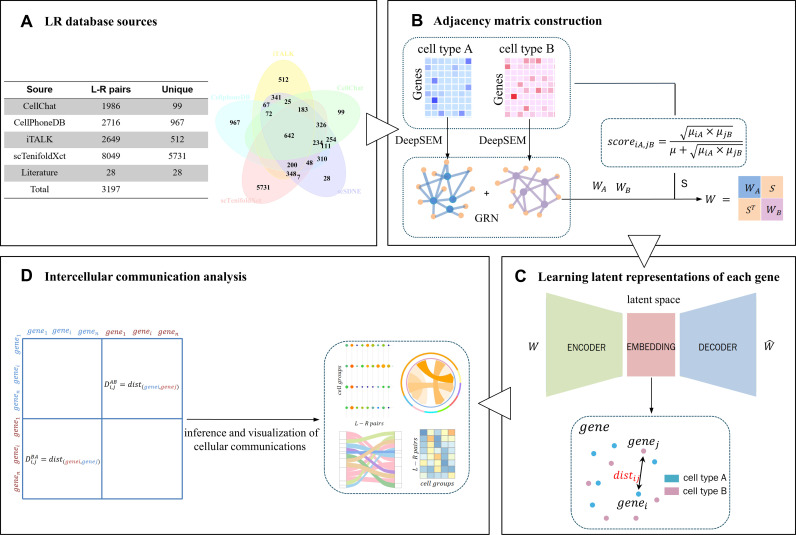
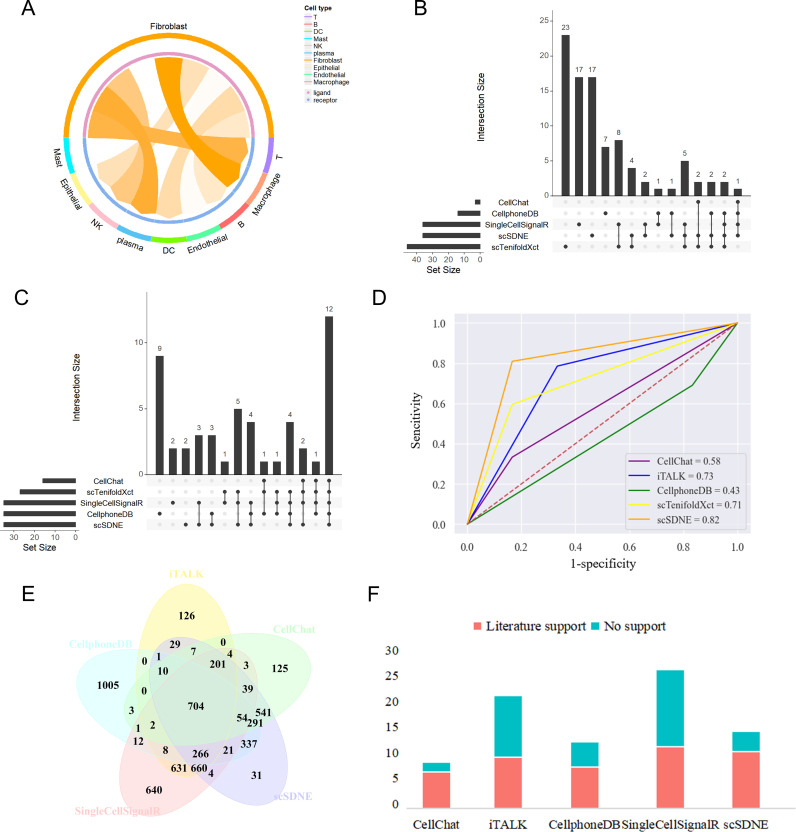
As a fundamental characteristic of multicellular organisms, cell-cell communication is achieved through ligand-receptor (L-R) interactions, enabling the exchange of information and revealing the diversity of biological processes and cellular functions. To gain a comprehensive understanding of these complex interaction mechanisms, we constructed a manually curated L-R interaction database and developed a semi-supervised graph embedding model called scSDNE for inferring cell-cell interactions mediated by L-R interactions. scSDNE model utilizes the power of deep learning to map genes from interacting cells into a shared latent space, allowing for a nuanced representation of their relationships. Leveraging the prior information provided by database, scSDNE can infer significant L-R pairs involved in intercellular communication. Experiments on real single-cell RNA sequencing (scRNA-seq) datasets demonstrate that our method detects interactions with a high degree of reliability compared with other methods. More importantly, the model integrates gene regulation information within cells to enhance the accuracy and biological interpretability of the inferences. Our method provides a more comprehensive view of cell-cell interactions, offering new insights into complex intercellular communication.


Conflict of interest statement

The authors have declared that no competing interests exist.

Figures

Fig 1
Fig 1. Overview of scSDNE.
(A) Overview of the LRdb. (B) Construction of adjacency matrix (including adjacency matrices of gene regulatory networks and crosstalk score matrices of cell types). (C) Learning of latent representations for each gene pair through graph embedding. (D) Detection and visualization of significant L-R pairs based on the distances observed in the latent space.
Fig 2
Fig 2. Identification of intercellular communication in diseased human skin.
(A) Dot plot displays the predicted interactions between Inflam. FIB and the specified immune cell types. The color of the points reflects the communication probability, while the size of the points represents the calculated p-value. Blank areas signify a communication probability of zero. (B) Violin plot shows the expression levels of genes IL-13 and THBS2 across samples. (C) Circos plot depicts intercellular communication from Inflam. FIB to other cell types. The arrow points from the ligands in the sending cells to the receptors in the receiving cells. The thickness of the line and the size of the arrow reflect the expression of the ligands and receptors, respectively. (D) Illustration of representative ligands from Inflam. FIB to other cell types.
Fig 3
Fig 3. Comparison analysis of intercellular communication between HCC and tumor-adjacent tissues.
(A) Overview of the cell clusters derived from scRNA-seq data of tumor-adjacent and HCC tissues (UMAP). (B) Heatmap illustrates intercellular communication from hepatocytes to other immune cell types (normalized score greater than 0. 5). (C) Dot plot shows the predicted interactions between hepatocyte and the specified immune cell types in both HCC and tumor-adjacent tissues. (D) Enrichment analysis of the KEGG pathways. (E) Comparison of the number of significant L-R pairs from hepatocytes to immune cell types. (F) Sankey plot represents intercellular communication from hepatocytes to Mono/Macro in HCC where the thickness of the connecting bands reflects the intensity of L-R interactions.
Fig 4
Fig 4. A case study on the application of scSDNE in the human lymph node microenvironment.
(A) Spatial plots show cell abundance (color intensity) for the specified cell types. (B) Dot plot shows the predicted interactions between the immune cell types. (C) The edge width represents the strength of intercellular communication between the cell types. (D) Circos plot. The arrow points from the ligands in the sending cells to the receptors in the receiving cells.
Fig 5
Fig 5. Comparison of the performance of scSDNE with CellChat, CellPhoneDB, iTALK and scTenifoldXct on the scRNA-seq dataset of gastric cancer (from fibroblasts to macrophages).
(A) Circos plot depicts the strength of intercellular communication from fibroblasts to other cell types in TME. (B) UpSetR plot illustrates the results from the five tools utilizing their respective LR database. The horizontal bar graph in the lower left corner represents the total number of L-R pairs detected by each method. The intercellular communication results obtained by the different methods are represented by multiple black dots and connecting lines, and the number of intersections displayed in the bar graph above. (C) UpSetR plot shows the results from the five tools using a common LRdb. (D) ROC curves plot depicts the performance of the five methods in assessing intercellular communication. (E) Overlap analysis of the LR database. (F) Comparison of literature support rates for scSDNE using different databases.

Similar articles

References

    1. Ma F, Zhang S, Song L, Wang B, Wei L, Zhang F. Applications and analytical tools of cell communication based on ligand-receptor interactions at single cell level. Cell Biosci. 2021. Jul 3;11(1):121. doi: 10.1186/s13578-021-00635-z - DOI - PMC - PubMed
    1. Peng L, Wang F, Wang Z, Tan J, Huang L, Tian X, et al.. Cell-cell communication inference and analysis in the tumour microenvironments from single-cell transcriptomics: data resources and computational strategies. Brief Bioinform. 2022. Jul 18;23(4). doi: 10.1093/bib/bbac234 - DOI - PubMed
    1. Zhang Y, Liu T, Hu X, Wang M, Wang J, Zou B, et al.. CellCall: integrating paired ligand-receptor and transcription factor activities for cell-cell communication. Nucleic Acids Res. 2021;49(15):8520–8534. doi: 10.1093/nar/gkab638 - DOI - PMC - PubMed
    1. Ramilowski JA, Goldberg T, Harshbarger J, Kloppmann E, Lizio M, Satagopam VP, et al.. A draft network of ligand-receptor-mediated multicellular signalling in human. Nat Commun. 2015;6:7866. doi: 10.1038/ncomms8866 - DOI - PMC - PubMed
    1. Armingol E, Officer A, Harismendy O, Lewis NE. Deciphering cell-cell interactions and communication from gene expression. Nat Rev Genet. 2021. Feb;22(2):71–88. doi: 10.1038/s41576-020-00292-x - DOI - PMC - PubMed

LinkOut - more resources