Comparative Study
. 2025 Apr 13;30(8):1742.
doi: 10.3390/molecules30081742.

Comparative Evaluation of Cytotoxic and Apoptotic Effects of Natural Compounds in SH-SY5Y Neuroblastoma Cells in Relation to Their Physicochemical Properties

Affiliations
Comparative Study

Comparative Evaluation of Cytotoxic and Apoptotic Effects of Natural Compounds in SH-SY5Y Neuroblastoma Cells in Relation to Their Physicochemical Properties

Antonella Rosa et al. Molecules. .

Abstract

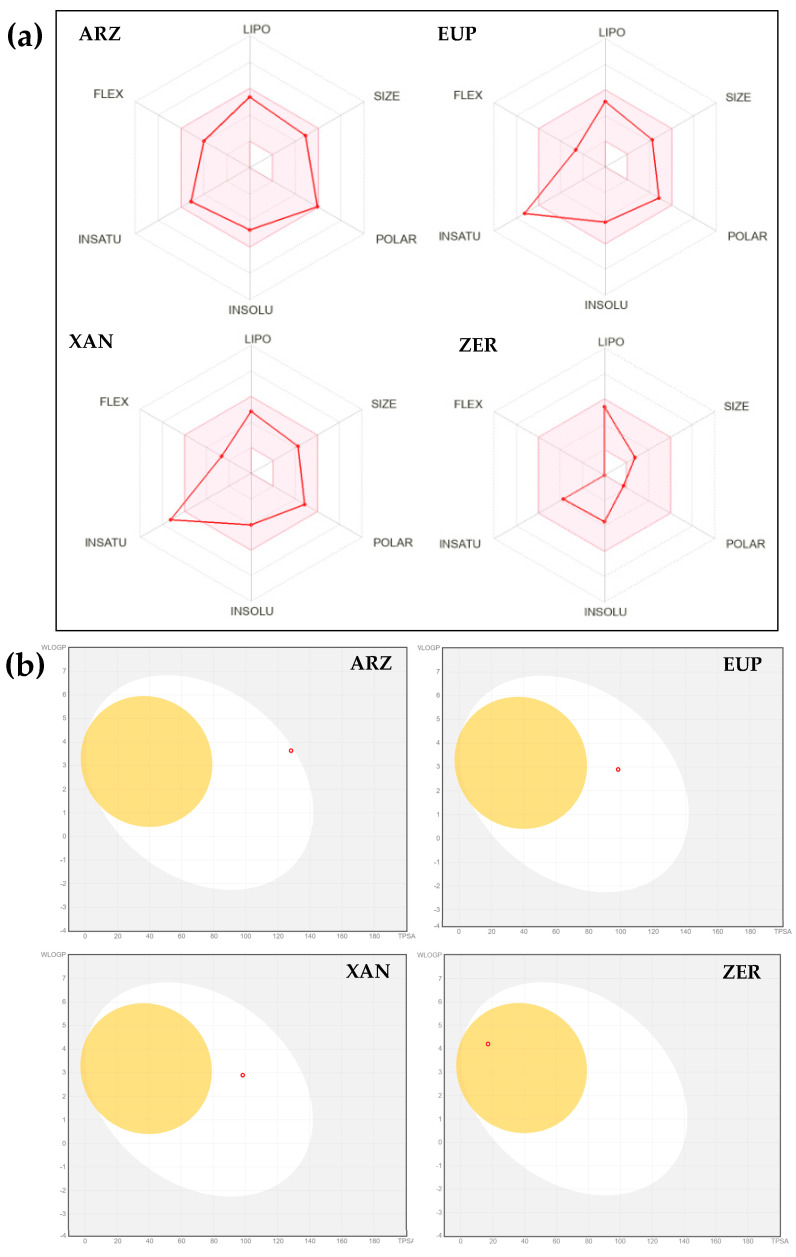
The cytotoxic and apoptotic properties of four bioactive natural compounds, the prenylated α-pyronephloroglucinol heterodimer arzanol (ARZ), the methoxylated flavones eupatilin (EUP) and xanthomicrol (XAN), and the sesquiterpene zerumbone (ZER), were compared in SH-SY5Y human neuroblastoma cells to assess their potential as neuroblastoma-specific therapeutics. EUP, XAN, and ZER (2.5-100 μM) exerted marked significant cytotoxicity (MTT assay) and morphological changes after 24 h of incubation, following the order XAN > ZER > EUP > ARZ (no toxic effect). The propidium iodide fluorescence assay (PI, red fluorescence) and NucView® 488 assay (NV, green fluorescence) evidenced a significant increase in the apoptotic cell number, vs. controls, in SH-SY5Y cells pre-incubated for 2 h with the compounds, in the following order of apoptotic potency: XAN > EUP > ZER > ARZ. The PubChem database and freely accessible web tools SwissADME, pkCSM-pharmacokinetics, and SwissTargetPrediction were used to assess the physicochemical/pharmacokinetic properties and potential protein targets of the compounds. At 50 μM, a positive correlation (r = 0.917) between values of % viability reduction and % human intestinal absorption (bioavailability) was observed, indicating a marked contribution of compound membrane permeability to cytotoxicity in SH-SY5Y cells. The capacity of compounds to induce apoptosis emerged as inversely correlated to the computed lipophilicity (r = -0.885).

Keywords: SH-SY5Y neuroblastoma; apoptosis; arzanol; cytotoxicity; eupatilin; xanthomicrol; zerumbone.


Conflict of interest statement

The authors declare no conflicts of interest.

Figures

Figure 1
Figure 1
Chemical structures of arzanol (ARZ), eupatilin (EUP), xanthomicrol (XAN), and zerumbone (ZER).
Figure 2
Figure 2
(a) Viability, expressed as % of the control (untreated cells, 0), induced by incubation for 24 h with different amounts of DMSO (0.025 to 2% v/v) in cancer SH-SY5Y cells (MTT assay). Data are presented as mean and standard deviation (SD) of three independent experiments involving six analyses for each sample (n = 18). The statistical significance of differences was assessed by One-way ANOVA, followed by the Bonferroni Multiple Comparisons Test. *** = p < 0.001 vs. control cells (0). (b) The panels show representative images of phase contrast of control (untreated cells, Ctrl) and cells treated for 24 h with 1% and 2% v/v of DMSO. Bar = 100 μm.
Figure 3
Figure 3
Viability, expressed as % of the control (untreated cells, 0), induced by incubation for 24 h with different amounts (from 2.5 to 100 μM) of arzanol (ARZ), eupatilin (EUP), zerumbone (ZER), and xanthomicrol (XAN), and gemcitabine (positive control, GEM) in cancer SH-SY5Y cells (MTT assay). Data are presented as mean and standard deviation (SD) of three independent experiments involving six analyses for each sample (n = 18). The statistical significance of differences was assessed by one-way ANOVA followed by the Bonferroni Multiple Comparisons Test. For each series, *** = p < 0.001, ** = p < 0.01 vs. the respective control (0). For each concentration, °°° = p < 0.001, °° = p < 0.01 vs. ARZ; ### = p < 0.001, ## = p < 0.01, # = p < 0.05 vs. EUP; §§§ = p < 0.001, § = p < 0.05 vs. ZER; $$$ = p < 0.001, $ = p < 0.05 vs. XAN.
Figure 4
Figure 4
(a) Representative phase contrast images of SH-SY5Y control cells (untreated, Ctrl) and cells treated for 24 h with different amounts (2.5 to 100 μM) of arzanol (ARZ), eupatilin (EUP), zerumbone (ZER), and xanthomicrol (XAN). (b) Enlargement of images of SH-SY5Y cells treated with the compounds at 50 μM. Asterisks indicate areas characterized by a reduced cell density, while arrows and arrowheads point to rounded/granulated cells and membrane blebbing, respectively. Bar = 100 μm.
Figure 5
Figure 5
Fluorescence green emission images, by NucView 488 (NV) assay, obtained in SH-SY5Y control (untreated) cells (Ctrl) and cells pre-incubated for 2 h with different concentrations (25, 50, and 100 μM) of zerumbone (ZER), arzanol (ARZ), eupatilin (EUP), xanthomicrol (XAN), gemcitabine (GEM, positive control), and the maximal non-toxic vehicle dose (DMSO 1% v/v) (a). Intensity of NV green emission fluorescence, expressed as % control, obtained by image analysis for cells treated with ZER, ARZ, EUP, and XAN (b). All data are presented as mean and standard deviation (SD) of three experiments involving duplicate analyses for each sample (n = 6). The statistical significance of differences was assessed by One-way ANOVA, followed by the Bonferroni Multiple Comparisons Test. For each series: *** = p < 0.001, ** = p < 0.00, * = p < 0.05 vs. the respective control cells (0); °°° = p < 0.001, ° = p < 0.05 vs. 25 μM; §§§ = p < 0.001 vs. 50 μM. For each concentration, between different compounds ### = p < 0.001, ## = p < 0.01.
Figure 6
Figure 6
Fluorescence red emission images, by propidium iodide (PI) assay, obtained in SH-SY5Y control (untreated) cells (Ctrl) and cells pre-incubated for 2 h with different concentrations (25, 50, and 100 μM) of zerumbone (ZER), arzanol (ARZ), eupatilin (EUP), and xanthomicrol (XAN), gemcitabine (GEM, positive control), and the maximal non-toxic vehicle dose (DMSO 1% v/v) (a). Intensity of PI red emission fluorescence, expressed as % control, obtained for cells treated with ZER, ARZ, EUP, and XAN by image analysis (b). All data are presented as mean and standard deviation (SD) of three experiments involving duplicate analyses for each sample (n = 6). The statistical significance of differences was assessed by One-way ANOVA, followed by the Bonferroni Multiple Comparisons Test. For each series: *** = p < 0.001, ** = p < 0.01, * = p < 0.05 vs. the respective control cells (0); °° = p < 0.01, ° = p < 0.05 vs. 25 μM; § = p < 0.05 vs. 50 μM. For each concentration: ## = p < 0.01, # = p < 0.05 between different compounds.
Figure 7
Figure 7
Bioavailability radars (a) and “BOILED-Egg” graphs (b) by SwissADME web tool [44,51], computed for arzanol (ARZ), eupatilin (EUP), xanthomicrol (XAN), and zerumbone (ZER).
Figure 8
Figure 8
Summary of target classes by the SwissTargetPrediction web tool [46,53] computed for arzanol (ARZ), eupatilin (EUP), xanthomicrol (XAN), and zerumbone (ZER).
Figure 9
Figure 9
Heatmap of Pearson’s correlations (r) calculated between computed properties of arzanol (ARZ), eupatilin (EUP), xanthomicrol (XAN), and zerumbone (ZER) reported in Table 3 and mean values of cytotoxicity (% VR) and apoptosis induction (% Apoptosis NV and % Apoptosis IP) determined at the dose of 50 μM.

Similar articles

Cited by

References

    1. Naeem A., Hu P., Yang M., Zhang J., Liu Y., Zhu W., Zheng Q. Natural products as anticancer agents: Current status and future perspectives. Molecules. 2022;27:8367. doi: 10.3390/molecules27238367. - DOI - PMC - PubMed
    1. Choudhari A.S., Mandave P.C., Deshpande M., Ranjekar P., Prakash O. Phytochemicals in cancer treatment: From preclinical studies to clinical practice. Front. Pharmacol. 2020;10:1614. doi: 10.3389/fphar.2019.01614. - DOI - PMC - PubMed
    1. Situmorang P.C., Ilyas S., Nugraha S.E., Syahputra R.A., Nik Abd Rahman N.M.A. Prospects of compounds of herbal plants as anticancer agents: A comprehensive review from molecular pathways. Front. Pharmacol. 2024;15:1387866. doi: 10.3389/fphar.2024.1387866. - DOI - PMC - PubMed
    1. Appendino G., Ottino M., Marquez N., Bianchi F., Giana A., Ballero M., Sterner O., Fiebich B.L., Munoz E. Arzanol, an antiinflammatory and anti-HIV-1 phloroglucinol alpha-pyrone from Helichrysum italicum ssp. microphyllum. J. Nat. Prod. 2007;70:608–612. doi: 10.1021/np060581r. - DOI - PubMed
    1. Rosa A., Deiana M., Atzeri A., Corona G., Incani A., Melis M.P., Appendino G., Dessì M.A. Evaluation of the antioxidant and cytotoxic activity of arzanol, a prenylated alpha-pyrone-phloroglucinol etherodimer from Helichrysum italicum subsp. microphyllum. Chem. Biol. Interact. 2007;165:117–126. doi: 10.1016/j.cbi.2006.11.006. - DOI - PubMed

Publication types

MeSH terms