

Plasticity and Co-Factor-Dependent Structural Changes in the RecA Nucleoprotein Filament Studied by Small-Angle X-Ray Scattering (SAXS) Measurements and Molecular Modeling
- PMID: 40333744
- PMCID: PMC12029565
- DOI: 10.3390/molecules30081793
Plasticity and Co-Factor-Dependent Structural Changes in the RecA Nucleoprotein Filament Studied by Small-Angle X-Ray Scattering (SAXS) Measurements and Molecular Modeling
Abstract
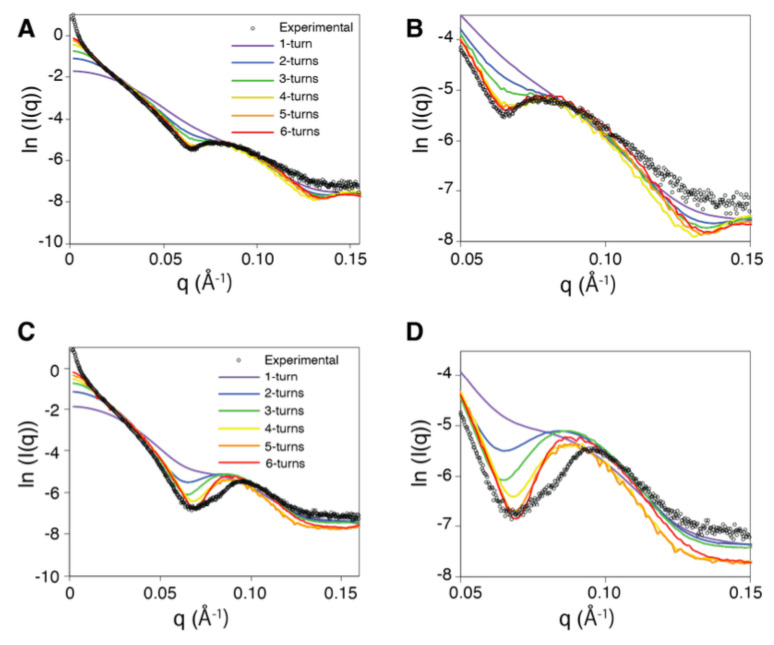
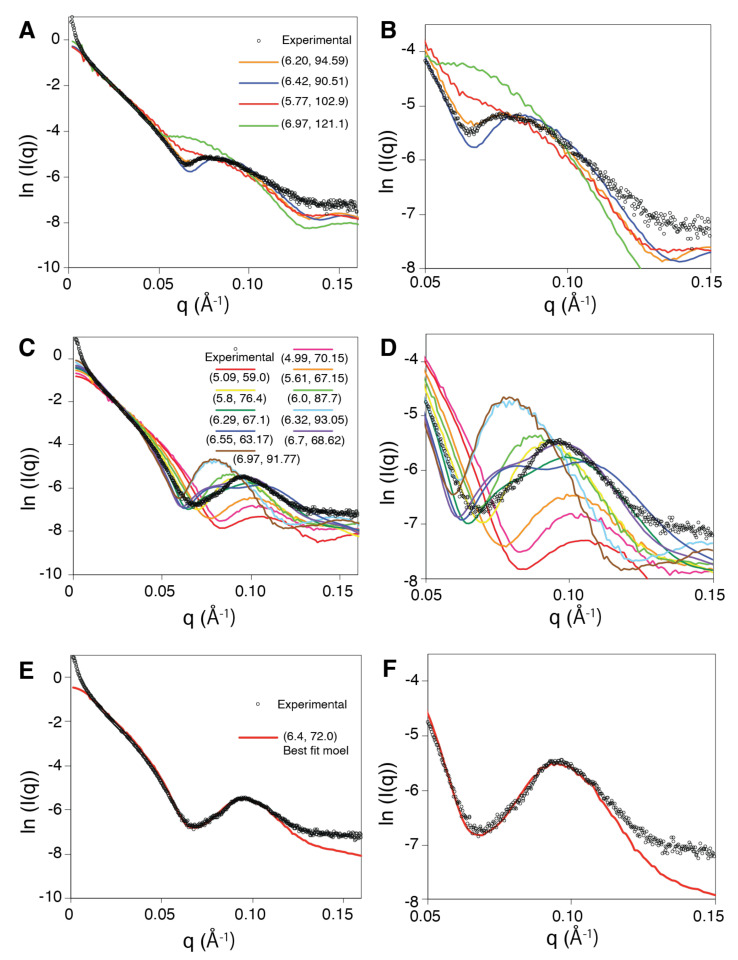
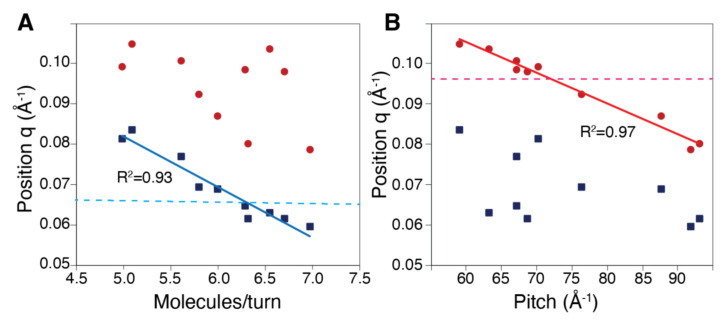
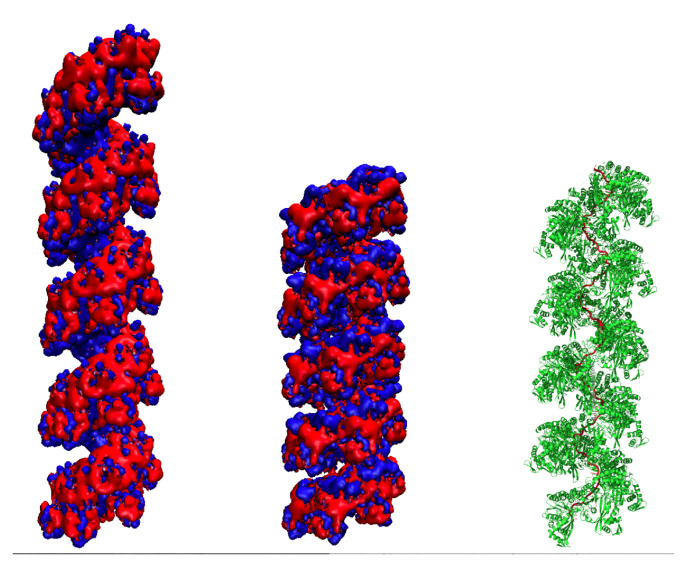
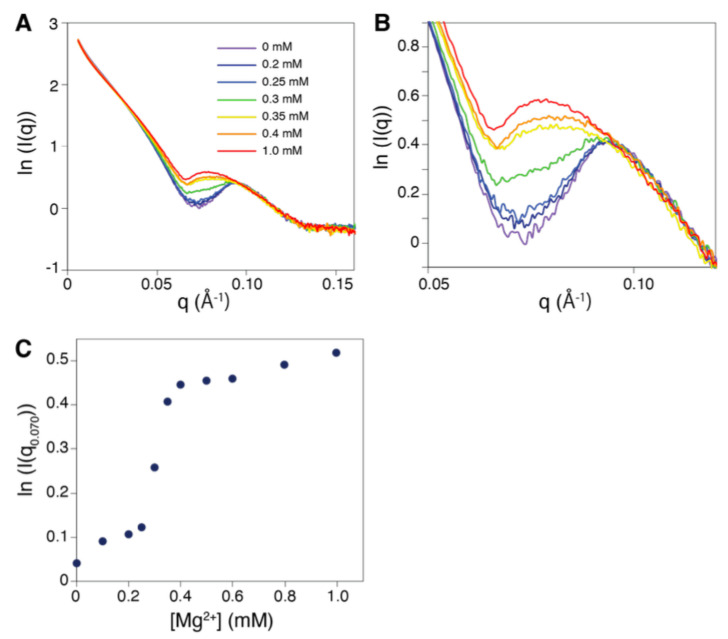
Structural analyses of protein filaments formed by self-assembly, such as actin, tubulin, or recombinase filaments, have suffered for decades from technical issues due to difficulties in crystallization, their large size, or the dynamic behavior inherent to their cellular function. The advent of cryo-electron microscopy has finally enabled us to obtain structures at different stages of the existence of these filaments. However, these structures correspond to frozen states, and the possibility of observations in solution is still lacking, especially for filaments characterized by a high plasticity, such as the RecA protein for homologous recombination. Here, we use a combination of SAXS measurements and integrative modeling to generate the solution structure of two known forms of the RecA nucleoprotein filament, previously characterized by electron microscopy and resolved by X-ray crystallography. The two forms differ in the cofactor bound to RecA-RecA interfaces, either ATP or ADP. Cooperative transition from one form to the other has been observed during single-molecule experiments by pulling on the filament but also in solution by modifying solvent conditions. We first compare the SAXS data against known structural information. While the crystal structure of the ATP form matches well with the SAXS data, we deduce from the SAXS profiles of the ADP-form values of the pitch (72.0 Å) and the number of monomers per turn (6.4) that differ with respect to the crystal structure (respectively, 82.7 Å and 6.0). We then monitor the transition between the two states driven by the addition of magnesium, and we show this transition occurs with 0.3 mM Mg 2+ ions with a high cooperativity.
Keywords: RecA nucleofilament; SAXS; helical protein assembly; integrative modeling; protein filament plasticity.
Conflict of interest statement
The authors declare no conflicts of interest. The funders had no role in the design of the study; in the collection, analyses, or interpretation of data; in the writing of the manuscript; or in the decision to publish the results.
Figures
Similar articles
-
Evidence for elongation of the helical pitch of the RecA filament upon ATP and ADP binding using small-angle neutron scattering.Eur J Biochem. 1995 Oct 15;233(2):579-83. doi: 10.1111/j.1432-1033.1995.579_2.x. Eur J Biochem. 1995. PMID: 7588804
-
Comparison of bacteriophage T4 UvsX and human Rad51 filaments suggests that RecA-like polymers may have evolved independently.J Mol Biol. 2001 Oct 5;312(5):999-1009. doi: 10.1006/jmbi.2001.5025. J Mol Biol. 2001. PMID: 11580245
-
RecA protein dynamics in the interior of RecA nucleoprotein filaments.J Mol Biol. 1996 Apr 12;257(4):756-74. doi: 10.1006/jmbi.1996.0200. J Mol Biol. 1996. PMID: 8636980
-
What is the structure of the RecA-DNA filament?Curr Protein Pept Sci. 2004 Apr;5(2):73-9. doi: 10.2174/1389203043486883. Curr Protein Pept Sci. 2004. PMID: 15078218 Review.
-
Geometry of the DNA strands within the RecA nucleofilament: role in homologous recombination.Q Rev Biophys. 2003 Nov;36(4):429-53. doi: 10.1017/s0033583504003956. Q Rev Biophys. 2003. PMID: 15267169 Review.
References
MeSH terms
Substances
Grants and funding
LinkOut - more resources
Full Text Sources
